Abstract
The overall folded (global) structure of mRNA may be critical to translation and turnover control mechanisms, but it has received little experimental attention. Presented here is a comparative analysis of the basic features of the global secondary structure of a synthetic mRNA and the same intracellular eukaryotic mRNA by dimethyl sulfate (DMS) structure probing. Synthetic MFA2 mRNA of Saccharomyces cerevisiae first was examined by using both enzymes and chemical reagents to determine single-stranded and hybridized regions; RNAs with and without a poly(A) tail were compared. A folding pattern was obtained with the aid of the mfold program package that identified the model that best satisfied the probing data. A long-range structural interaction involving the 5′ and 3′ untranslated regions and causing a juxtaposition of the ends of the RNA, was examined further by a useful technique involving oligo(dT)-cellulose chromatography and antisense oligonucleotides. DMS chemical probing of A and C nucleotides of intracellular MFA2 mRNA was then done. The modification data support a very similar intracellular structure. When low reactivity of A and C residues is found in the synthetic RNA, ≈70% of the same sites are relatively more resistant to DMS modification in vivo. A slightly higher sensitivity to DMS is found in vivo for some of the A and C nucleotides predicted to be hybridized from the synthetic structural model. With this small mRNA, the translation process and mRNA-binding proteins do not block DMS modifications, and all A and C nucleotides are modified the same or more strongly than with the synthetic RNA.
The control mechanisms of mRNA translation and turnover are critical to understanding the regulation of gene expression. Sequences in mRNAs play significant roles in both processes, and the secondary structure of the mRNA may also be very important. A recent review (1) describes the diverse elements that constitute the secondary structure of RNA molecules and gives examples of their functional value. The effects of structural features known to affect the translational efficiency of an mRNA molecule have recently been described (2–4). The studies show that secondary structure downstream of the initiation codon can stimulate translation by slowing the initiator-codon scanning mechanism and that stable secondary structure in the 5′ untranslated region (UTR) can strongly inhibit translation. Specific RNA structural features such as the iron-responsive element, polypyrimidine tracts, and sites located in the 3′ UTR that control both mRNA translation and turnover all are examples of local structures that have recently been reviewed (2, 5).
With mRNAs, both local and long-range structural interactions may be of considerable importance, but the overall folded or global structure of mRNAs has received very little experimental attention. Several studies suggest the possible involvement of global structure in both mRNA translation and turnover reactions. On the basis of experimental details that made it difficult to correlate the effects of artificial secondary structures on mRNA translation and turnover in yeast using a chimeric RNA, it was proposed that the global structure of mRNAs may be involved in control of these processes (6). Recent results showed that several regions within interleukin 11 mRNA are involved in phorbol 12-tetradecanoate 13-acetate (TPA)-stimulated stabilization of the RNA (7). The authors suggested that the different sequences could interact and contribute to a unique RNA folding conformation. In describing cross-talk that likely occurs between mRNA 5′ and 3′ elements as far as both translation and turnover are concerned, it was suggested that secondary structure(s) may be involved and that the interaction need not be very stable or long-lived (8). These studies suggest that determination of the global structures of mRNAs will be important for resolving long-range interactions between sequences.
Certainly, more experimental analysis such as chemical and enzymatic probing of the basic global structure of mRNAs is needed. Addressed in this paper is the question of the validity of comparing the secondary structure of in vitro mRNA with that of intracellular mRNA. Studies of specific local structural elements (usually strong-stem structures) using mutational analysis have shown that these specific elements are also found in the intracellular mRNA (2). However, a complete analysis and comparison of structural features of a eukaryotic intracellular mRNA and a synthetic mRNA for their full length have not been done. In vitro and intracellular dimethyl sulfate (DMS) probing has been used to analyze features of the structures of rRNA (9), small nucleolar U3 RNA (10), and pre-mRNA (11, 12), especially to determine the effect of protein binding on the structures. Such an analysis of secondary structure is described here for yeast MFA2 mRNA that encodes the mating pheromone a factor (13). Its small size (328 nt) facilitates examination by chemical and enzymatic probing analysis. Emphasis was placed first on an analysis of the secondary structure of synthetic RNAs [with and without a poly(A) tail] in vitro to determine the model that best fits the probing data. The intracellular mRNA was then probed in vivo by using DMS to detect A and C modifications. The two sets of DMS modification data were compared to determine the effects of both the translation process and RNA-binding protein interactions on the secondary structure of the RNA.
MATERIALS AND METHODS
Plasmids.
pSM29 was the kind gift of Susan Michaelis (Johns Hopkins University School of Medicine, Baltimore), and pRP412 and pRP410 were gifts of Denise Muhlrad, Carolyn J. Decker, and Roy Parker (University of Arizona, Tucson). pSM29 was used as a PCR template for synthesis of plasmids for transcription. For synthesis of pT7A0, the deoxyoligonucleotides 5′-CACATACTAATACGACTCACTATAGGGCGAGCTATCATCTTCATACAAC and 3′-CATGAAAAAATCTGTTAAAGTGATAAC were used. The PCR product was ligated into pUC18, predigested with EcoRI, and filled in with Klenow DNA polymerase. For pT7A18 and pT7A38, the 5′ oligonucleotide used for PCR was CCCGGGAATTCCTAATACGACTCACTATAGGGCGAGCTATCATCTTCATACAAC and the 3′ oligonucleotides were CCCGGGAAGCT(T)nCATGAAAAAATCTGTTAAAGTGATAAC with (T)n being either 18 or 38. The PCR products were digested with HindIII and EcoRI and ligated into pUC18. The primers for pSP6A0 were 5′-CACATACGATTAGGTGACACTATAGAAGCGAGCTATCATCTTCATACAAC and 3′-CATGAAAAAATCTGTTAAAGTGATAAC. The PCR product was cloned into pBS+ (Stratagene) by blunt-end ligation into the SmaI site. An ApaI site was engineered at the 3′ end by site-directed mutagenesis (14). The plasmids were transformed into DH5α (GIBCO/BRL), and DNAs were prepared by using the Qiagen (Chatsworth, CA) Maxi system. DNAs were then purified further by using fast protein liquid chromatography (FPLC) on MonoQ columns (15). The sequences of all of the DNAs were verified. The plasmids were cut with EcoRI (pT7A0), ApaI (pSP6A0), or HindIII (others) for transcription. Mung-bean nuclease (GIBCO/BRL) was used to trim off the overhangs.
Synthesis of MFA2 RNAs and Labeling of 5′ Ends.
DNAs were transcribed by using the RiboMax large-scale RNA production systems (Promega). In most cases, [3H]UTP was used to label the RNAs for quantitation. The 5′ end of RNA was labeled with [α-32P]GTP by using guanylyltransferase (GIBCO/BRL) (16). The reactions yielded a G[32P]pppG 5′ end, i.e., an unmethylated cap structure. Preliminary enzymatic probing studies indicated no difference in the results if adenosylmethionine was included in the transferase mixtures to yield an m7G[32P]pppG end.
Secondary Structure Probing using RNases and Chemicals.
T1 (Pharmacia), T2 (Sigma), and V1 (Pharmacia) nucleases were used for enzymatic structure probing (17). Chemical modifications with DMS and 1-cyclohexyl-3-(2-morpholinoethyl)carbodiimide metho-p-toluenesulfonate (CMC) were done in 10-μl and 250-μl reactions, respectively, as described (18, 19). For primer extensions, primers were labeled with [γ-32P]ATP and combined with 50 ng of synthetic RNA. Hybridization and reverse transcription (murine leukemia virus reverse transcriptase) were carried out as described (20). The samples were analyzed on 8% polyacrylamide sequencing gels containing 7.5 M urea. With the synthetic RNA, CMC and DMS modification sites were always analyzed on the same gel for comparison and identification of reactive residues.
In Vivo DMS Treatment.
The yeast strain BJ5464 (MATa ura3–52 trp-1 leu2delta1 his3delta200 GAL; Yeast Genetic Stock Center, Berkeley, CA) was transformed with pRP410 containing the MFA2 gene under the regulation of the GAL1 upstream activating sequence (21). Cells were grown for 18 h at 30°C in synthetic minimal medium minus uracil and containing 2% glucose, 2% lactic acid, and 3% glycerol. The cells were inoculated into the same medium minus glucose and grown to an A650 of 1.0–1.2. Galactose was added to 2.4% and after 2 h, DMS treatment was carried out as described (11). DMS (200 μl of a 1:10 dilution of DMS per 10 ml of cells) was used for a 2-min period. The DMS control was as described (11). RNA was isolated (12) and 10 μg was used in the primer extensions.
Computer-Assisted Folding Analysis.
Computer-assisted folding, based on free-energy minimization, was performed by using the mfold program (22). This program is part of the Wisconsin Package, Version 9.0 (Genetic Computer Group, Madison, WI).
Oligo(dT)-Cellulose Analysis of Secondary Structure.
For oligo(dT)-cellulose chromatography of RNase T1-cleaved T7A38 RNA, the RNA was labeled at the 5′ end and cleaved as described in the Fig. 4 Legend. The reaction mixtures (200 μl) were diluted with 300 μl of binding buffer (25 mM Tris⋅HCl, pH 7.6/200 mM NaCl/5 mM MgCl2/l mM EDTA/0.1% SDS) and applied to 0.5 ml (0.8 × 1 cm) columns of oligo(dT)-cellulose at 25°C. The oligo(dT)-unbound fraction was eluted with 2.5 ml of binding buffer and precipitated with ethanol after the addition of 50 μg of yeast tRNA (GIBCO/BRL). The oligo(dT)-bound RNA was then eluted with 2.5 ml of a low-salt elution buffer (25 mM Tris⋅HCl, pH 7.6/1 mM EDTA/0.1% SDS) and precipitated with ethanol as described above.
Figure 4.
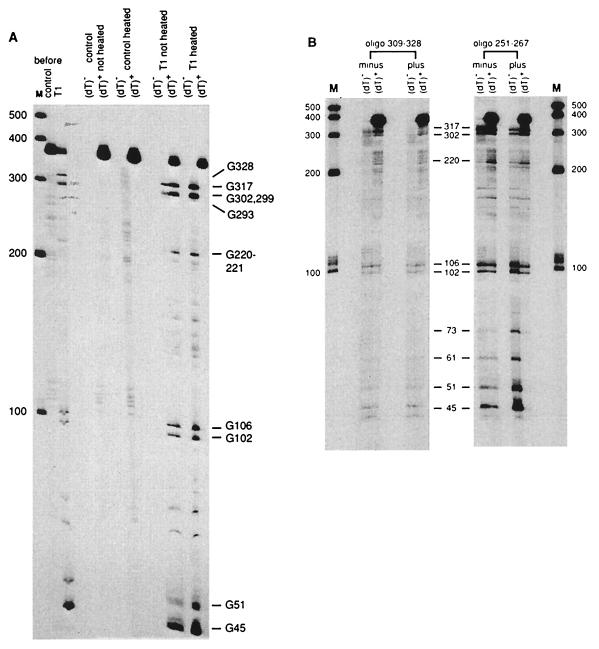
Oligo(dT)-cellulose chromatography of RNase T1-cleaved MFA2 T7A38 RNA and the effect of antisense oligonucleotides. (A) T7A38 RNA (2.5 μg, prelabeled at the 5′ end) was incubated in reaction mixtures (20 μl) with no enzyme (control) or with 0.13 unit of RNase T1 for 4 min at 37°C. A 2-μl sample of each mixture was taken for gel analysis (shown at Left, control and T1, before). The reaction mixtures were then diluted with 400 μl of oligo(dT)-cellulose binding buffer (described in Materials and Methods). A 200-μl portion was heated for 3 min at 90°C, cooled rapidly, and held at 25°C for 5 min. The heated and unheated samples were then diluted and applied to oligo(dT)-cellulose columns as described in Materials and Methods. Gel analysis of the oligo(dT)-cellulose unbound (dT)− and bound (dT)+ fractions was done by using a 6% polyacrylamide gel. Ambion RNA markers are shown on the left and T1 cleavage sites on the right. (B) Labeled T7A38 RNA was annealed with and without the antisense oligonucleotides as described in Materials and Methods. The RNAs were then cleaved with 0.02 unit of RNase T1 (nucleotide 309–328 oligonucleotide) or 0.04 unit of RNase T1 (nucleotide 251–267 oligonucleotide) in 10-μl reactions. The remainder of the experiment was similar to that described in Fig. 4A for the unheated sample. T1 cleavage sites are shown in the middle and Ambion (Austin, TX) RNA markers on the left and right.
Annealing of Antisense Oligonucleotides to T7A38 MFA2 RNA.
T7A38 RNA (1.5 μg), prelabeled at the 5′ end, was incubated with the oligonucleotides (10× molar amount) in 50 mM Tris⋅HCl (pH 8.0), 0.5 mM EDTA, 50 mM NaCl, 10 mM MgCl2, and 0.2% SDS. After 4 min at 70°C, the mixtures were slow-cooled to 25°C over a period of 3 h. The mixtures were then placed in ice for 3 h, followed by precipitation with ethanol.
RESULTS
Synthetic MFA2 mRNAs Used for Secondary-Structure Analysis.
Transcripts containing two modifications of the 5′ terminal end sequences of MFA2 mRNA were used as well as synthetic RNAs containing no poly(A) tail, an (A)18, or an (A)38 tail. The 5′ end sequence modifications were for production of high levels of RNA with either T7 or SP6 RNA polymerase. RNAs transcribed with T7 RNA polymerase differ from the sequence previously described (23) by having a GG instead of a CA at the 5′ end. An RNA transcribed with SP6 RNA polymerase differs by a GA replacing the terminal C residue. The RNAs with and without a poly(A) tail were used to determine whether features of the secondary structure may be affected by a poly(A) tail. The T7 transcripts are called T7A0, T7A18, and T7A38, according to the length of the poly(A) tail. The SP6 transcript is called SP6A0 RNA.
Enzymatic and Chemical Probing Analysis of T7A0, T7A18, and T7A38 RNAs.
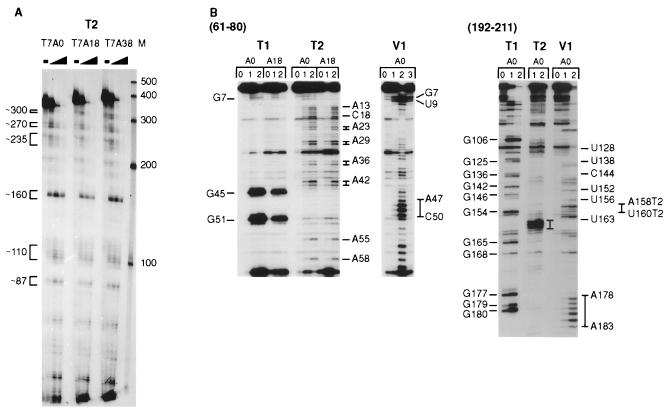
Enzymatic probing experiments were done first to evaluate the entire synthetic MFA2 mRNA structure both with and without a poly(A) tail. Fig. 1A shows an electrophoretic analysis of the major cleavage fragments formed upon treatment of 5′ end-labeled T7A0, T7A18, and T7A38 RNAs with RNase T2 (cleaves 3′ of single-stranded nucleotides). The detectable cleavage sites, shown at the Left of the Figure, are the same for the RNAs with and without a poly(A) tail.
Figure 1.
Enzymatic probing analysis of T7A0, T7A18, and T7A38 MFA2 RNAs. (A) The RNAs were labeled at the 5′ end and cleaved with RNase T2 as described in Materials and Methods. The amount of RNase T2 used for each RNA was none, 0.002, 0.006, and 0.02 unit, and a 6% polyacrylamide gel was used for analysis. Ambion (Austin, TX) RNA markers are shown on the right. (B) RNAs were cleaved with RNase T1, T2, and V1. For RNase T1, the lanes labeled 0, 1, and 2 were no, 0.04, and 0.08 unit of enzyme. For RNase T2, the same lanes were no, 0.0012, and 0.004 unit. The RNase V1 cleavage reactions were done with no (0), 0.04 (1), 0.2 (2), and 1.2 (3) unit of enzyme. Primer extension analysis was done as described under Materials and Methods using primers complementary to the MFA2 sequence shown at the top. The T1 cleavage sites are shown on the left and the T2 and V1 sites on the right. With the nucleotide 192–211 antisense primer, the T2 sites are designated T2 after the site.
Primer extension analyses of RNase T1 (cleaves 3′ of single-stranded guanosine nucleotides), T2, and V1 (cleaves at double-stranded or stacked nucleotides) cleavage sites were done by using five different 20- or 21-nt antisense oligonucleotide primers for an examination of most regions of the RNA. Results with two of these primers (one at the RNA 5′ end and one in the middle) are shown in Fig. 1B. The moderate-to-strong T2 and V1 cleavage sites are labeled. The RNase T1 cleavage sites were used as markers. The T7A0 and T7A18 RNAs are compared with T1 and T2 RNases by using the nucleotide 61–80 antisense primer and show similar patterns of cleavage.
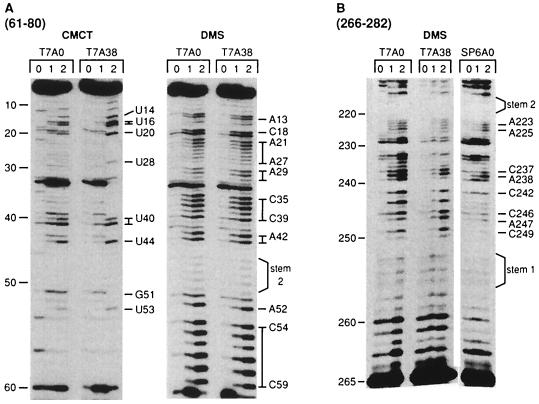
Chemical probing was then done by using DMS, which modifies single-stranded C and A residues, and CMC, which modifies single-stranded U and G residues. Fig. 2A shows a comparative analysis of the reactivity of the T7A0 and T7A38 RNAs in the sequence from nucleotide 1–60. Little reactivity is found with either DMS or CMC from nucleotide 1–10. Both reagents show reactivity with the residues from nucleotide 12–44, suggesting a single-stranded loop region. The residues from nucleotide 45–51 are weakly modified, whereas those from nucleotide 52–59 are strongly modified.
Figure 2.
Primer extension analysis of DMS and CMC modifications of MFA2 T7A0, T7A38, and SP6A0 RNAs. The lanes marked 0, 1, and 2 for the DMS modifications were done at 37°C with no DMS (20 min) and with 1 μl of 1:40 diluted DMS for 5 min and 20 min, respectively. The lanes marked 0, 1, and 2 for the CMC modifications were no CMC (20 min), 50 μl of CMC (42 mg/ml for 3 min), and 50 μl of CMCT (20 min), all at 22°C. Primer extension was done as described in Fig. 1, and the primers used were complementary to the RNA sequence shown at the top. Overall band labeling is shown on the left and modified bands on the right. Fig. 5 shows results that verify the band labeling. The stem 1 and stem 2 labeling on the right was included after these hybridized regions were identified (see Fig. 3).
Fig. 2B presents results with DMS-modified T7A0, T7A38, and SP6A0 RNAs from nucleotide 210 to 260 for an evaluation of 3′ UTR residues in this region. SP6A0 RNA was also compared with the T7A0 and T7 A38 RNAs. DMS reactivity is weak with the residues from nucleotide 252 to 257. Strong reactivity of residues from nucleotide 237–249 is found, suggesting a loop region. The reactivity of the SP6A0 RNA is similar to the RNAs prepared with the T7 promoter, and the data support a similar structure for the three RNAs analyzed, one differing in the 5′ end sequence modification (SP6A0) and one containing a poly(A) tail. Further DMS modification data with SP6A0 RNA are shown in Fig. 5.
Figure 5.
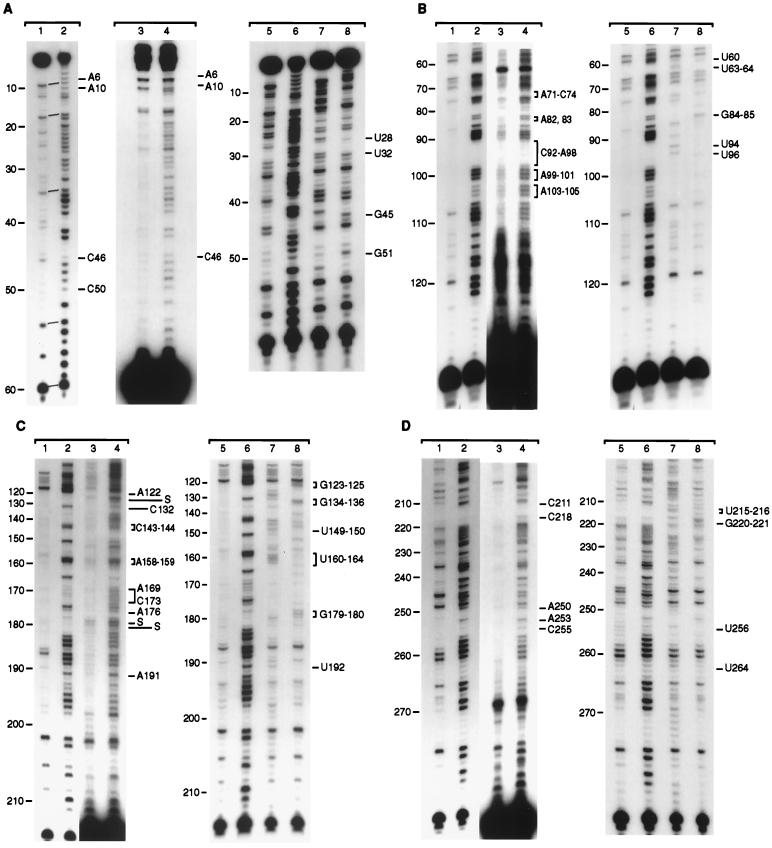
DMS modification data with synthetic and intracellular MFA2 mRNA. (A–D) DMS-treated intracellular mRNA and synthetic SP6A0 RNA were analyzed by primer extension as described in Materials and Methods. Synthetic SP6A0 RNA was modified with DMS as described in Fig. 2 (20-min reaction). Oligonucleotide primers used were complementary to the following RNA sequences: nucleotides 61–80 (A), nucleotides 132–151 (B), nucleotides 215–234 (C), and nucleotides 285–304 (D). Lanes 1 and 2 show the synthetic RNA with no and DMS modifications, and lanes 3 and 4 show the same with the in vivo RNA. Overall band labeling (S is a reverse transcriptase stall) is shown on the left and special modification sites referred to in the text on the right. Lanes 5 and 6 in each case show the DMS control and modification data with the SP6A0 synthetic RNA and lanes 7 and 8 show the results when ddATP and ddCTP, respectively, were added to the reverse transcriptase reaction mixtures of control RNA (as described in ref. 18). The U and G bands are labeled (right) and verify the DMS band labeling results (left). The analyses were run on 8% sequencing gels.
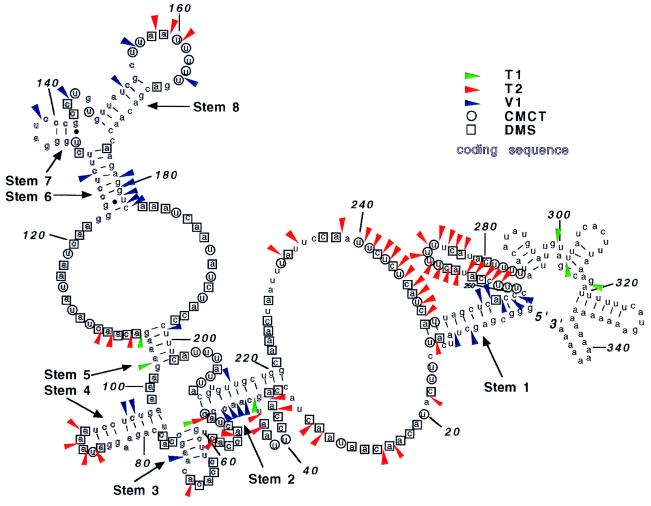
Fig. 3 summarizes the enzymatic and chemical structure probing data found with the synthetic mRNAs. No significant differences were found in the probing data for RNA with or without a poly(A) tail. The data were used as constraints with the mfold program package, and the model that best fits the probing data is presented. Stems (helices) are labeled starting from the 5′ end as stems 1–8. They are important for the comparative structural analysis described below. Little probing information was obtained for the sequence from nucleotide 280 to 328 because of limitations of the primer extension analysis.
Figure 3.
Secondary-structure model of synthetic MFA2 T7A18 mRNA. The moderate-to-strong cleavage sites found with the three RNases and the same sites of chemical modification by DMS and CMC were used as constraints with the mfold program package. These sites are superimposed on the structural model. Short stems found with mfold, but not detected by the probing results, are not included in the model. The numbers indicate the nucleotide positions relative to the 5′ end. The figure was drawn with the help of loopdloop [Gilberg, D. G. (1992), available via anonymous ftp from ftp.bio.indiana.edu].
Oligo(dT)-Cellulose Chromatographic Analysis of the MFA2 mRNA Structure.
To help verify the long-range interactions involving stems 1 and 2, a procedure using oligo(dT)-cellulose was used (24). The T7A38 RNA was labeled at the 5′ end with [32P]Gppp and partially digested with RNase T1. The fragments were then passed through an oligo(dT)-cellulose column. The binding of 5′ end-labeled fragments to the column would indicate an interaction (short- or long-range) between sequences upstream and downstream of the cleavage site. Fig. 4A shows the analysis of cleaved T7A38 RNA and a control reaction mixture (no enzyme). T1 cleavage sites are detected at G45, G51, G102, G106, G220–221, G293, G299, G302, and G328. With heating of the reaction mixtures before loading on the oligo(dT)-cellulose column, no 32P-labeled fragments are retained. Without heating, substantial binding of all of the RNase fragments occurs. The RNase fragments produced by cleavages at G45, G51, G102, and G106 (all at the ends of stem structures) are bound less well (about 40–60%) than the fragments resulting from cleavages at downstream sites (bound more than 70%). Hybridization of 5′ labeled fragments resulting from these cleavages (G45 to G106) to downstream sequences containing the poly(A) tail involve only the stem 1 and stem 2 structures shown in Fig. 3.
To further analyze the interactions of stems 1 and 2, two antisense oligonucleotides were annealed to the T7A38 RNA, followed by RNase T1 cleavage and oligo(dT)-cellulose chromatography. One antisense oligonucleotide, complementary to nucleotides 251–267, was expected to disrupt the stem 1 structure. The second antisense oligonucleotide, complementary to nucleotides 309–328, was used for comparison. The experiment with the nucleotides 309–328 antisense oligonucleotide is shown at the Left in Fig. 4B (Left). Annealing of the oligonucleotide (“plus” lanes) prevents the RNase T1 cleavage at G317 but otherwise does not affect the cleavage sites found or the behavior of the fragments on oligo(dT)-cellulose chromatography as compared with the RNA without the oligonucleotide (“minus” lanes). The results with the nucleotides 251–267 antisense oligonucleotide are shown in Fig. 4B (Right). Annealing of the nucleotide 251–267 antisense oligonucleotide (“plus” lanes) causes a much stronger cleavage of G residues at positions 45, 51, 61, and 73 and slightly stronger cleavage at G102 and G106, as compared with RNA without the oligonucleotide (“minus” lanes). With annealing of the oligonucleotide, the fragments resulting from cleavages at these sites are also bound much more poorly to the oligo(dT)-cellulose. The results indicate that stem 1 is disrupted by pairing of the nucleotides 251–267 antisense oligonucleotide, resulting in an alternate structure for the RNA in the sequence from nucleotides 1 to 73. That the binding of this antisense oligonucleotide disrupts the structure in this manner supports the long-range interaction shown in Fig. 3.
Intracellular and in Vitro DMS Structure Probing and Comparisons.
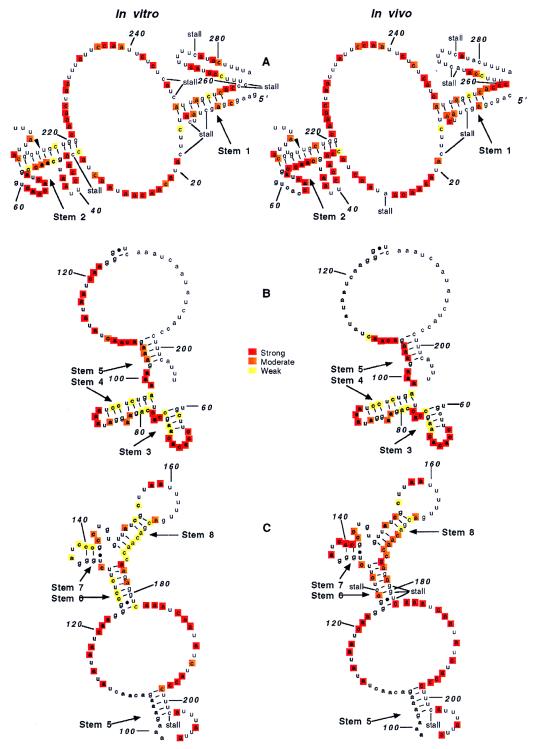
To determine whether intracellular MFA2 mRNA, involved in various stages of metabolism, has a secondary structure similar to the synthetic RNA, intracellular DMS-modified RNA was also examined by primer extension. The experiments, using four antisense oligonucleotides, were done with mRNA obtained from DMS-treated cells. Data directly comparing the intracellular and the SP6A0 synthetic RNA are shown in Fig. 5 A–D. SP6A0 RNA was used because it lacks, as does the in vivo RNA, the GGG sequence at the 5′ end. In all cases, the in vitro results are shown in lanes 1 (no DMS) and 2 (with DMS), and the in vivo results are shown in lanes 3 (DMS control) and 4 (with DMS). Lanes 5–8 (described in the legend) were used for band identification. In Fig. 5A, the MFA2 RNA sequence from nucleotides 1 to 55 was examined. The in vitro results are quite similar to the DMS modification data shown for the T7A0 and T7A38 RNAs in Fig. 2A, except for a slightly stronger reactivity of C4, A6, and A10 and a moderate—as opposed to weak—reaction of A and C residues from nucleotides 46 to 50. The results suggest that the 5′ terminal GGG sequence of the T7 RNA produces a more stable stem 1 and stem 2 structure. With the in vivo RNA, species with different 5′ termini are found as shown by the bands at the top. Low DMS reactivity is found at A6, A10, and C46. The residues from A47 to C50 are more strongly modified in the in vivo RNA.
Fig. 5B shows the DMS modification data for the RNA sequence from about nucleotide 60 to 110. A and C residues in stems 3, 4, and 5 can be compared. The modification data of A and C residues from nucleotides 60 to 102 are very similar in the two RNAs, making it very likely that stems 3 and 4 exist in hairpin loop structures in the intracellular RNA. A difference in reactivity of the A residues is found from nucleotides 103 to 105. These A residues react strongly in vivo, but only moderately in the synthetic RNA. The results indicate that stem 5 is not found in vivo or has very low stability.
In Fig. 5C, the reactivity of A and C residues from nucleotides 120 to 210 is shown. The data from nucleotides 160 to 180 show one strand of stems 6 and 8. In the synthetic RNA, A and C residues at nucleotides 166, 167, 169–173, 176, and 178 react weakly. In vivo, the same nucleotides are also relatively more resistant (reacting moderately) to DMS, suggesting the presence of the same stems. A difference in reactivity is found from nucleotides 133 to 142 with the two RNAs, supporting a hairpin structure in the synthetic RNA, which is not found in the intracellular RNA.
Fig. 5D shows the DMS modification data from nucleotides 211 to 280. The reactivity in this sequence is quite similar in vitro and in vivo. C255 reacts weakly with both RNAs, and A250 and A253 are more moderately modified than adjacent A and C residues. C residues at nucleotides 211 and 218 in stem 2 react weakly in both RNAs.
Fig. 6 summarizes the DMS modification data shown in Fig. 5 and compares the in vitro and in vivo RNA. Results with each of the four antisense oligonucleotides are displayed by using the appropriate portions of the structural model shown in Fig. 3. The modifications are ranked strong (red), moderate (orange), and weak (yellow).
Figure 6.
MFA2 mRNA structure models showing DMS modification data. The three sets of models portray separately the modification results found and shown in Fig. 5. A shows the results of Fig. 5A and 5D, B shows the results of Fig. 5B, and C of Fig. 5C. The ranking of the extent of modification (strong, moderate, weak) was done by both visual comparisons of the intensity of bands (using weak for little or no modification and strong for modifications such as that of A and C residues in single-stranded loop regions) and by quantitative analysis of some of the gels using a Fuji phosphoimager.
DISCUSSION
Structure probing was combined with computer-assisted folding based on free-energy minimization to carefully analyze the secondary structure of synthetic MFA2 mRNA. Enzymatic digests of the RNA and primer extension products of digested RNAs were first examined for an evaluation of cleavage sites throughout the RNA. Chemical modifications using both DMS and CMC were then examined. A consensus structure was predicted by using the data as constraints with mfold. No significant difference in the structure of the RNAs containing no tail, an A18, or an A38 poly(A) tail was found. Features of the secondary structure include extensive pairing between the coding region and the 3′ UTR. About one-third of the bases are paired for nucleotides 1–285. These double-stranded regions may be very important for the orientation of the overall global structure and could potentially affect translation. Little experimental data were obtained for the sequence from nucleotides 285 to 328 because of the difficulty in analyzing this region by primer extension. The large loop structures from nucleotides 14 to 33 and from nucleotides 222 to 249 (Figs. 3 and 6) may be interrupted by short stem structures as predicted by computer folding; however, such short stems were not detected by the probing data.
The intracellular DMS modification data show that this small mRNA has a similar structure to that of the synthetic mRNA. When low reactivity of A and C residues is found in the synthetic RNA, approximately 70% of the same sites are relatively more resistant to DMS modification in vivo. A and C nucleotides in predicted loop regions are strongly modified in both RNAs. The results indicate that the translation process and RNA-binding protein interactions do not modify most features of the secondary structure or that resulting structural alterations are short-lived or dynamic. A and C residues in stem 1 react similarly in the synthetic and intracellular RNAs. Stem structures 3 and 4, resulting from local interactions of nucleotides in the coding sequence, are found in both RNAs. At some positions, stems with lower stability are suggested by a higher relative DMS reactivity of A and C residues. For example, four A and C residues in stem 2 and three A residues in stem 5 show moderate reactivity in vitro and strong reactivity in vivo. Stem 8 residues are weakly modified in the synthetic RNA and moderately in the intracellular RNA. Stems 6 and 8 orient the folded structure, bending it back, and thus may play important roles in the overall global structure. The secondary structure from nucleotides 133 to 142 is not the same in the intracellular RNA, and this short sequence appears single-stranded in vivo because all C and A residues react strongly with DMS.
In support of mRNAs having similar in vivo and in vitro structures, a technique involving RNase H treatment to identify the sequences within an RNA molecule that interact with a random pool of cDNA fragments has been described (25). The RNA sequences identified with c-raf mRNA were compared with a previously reported profile of antisense oligonucleotides active in vivo. Thirteen of 20 oligonucleotides showed related reactivity, suggesting similar structural features for the in vitro and intracellular mRNA.
The results presented here support a long-range interaction involving stems 1 and 2 that causes a juxtapositioning of the 5′ and 3′ ends of the MFA2 mRNA. The interaction was investigated further with the synthetic RNA by using a new technique involving oligo(dT)-cellulose chromatography of 5′ end-labeled poly(A) RNA. The technique detects long-range intramolecular pairing, and the results found are supportive of the hybridizations involving stems 1 and 2. The technique takes advantage of site-directed immobilization and labeling of the RNA to assess the connectivity between the 3′ and 5′ ends. The antisense oligonucleotide results described here suggest that intermolecular interactions are not affecting the oligo(dT)-cellulose results. Tertiary structure, however, not considered here, may certainly have an effect. The stem 1 and stem 2 interactions may be important in facilitating events leading to interaction of proteins bound at the two ends of the RNA (26).
The results presented here support the use of in vitro structural probing to analyze mRNA sequences that affect metabolic parameters in vivo. The results with MFA2 mRNA show that good predictions of mRNA intracellular secondary structure, especially structure involving local interactions, can be made on the basis of in vitro reactivity. Long-range base-pairing interactions may also be predicted depending on the stability of the stem structures.
Acknowledgments
This research was sponsored by the Laboratory Directed Research and Development Program of the Oak Ridge National Laboratory, managed by Lockheed Martin Energy Research Corporation for the U.S. Department of Energy under Contract DE-AC05–96OR22464.
ABBREVIATIONS
- UTR
untranslated region
- DMS
dimethyl sulfate
- CMC
1-cyclohexyl-3-(2-morpholinoethyl)carbodiimide metho-p-toluenesulfonate
References
- 1.Puglisi E V, Puglisi J D. In: mRNA Metabolism and Post-Transcriptional Gene Regulation. Harford J B, Morris E R, editors. New York: Wiley–Liss; 1997. pp. 1–23. [Google Scholar]
- 2.Morris D R. In: mRNA Metabolism and Post-Transcriptional Gene Regulation. Harford J B, Morris E R, editors. New York: Wiley–Liss; 1997. pp. 165–180. [Google Scholar]
- 3.Pantopoulos K, Johansson H E, Hentz M W. Prog Nucleic Acid Res Mol Biol. 1994;48:181–238. doi: 10.1016/S0079-6603(08)60856-9. [DOI] [PMC free article] [PubMed] [Google Scholar]
- 4.Kozak M. Biochimie. 1994;76:815–821. doi: 10.1016/0300-9084(94)90182-1. [DOI] [PMC free article] [PubMed] [Google Scholar]
- 5.Schoenberg D R, Chernokalskaya E. In: mRNA Metabolism and Post- Transcriptional Gene Regulation. Harford J B, Morris E R, editors. New York: Wiley–Liss; 1997. pp. 217–240. [Google Scholar]
- 6.Sagliocco F A, Zhu D, Vega Laso M R, McCarthy J E G, Tuite M F, Brown A J P. J Biol Chem. 1994;269:18630–18637. [PubMed] [Google Scholar]
- 7.Yang L, Steussy C N, Fuhrer D K, Hamilton J, Yang Y-C. Mol Cell Biol. 1996;16:3300–3307. doi: 10.1128/mcb.16.7.3300. [DOI] [PMC free article] [PubMed] [Google Scholar]
- 8.Jackson R J, Standart N. Cell. 1990;62:15–24. doi: 10.1016/0092-8674(90)90235-7. [DOI] [PubMed] [Google Scholar]
- 9.Holmberg L, Melander Y, Nygard O. Nucleic Acids Res. 1994;22:1374–1382. doi: 10.1093/nar/22.8.1374. [DOI] [PMC free article] [PubMed] [Google Scholar]
- 10.Mereau A, Fournier R, Gregoire A, Mougin A, Fabrizio P, Luhrmann R, Branlant C. J Mol Biol. 1997;273:552–571. doi: 10.1006/jmbi.1997.1320. [DOI] [PubMed] [Google Scholar]
- 11.Charpentier B, Rosbash M. RNA. 1996;2:509–522. [PMC free article] [PubMed] [Google Scholar]
- 12.Pikielny C W, Rosbash M. Cell. 1995;41:119–126. doi: 10.1016/0092-8674(85)90066-2. [DOI] [PubMed] [Google Scholar]
- 13.Michaelis S, Herskowitz I. Mol Cell Biol. 1989;8:1309–1318. doi: 10.1128/mcb.8.3.1309. [DOI] [PMC free article] [PubMed] [Google Scholar]
- 14.Weiner M P, Costa G L, Schoettlin W, Cline J, Mathur E, Bauer J C. Gene. 1994;151:119–123. doi: 10.1016/0378-1119(94)90641-6. [DOI] [PubMed] [Google Scholar]
- 15.Palmer E L, Gewiess A, Harp J M, York M H, Bunick G J. Anal Biochem. 1995;231:109–114. doi: 10.1006/abio.1995.1509. [DOI] [PubMed] [Google Scholar]
- 16.Gehrke L. Gene Anal Tech. 1986;3:45–52. [Google Scholar]
- 17.Thisted T, Sorensen N S, Gerdes K. J Mol Biol. 1995;247:859–873. doi: 10.1006/jmbi.1995.0186. [DOI] [PubMed] [Google Scholar]
- 18.Thisted T, Nielsen A K, Gerdes K. EMBO J. 1994;13:1950–1959. doi: 10.1002/j.1460-2075.1994.tb06464.x. [DOI] [PMC free article] [PubMed] [Google Scholar]
- 19.Ehresmann C, Baudin F, Mougel M, Romby P, Ebel J P, Ehresmann B. Nucleic Acids Res. 1987;15:9109–9128. doi: 10.1093/nar/15.22.9109. [DOI] [PMC free article] [PubMed] [Google Scholar]
- 20.Maniatis T, Fritsch E F, Sambrook J. Molecular Cloning: A Laboratory Manual. 2nd Ed. Plainview, NY: Cold Spring Harbor Lab. Press; 1989. [Google Scholar]
- 21.Decker C J, Parker R. Genes Dev. 1993;7:1632–1643. doi: 10.1101/gad.7.8.1632. [DOI] [PubMed] [Google Scholar]
- 22.Zuker M. Science. 1989;244:48–52. doi: 10.1126/science.2468181. [DOI] [PubMed] [Google Scholar]
- 23.Lowell J E, Rudner D Z, Sachs A B. Genes Dev. 1992;6:2088–2099. doi: 10.1101/gad.6.11.2088. [DOI] [PubMed] [Google Scholar]
- 24.Shelness G S, Williams D L. J Biol Chem. 1985;260:8637–8646. [PubMed] [Google Scholar]
- 25.Matveeva O, Felden B, Audlin S, Gesteland R F, Atkins J F. Nucleic Acids Res. 1997;25:5010–5016. doi: 10.1093/nar/25.24.5010. [DOI] [PMC free article] [PubMed] [Google Scholar]
- 26.Tarun S Z, Jr, Sachs A B. EMBO J. 1996;15:7168–7177. [PMC free article] [PubMed] [Google Scholar]


