

Abstract
Scanner noise during functional magnetic resonance imaging (fMRI) may interfere with brain function and change blood oxygenation level dependent (BOLD) signals, a problem that generally worsens at the higher field strengths. Therefore, we studied the effect of increased acoustic noise on fMRI during verbal working memory (WM) processing. The sound pressure level of scanner noise was increased by 12 dBA from “Quiet” to “Loud” echo planar imaging (EPI) scans by utilizing resonant vibration modes of the gradient coil. A WM paradigm with graded levels of task difficulty was used to further access WM-load. Increased scanner noise produced increased BOLD responses (percent signal change) bilaterally in the cerebellum, inferior (IFG), medial (medFG), and superior (SFG) frontal, fusiform (FusG), and the lingual (LG) gyri, and decreased BOLD responses bilaterally in the anterior cingulate gyrus (ACG) and the putamen. This finding suggests greater recruitment of attention resources in these brain regions, probably to compensate for interference due to louder scanner noise. Increased working memory load increased the BOLD signals in IFG and the cerebellum, but decreased the BOLD signals in the putamen and the LG. These findings also support the idea that brain function requires additional attention resources under noisier conditions. Load- and acoustic noise-related changes in BOLD responses correlated negatively in the WM network. This study demonstrates that MR noise affects brain activation pattern. Future comparisons between studies performed under different acoustic conditions (due to differing magnetic field strengths, pulse sequences, or scanner manufacturers) might require knowledge of the sound pressure level of acoustic noise during fMRI.
Introduction
Functional magnetic resonance imaging (fMRI) is a powerful neuroimaging method for studying the neural correlates of cognitive tasks. However, the high sound pressure levels (spl) of acoustic noise (AN) during fMRI (McJury and Shellock, 2000, Price, et al., 2001) is a concern because it may interfere with cognitive tasks and change brain activation. Furthermore, the use of higher field strengths and stronger gradients in fMRI leads to substantially more intense scanner noise (Moelker and Pattynama, 2003, Price, et al., 2001). Earplugs and/or earmuffs are used in fMRI studies to minimize subjects' discomfort due to scanner noise (Ravicz and Melcher, 2001); however, the effect of scanner noise on brain activation is largely unknown.
Scanner noise is especially problematic in the study of the auditory pathway and language (Shah, et al., 1999) because it produces activation in brain regions involved in auditory processing (Bandettini, et al., 1998, Bilecen, et al., 1998, Hall, et al., 2000) and interferes with the stimulus presentation (Amaro, et al., 2002, Moelker and Pattynama, 2003). Consequently, several methods have been developed to minimize the effect of scanner noise on fMRI studies of auditory cortices (de Zwart, et al., 2002, Di Salle, et al., 2001, Jakob, et al., 1998, MacSweeney, et al., 2000, Yang, et al., 2000).
The effect of scanner noise on fMRI activation in non-auditory brain regions is not well understood, and the empirical data available are limited and sometimes contradictory. Using visual and motor stimulation, Cho et al. found that increased AN increased motor activation and reduced visual activation (Cho, et al., 1998), while Elliot et al. did not find activation changes in these regions (Elliott, et al., 1999). Therefore, more experiments are necessary to characterize the effects of MR-related acoustic noise on sensorimotor cortices (Moelker and Pattynama, 2003).
During cognitive tasks, fixation and attention to stimuli are further complicated by scanner noise and might be different for patients and control subjects. Therefore the confounding effects of fMRI-AN are also a concern for clinical fMRI studies (Moelker and Pattynama, 2003). In addition, positron emission tomography (PET) studies of visual mental imagery demonstrated that scanner noise increases the regional cerebral blood flow (rCBF) in the anterior cingulate cortex and in the Wernicke's area (Mazard, et al., 2002). However, the effect of scanner noise on cognitive tasks has not been studied by fMRI.
Previous fMRI studies of primary sensory and motor cortex activation produced by scanner noise used the scanner itself as a source of noise (Bandettini, et al., 1998, Cho, et al., 1998, Elliott, et al., 1999). Unfortunately, these studies did not report the spl-difference between “Loud” and “Quiet” scans, and used different stimulation methods, field strengths, and head-only gradient coils, which do not allow a direct comparison of these contradictory results. Furthermore, these studies were conducted on small sample sizes (< 10) and no group analyses were performed. Therefore, the results cannot be easily compared and extended to the general population.
Recently we demonstrated that resonant vibration modes of the gradient coil assembly can produce a four-fold (12 dBA) increase in scanner noise during EPI (Tomasi and Ernst, 2003). Therefore, the goal of the present study was to determine the effect of the scanner noise on brain activation for verbal working memory (WM) tasks, by using the mechanical resonance of our gradient coil. The resonant vibration modes of the gradient system provided a 12dBA spl-difference between “Loud” and “Quiet” fMRI scans, and a set of WM-tasks (n-back tasks) with graded task difficulty was used to further access the effect of scanner noise on WM-load activation. To increase statistical power, this study involved a high field MRI scanner (4 Tesla) and a large sample of 30 healthy volunteers. A voxel-wise repeated measures analysis of variance (ANOVA) model was used to allow statistical inferences about the general population.
Materials and Methods
Modulation of EPI-scanner noise
The frequencies of vibrational resonances of the gradient coil set were measured using a piezoelectric transducer (PZT; Radio Shack, 273−073A; glued on the inner wall of the gradient coil at z = 34 cm), and 500μsec-rectangular z-gradient pulses (22 mT/m). The output voltage of the PTZ was recorded with a digital oscilloscope (LECROY 9354TM, 50 msec trace, 500 kHz sampling rate, 16 bit dynamic range). The frequencies of vibrational resonances of the z-gradient coil were determined after Fourier transformation of the PZT signal. A calibrated digital sound lever meter EXTECH 407727 (Waltham, MA) was used to measure the spl of EPI sequences in dBA at the entrance of the scanner (Tomasi and Ernst, 2003). Two single-shot gradient-echo EPI sequences with slightly different bandwidths were optimized to operate “on” (“Loud”) and “off” (“Quiet”) the acoustic resonance in order to achieve a 12 dBA spl-difference between “Quiet” and “Loud” EPI scans (Fig 1). A unidirectional dynamic microphone (dynamic range: 80−16000 Hz; Radio Shack, cat # 33−3009) was used to record sound waves at the center of the scanner room (bandwidth = 50 kHz) to evaluate the sound quality of the scanner noise. A 15cm diameter spherical water phantom was used to measure the signal-to-noise ratio (SNR) of the EPI images, which was 142±3, and 157±4, for the “Quiet” and “Loud” protocols, respectively.
Fig 1.

Sound pressure level of acoustic noise during echo planar imaging in our 4 Tesla MRI scanner as a function of the EPI-readout frequency. A 12-dBA difference in spl was achieved by a small adjustment of the readout frequency. The “Quiet” protocol operated “off-resonance” (light-gray; 1.16 kHz; 92 dBA) while the “Loud” protocol operated “on-resonance” (black; 1.22 kHz; 104 dBA).
Subjects
Thirty healthy, non-smoking, right-handed volunteers (15 men and 15 women, age 31±9 years, education: 16±2 years) with normal vision and hearing (accessed by pure-tone audiometry in a sound-proof room) participated in the study. Prior to the study, each subject signed a written consent, approved by the Institutional Review Board at Brookhaven National Laboratory. Subjects were screened carefully with a detailed medical history, physical and neurological examination, blood and urine screening tests, to ensure they fulfilled all study criteria. Inclusion criteria were: age 18 years or older; English as their first language; healthy and on no medications (except for vitamins); and ability to provide consent and willing to participate in the study. Exclusion criteria were: history of head injury with loss of consciousness > 30 minutes; current or past drug abuse or dependence (including nicotine and alcohol) or positive urine toxicology (for cocaine, amphetamines, marijuana, benzodiazepines, and opiates); any past or current medical or neuropsychiatric illnesses; significant abnormalities on screening blood tests, including a complete blood count, a chemistry panel, thyroid function tests, a positive HIV test or Hepatitis tests; pregnancy (assessed by a urine test) or breast-feeding for female subjects; any contraindications for MRI (e.g. metallic implants or claustrophobia).
Working memory paradigm
Three sequential letter tasks were used to assess working memory. Alphabetical letters were presented randomly at a rate of one per second. The subjects were instructed to press a response button as fast as possible whenever they saw a letter (0-back task), or when the current letter was the same as the one before (1-back task) or two before (2-back task) (Chang, et al., 2001, Speck, et al., 2000). During each 30-second task period, five targets were presented at random time points. During the rest period (30 seconds), nonsense characters were randomly displayed at the same size, rate, and luminance, and the subjects were instructed not to respond but to maintain fixation at the center cross. The stimuli were presented to the subjects on MRI-compatible LCD goggles connected to a personal computer. All response button events during stimulation were recorded to determine task performance.
Data acquisition
Directly prior to scanning, subjects performed a brief training session (∼10 minutes) of a shortened version of the paradigm outside of the scanner to ensure that they understood and were able to perform the tasks. Subjects then underwent MRI in a 4 T whole-body Varian/Siemens MRI scanner, equipped with a self-shielded whole-body SONATA gradient set. The BOLD responses were measured as a function of time using a T2*-weighted single-shot gradient-echo EPI sequence with ramp-sampling (TE/TR=25/3000 ms, 4 mm slice thickness, 1 mm gap, typically 33 coronal slices, 48×64 matrix size, 4.1 × 3.1 mm in-plane resolution, 90°-flip angle, 84 time points, bandwidth: 200.00 kHz for “Quiet”, and 219.78 kHz for “Loud” scans; readout gradient frequency: 1.16 kHz for “Quiet”, and 1.22 kHz for “Loud”) covering the whole brain. The entire WM-battery was performed twice under two different spl: 92 dBA for “Quiet” and 104 dBA for “Loud”. Half the studies started with the “Quiet” session; the remaining studies started with the “Loud” session to control for practice effects (Tomasi, et al., 2004). Padding was used to minimize motion. The spl at the subjects' ears was reduced through the use of earplugs (28dBA; Aearo Ear TaperFit 2; Aearo Company) and headphones (30dBA; Commander XG MRI Audio System, Resonance Technology inc.). Task performance and subject motion were determined immediately after each fMRI trial, to assure performance accuracy better than 80%, and motion < 1-mm-translations and < 1°-rotations (Caparelli, et al., 2003).
A T1-weighted 3D-MDEFT sequence (Lee, et al., 1995) (TE/TR = 7/15ms, 0.94 × 0.94 × 3 mm spatial resolution, axial orientation, 256 readout and 192×48 phase-encoding steps, 8 minutes scan time) and a modified T2-weigthed Hyperecho sequence (Hennig and Scheffler, 2001) (TE/TR = 42/10000 ms, echo train length = 16, 256×256 matrix size, 30 coronal slices, 0.86 × 0.86 mm in-plane resolution, 5 mm thickness, 1 mm gap, 2 min scan time) were used to obtain anatomical images.
Data processing
A phase correction method was used to minimize ghost artifacts in the EPI time series (Buonocore and Gao, 1997). The first four volumes in the time series were discarded. Subsequent analyses were performed with the statistical parametric mapping package SPM99 (Welcome Department of Cognitive Neurology, London UK). A six-parameter rigid body transformation was used for image realignment, to correct for head motion. Only scans with head motion less than 1-mm translations and 1°-rotations were included in the analysis. The realigned datasets were normalized to the Talairach frame with a 12-parameters affine transformation (Ashburner, et al., 1997), using a voxel size of 3×3×3 mm3, and an 8-mm full-width-half-maximum Gaussian kernel to smooth the data. A general linear model (Friston, et al., 1995), and a box-car design convolved with a canonical hemodynamic response function (HRF) were used to calculate the activation maps for each trial. The time series were band-pass filtered with the HRF as low pass filter and a high-pass filter (cut-off frequency: 1/126Hz).
Statistical analyses
A voxel-by-voxel statistical analysis was applied to the parameter estimates for each trial, to identify significantly activated brain areas. BOLD-responses for each trial and subject were included in a voxel-by-voxel repeated measures ANOVA model with six conditions (Quiet: 0-back 1-back, 2-back; Loud: 0-back, 1-back, and 2-back), using a mask of voxels that conjunctively activated for 1- and 2-back tasks (i.e. the working memory network) during “Loud” as well as “Quiet” scans. Clusters with at least 15 voxels (400 mm3) and p < 0.05 (corrected for multiple comparisons) were considered significant in the group analysis (Friston, et al., 1994), using a voxel-level threshold (uncorrected) of p = 0.05.
BOLD activation maps of the less demanding task (0-back) were used to assess potential spurious “Loud” – “Quiet” differential activation as a result of differences in acquisition bandwidths. Therefore, random-effects analyses of “Loud” – “Quiet” differential contrasts were conducted for the 0-back task across subjects, using the repeated ANOVA model described above.
Small volume corrections (Worsley, et al., 1996) (6 mm spherical radius) were conducted to determine the statistical significance of BOLD responses in small brain structures, such as the putamen.
Region-of-interest (ROI) analysis
Functional ROIs with a volume of 729 mm3 (cubic, 27 voxels) were defined at the cluster centers of brain activation to extract the average BOLD signal from these regions. A repeated measures ANOVA was conducted for each ROI to validate the voxel-by-voxel statistical analyses described above. Additional linear regression analyses of load-related changes of BOLD-signals (from 1-back to 2-back) vs. acoustic noise-related changes of BOLD-signals (from “Quiet” to “Loud” scans) were performed to determine any potential relation between these two effects at each ROI. Statistical significance for ROI analyses was defined as p = 0.05 (uncorrected).
Results
Scanner noise
The power spectra plotted in Fig 2 show that the acoustic noise produced by the “Quiet” and “Loud” protocols have very similar frequency distributions. The fundamental frequency was 1221 Hz for both protocols. The higher harmonics were at 2426 (2426), 3501 (3662), 4650 (4882), and 5813 (6069) Hz, and the sub-harmonics were at 420 (396), and 748 (744) Hz for the “Quiet” (“Loud”) protocols.
Fig 2.

Power spectra of acoustic noise during EPI as a function of frequency. The fundamental sound wave and the first harmonic correspond to the resonant vibration mode (1220 Hz) of the gradient coil for both “loud” and “quiet” protocols. The frequencies of higher harmonics (N > 3) can be calculated as a function of the frequency of the readout gradient, f0 (1220 Hz for “Loud”, 1160 Hz for “Quiet”), as fN = N f0.
Performance and reaction times
The average values of task performance and reaction time (RT) during fMRI are presented in Fig 3. The subjects were able to perform the tasks with high performance accuracy (> 90%). Performance accuracy was significantly lower for 2-back compared to 0- and 1-back (p-value < 0.0001), but no difference was observed between the 0-back, and 1-back tasks, and between “Loud” and “Quiet” scans, for all three tasks. RT were longer for 2-back than for 1-back (p < 0.0001) task, and for the 1-back than for the 0-back task. However, increased acoustic noise did not affect RT on any task.
Fig 3.

Performance accuracy (top row) and reaction times (bottom row) for “Loud” (black) and “Quiet” (light-gray) scans, as a function of the tasks difficulty (WM-load).
Brain activation
The 1- and 2-back WM-tasks conjunctively activated a bilateral network (Table 1, and Fig 4) that comprises the prefrontal (PFC) [inferior (IFG; BAs: 13, 44 and 47), middle (MFG; BA: 6, 9, and 46), superior (SFG; BAs: 8, and 10), and medial (medFG; BA: 8) frontal gyri, and anterior cingulate (ACG) gyri], parietal [inferior (IPL; BA: 7), and superior (SPL; BA: 7)] lobes, occipital [cuneus (BA: 17), and the inferior occipital (IOG; BA: 19), and lingual (LG; BA: 18)] gyri, temporal cortices [FusG (BA: 37)], as well as subcortical regions (thalamus, putamen), and the cerebellum. This activation pattern is in agreement with our prior measurements performed on 1.5 Tesla (Chang, et al., 2001) and is remarkably bilateral.
Table 1.
Location of major areas of brain activation in the Talairach frame of reference, and statistical significance of BOLD responses in these regions. Sample size: Thirty healthy subjects. Random-effects analyses. AN: acoustic noise; WML: working memory load; 0bk, 1bk, and 2bk: 0-, 1- and 2-back tasks; Q: “Quiet”; L: “Loud”; IFG: inferior frontal gyrus; MFG: middle frontal gyrus; FusG: fusiform gyrus; IPL: inferior parietal lobe; SPL: superior parietal lobe; IOG: inferior occipital gyrus; ACG: anterior cinculate gyrus BA: Brodmann area.
| Brain Region | Side | Coordinates [mm] | Quiet | Loud T-scores | AN | WML | WML & AN | WML > AN | AN > WML | ||||||||
|---|---|---|---|---|---|---|---|---|---|---|---|---|---|---|---|---|---|
| x | y | Z | 0bk | 1bk | 2bk | 0bk | 1bk | 2bk | L>Q | Q>L | Q | L | |||||
| IFG | L | −30 | 12 | −12 | NS | NS | 3.1 | NS | NS | NS | NS | 2.6 | NS | NS | NS | NS | NS |
| (BA13) | R | 30 | 12 | −12 | 2.1 | NS | 3.4 | NS | NS | NS | NS | 3.6 | NS | NS | NS | NS | NS |
| IFG | L | −33 | 18 | 0 | 3.3 | 6.8 | 12.9 | 4.5 | 6.8 | 10.3 | NS | NS | 4.8 | 2.4 | 2.5 | 4.3 | NS |
| (BA47) | R | 33 | 18 | −3 | 3.2 | 7.5 | 11.8 | 3.7 | 7.6 | 11.6 | NS | NS | 3.9 | 2.8 | 2.9 | 3.0 | NS |
| IFG | L | −48 | 15 | 12 | NS | 4.0 | 7.2 | NS | 6.3 | 8.0 | 3.0 | NS | 2.4 | NS | 2.8 | NS | NS |
| (BA44) | R | 48 | 15 | 12 | NS | 5.4 | 11.0 | NS | 8.6 | 13.2 | 2.7 | NS | 4.0 | 3.2 | 5.5 | NS | NS |
| SFG | L | −33 | 51 | 6 | 2.0 | 4.6 | 10.8 | 2.0 | 6.2 | 9.8 | NS | NS | 4.4 | 2.5 | 3.6 | 3.3 | NS |
| (BA10) | R | 30 | 48 | 12 | 2.0 | 6.5 | 11.4 | 2.2 | 6.4 | 11.3 | NS | NS | 3.5 | 3.5 | 3.5 | 3.6 | NS |
| SFG (BA8) | C | 0 | 18 | 54 | NS | 3.3 | 9.4 | 2.8 | 7.2 | 12.7 | 2.7 | NS | 4.3 | 3.9 | 6.7 | NS | NS |
| MFG | L | −42 | 30 | 24 | NS | 2.7 | 6.8 | NS | 4.1 | 8.3 | NS | NS | 2.9 | 3.0 | 4.0 | 2.0 | NS |
| (BA46) | R | 42 | 30 | 24 | NS | 5.8 | 10.1 | NS | 6.2 | 12.1 | NS | NS | 3.0 | 4.2 | 4.4 | 2.8 | NS |
| MFG | L | −42 | 3 | 39 | NS | 9.7 | 14.3 | NS | 10.4 | 14.1 | NS | NS | 3.2 | 2.6 | 3.1 | 2.8 | NS |
| (BA6) | R | 45 | 6 | 36 | NS | 8.4 | 11.5 | NS | 8.7 | 11.4 | NS | NS | 2.2 | 2.0 | 2.2 | 2.0 | NS |
| L | −27 | 3 | 45 | NS | 5.9 | 13.2 | NS | 6.5 | 14.7 | NS | NS | 5.2 | 5.9 | 6.3 | 4.8 | NS | |
| R | 33 | 6 | 48 | NS | 7.4 | 12.8 | NS | 7.4 | 11.2 | NS | NS | 3.9 | 2.7 | 2.7 | 3.8 | NS | |
| MFG | L | −39 | 9 | 24 | NS | 7.2 | 14.0 | NS | 10.0 | 15.4 | NS | NS | 4.8 | 3.8 | 5.8 | 2.8 | NS |
| (BA9) | R | 42 | 12 | 21 | NS | 8.3 | 13.7 | NS | 10.5 | 15.1 | NS | NS | 3.8 | 3.3 | 4.8 | 2.7 | NS |
| medFG | C | 6 | 18 | 45 | 2.7 | 9.4 | 15.1 | 4.3 | 10.2 | 15.7 | NS | NS | 4.0 | 3.7 | 5.4 | 3.5 | NS |
| (BA8) | |||||||||||||||||
| ACG | L | −21 | 45 | 12 | NS | 3.2 | 4.5 | NS | NS | NS | NS | 3.9 | NS | NS | NS | 2.7 | NS |
| (BA 32) | R | 21 | 39 | 12 | NS | 2.0 | 3.4 | NS | NS | NS | NS | 2.4 | NS | NS | NS | 2.3 | NS |
| Putamen | L | −24 | 15 | 6 | NS | 4.4 | 2.8 | NS | NS | NS | NS | 4.9 | NS | NS | NS | 2.0 | NS |
| R | 24 | 15 | 6 | NS | 2.9 | 2.0 | NS | NS | NS | NS | 2.0 | −3.5 | NS | NS | NS | NS | |
| FusG | L | −39 | −60 | −12 | NS | 8.4 | 11.3 | NS | 10.7 | 12.4 | NS | NS | 2.0 | NS | 2.8 | NS | NS |
| (BA37) | R | 39 | −60 | −12 | NS | 3.4 | 5.5 | NS | 6.8 | 7.0 | 4.5 | NS | NS | NS | 2.6 | NS | NS |
| IPL | L | −27 | −45 | 45 | NS | 9.0 | 16.7 | NS | 10.4 | 15.7 | NS | NS | 5.4 | 3.8 | 4.7 | 4.5 | NS |
| (BA7) | R | 27 | −45 | 45 | NS | 2.0 | 5.5 | NS | 4.3 | 5.0 | 2.6 | NS | 2.4 | NS | 2.1 | NS | NS |
| SPL | L | −30 | −57 | 51 | 2.0 | 2.7 | 7.9 | NS | 4.9 | 9.3 | NS | NS | 3.7 | 3.1 | 4.7 | 2.1 | NS |
| (BA7) | R | 30 | −57 | 51 | 2.0 | 9.2 | 15.7 | NS | 10.0 | 13.9 | NS | NS | 4.6 | 2.8 | 3.3 | 4.0 | NS |
| IOG | L | −36 | −81 | −6 | NS | NS | NS | NS | NS | NS | NS | NS | NS | NS | NS | NS | NS |
| (BA19) | R | 36 | −81 | −6 | NS | NS | 2.7 | NS | 4.6 | 5.2 | NS | NS | NS | NS | 2.5 | NS | NS |
| LG | L | −27 | −78 | −3 | NS | 4.8 | 2.5 | NS | 7.8 | 3.9 | 2.2 | NS | −2.8 | NS | NS | NS | 3.8 |
| (BA18) | R | 27 | −78 | −3 | 2.1 | 2.8 | NS | NS | 3.7 | 2.3 | NS | NS | NS | NS | NS | NS | 2.0 |
| C | −3 | −72 | −6 | NS | 4.8 | 3.7 | 2.6 | 8.1 | 7.6 | 3.6 | NS | NS | NS | 2.0 | NS | 3.1 | |
| Cuneus | C | 6 | −81 | 12 | NS | 2.5 | NS | NS | 4.3 | 2.0 | 2.6 | NS | NS | NS | NS | NS | 4.2 |
| (BA17) | |||||||||||||||||
| Thalamus | L | −9 | −18 | 6 | 3.6 | 8.7 | 7.9 | 4.7 | 8.4 | 9.0 | NS | NS | NS | NS | NS | NS | NS |
| R | 9 | −18 | 6 | 2.3 | 8.4 | 7.7 | 3.2 | 7.2 | 8.0 | NS | NS | NS | NS | NS | NS | NS | |
| Cerebellum | L | −12 | −69 | −21 | NS | 6.0 | 7.3 | 2.2 | 8.8 | 11.5 | 3.5 | NS | NS | NS | 3.8 | NS | NS |
| R | 12 | −69 | −21 | 2.0 | 8.1 | 10.1 | 4.1 | 10.3 | 14.0 | 3.1 | NS | NS | 2.6 | 4.2 | NS | NS | |
| C | −9 | −81 | −24 | 2.4 | 2.6 | 5.4 | NS | 6.0 | 9.4 | 3.7 | NS | 2.0 | 2.4 | 4.8 | NS | NS | |
Fig 4.
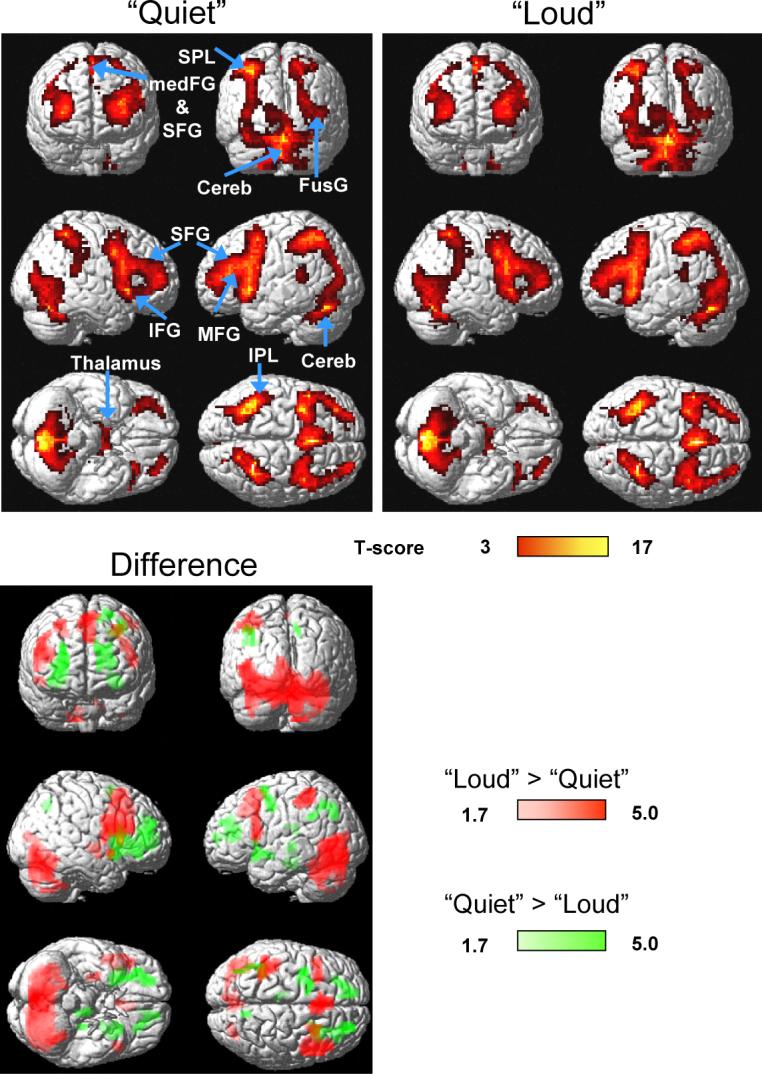
Top: Statistical parametric maps of BOLD signals during working memory (1-back + 2-back) for “Quiet” (left panel) and “Loud” (right panel) scans. Bottom: Statistical map of differential BOLD signals between “Loud” and “Quiet” scans. Sample size: Thirty healthy subjects, random-effects analyses (repeated measures ANOVA). Color bars show the T-score windows. IPL: inferior parietal lobe; SPL: superior parietal lobe; IFG: inferior frontal gyrus; MFG: middle frontal gyrus; medFG: medial frontal gyrus; SFG: superior frontal gyrus; Cereb: cerebellum; FusG: fusiform gyrus.
Compared to “Quiet” scans, “Loud” scans produced larger BOLD signals in the FusG, LG, and the cerebellum (pcorrected < 0.0005; cluster level corrected for multiple comparisons), SFG and medFG (BA 8; pcorrected = 0.02), and the IFG (BA 44; pcorrected = 0.01) during WM tasks (1-back and 2-back combined; Fig. 4 red areas). Conversely, increased acoustic noise decreased brain activation in the putamen and the ACG (pcorrected = 0.014) (Table 1 and Fig. 4). As an example, Fig 5 plots the time courses of the mean BOLD signals in the right FusG (27 voxels cubic ROI, averaged across all 30 subjects) for the 1-back task showing that BOLD responses for “Loud” scans were significantly larger than those for “Quiet” scans, and that their difference was correlated with the stimulus in these brain regions (p < 0.0001).
Fig 5.

Average BOLD responses across the 30 subjects exemplifying the time courses of the fMRI signals in a 27-voxels (729 mm3) cubic ROI in the fusiform gyrus (Table 1) for: [bottom panel] “Loud” (black) and “Quiet” (light-gray) scans, and [upper panel] their difference. White and light-gray periods indicate the task and control blocks.
Increased WM-load (task difficulty) produced increased bilateral activation in all PFC regions (except the ACG), the IPL, SPL, and the cerebellum (pcorrected < 0.0005), as well as the thalamus (pcorrected = 0.014). Conversely, higher WM-load produced decreased bilateral activation in the LG (pcorrected = 0.008) and the putamen (pcorrected = 0.03 with small volume correction). Increased acoustic noise, however, did not change WM-load effects.
The statistical parametric maps for the acoustic noise effect (AN: “Loud” – “Quiet”) and the WM-load effect (“2-back” – “1-back”) overlap in the cerebellum (pcorrected = 0.002) and the IFG (BA: 44; pcorrected = 0.05). Several other brain regions (SPL, IFG47, SFG10, MFG46, MFG6, MFG9, and medFG8; see Table 1) exhibited WM-load effects but no AN-effects. Conversely, the cuneus showed increased activation during louder fMRI, but no WM-load effects. The LG showed increased activation during louder fMRI and a negative WM-load effect, while the IFG (BA13) showed decreased activation during louder scans and no WM-load effects.
The simple reaction task (i.e. 0-back task) activated the IPL, IFG, the thalamus, and the cerebellum (pcorrected < 0.0005; see Table 1). However, the SPL did not affect brain activation for the 0-back task.
ROI results
Figure 6 summarizes the ROI analyses of BOLD signals. Consistent with the SPM analysis, brain activation was larger for “Loud” scans than for “Quiet” scans in the IFG (BA: 44), SFG (BA: 8), FusG, LG, and cerebellum, but lower in the IFG (BA: 13), ACG, and putamen (see Fig 5 for statistical significance).
Fig 6.

BOLD signals at specific ROIs (Table 1) for “Loud” and “Quiet” scans. The arrows indicate a significant (p < 0.05) effect of scanner noise and the labels the p-values. Sample size: Thirty healthy subjects. 27-voxels (729 mm3) cubic ROIs.
Figure 7 plots differential “2-back” – “1-back” BOLD responses for “Loud” scans against the differential “Loud” – “Quiet” BOLD responses for the “1-back” task for several ROIs in the network. Across subjects, BOLD signal changes due to load- and AN-effects correlated negatively in all regions within the WM network (p < 0.01).
Fig 7.

Plots of differential “Loud” - “Quiet” against differential “2-back” - “1-back” BOLD amplitudes for each subject (full circles) in various ROIs, exemplifying the negative correlations between the effect of scanner noise and task difficulty in the brain. R: correlation factor; α: slope; IFG: inferior; MFG: middle; medFG: medial; and SFG: superior frontal gyri; FusG: fusiform gyrus; IPL: inferior; and SPL: superior parietal lobes; Cereb: cerebellum.
Gender Effects
Brain activation was larger for men than women in the right DLPFC (MFG, SFG, and medFG), right SPL, and cerebellum (pcorrected < 0.0005). Conversely, women activated more than men the left DPFC (IFG, MFG, and SFG), and the left posterior parietal cortex (precuneus, BA: 19) (pcorrected < 0.0005), in agreement with our previous studies on the effect of gender on brain activation during WM tasks. (Speck, et al., 2000) The differential “Loud” – “Quiet” activation was larger in males than in females in left MFG (pcorrected = 0.041), the LG (pcorrected = 0.018), and the cerebellum (pcorrected < 0.0005). The differential “Loud” – “Quiet” activation was larger in females than in males in the right IFG (pcorrected < 0.026).
Discussion
This is the first fMRI study on the effect of scanner noise on brain activation during cognitive tasks. The major finding of the study is that acoustic noise affected brain activation during working memory tasks. Previous studies used sensory-motor tasks (Bandettini, et al., 1998, Bilecen, et al., 1998, Cho, et al., 1998, Elliott, et al., 1999), and found that scanner noise increases activation in auditory cortices, but its effects on visual and motor cortices is still controversial (Cho, et al., 1998, Elliott, et al., 1999).
In fMRI studies, it is desirable to use MR sequences that are as silent as possible, in order to reduce subjects' stress, and minimize potential stress-related activations. However, fMRI protocols are typically very loud, vary from scanner to scanner, and the effect of the scanner noise on brain activation cannot be underestimated. Study designs using different levels of scanner noise can access the quantification of noise-related changes in BOLD responses.
To increase acoustic noise, Cho et al. (Cho, et al., 1998) played back previously recorded scanner noise to the subjects, using sound guides. This approach was not used in the present study because we aimed to achieve a precise and reproducible 12dBA spl-difference between “Loud” and “Quiet” scans for all subjects. In Cho's study, the relative contribution of two sound sources (i.e. sound guides and the scanner) strongly depends on the distance between sound guide and ear canal and earplug-to-ear canal and/or earmuff-to-ear adaptation, which can significantly increase the spl-variability across subjects. In the present study, the earplug-to-ear attenuation may have been variable across subjects, but not across conditions (“Loud” and “Quiet”), assuring an spl-difference of 12dBA between “Loud” and “Quiet” scans for all subjects. On the other hand, Bandettini et al. (Bandettini, et al., 1998), Bilecen et al. (Bilecen, et al., 1998), and Elliot et al. (Elliott, et al., 1999) used additional gradient pulses to enhance scanner noise. This approach also was not used in the present study because we try to maximize the spl-difference between “Loud” and “Quiet” scans. Preliminary studies in our scanner showed that additional readout gradient pulses (1.5s) before radio frequency excitation pulses only produce a 3dBA increase in spl, which was considered insufficient to significantly interfere with cognitive tasks. An alternative approach for changing the spl at subjects ears could have been to let the subjects use earplugs in one of the sessions (⪡quiet⪡), but do not let them do it during the other session (⪡loud⪢); therefore the average spl-difference could have been up to 28 dBA. We did not use this approach because it may increase the variability of the spl-difference across subjects due to the variability in the earplug-to-ear canal attenuation.
The larger BOLD signals in the FusG, SFG, medFG, IFG and the cerebellum for “Loud” scans compared to “Quiet” scans (Figs 4 and 5) suggest increased requirements for attention-network resources during louder scans to compensate for the interference of scanner noise. During WM, the FusG may play an important role as a visual cache (Baddeley, 2003), and the SFG may be involved in general high-level functions (Wager and Smith, 2003), while the medFG, IFG, and the cerebellum could perform general attentional processing required by WM tasks. All of these functions appear to be affected by the louder scans, and thus require additional neural resources during WM.
The reduced BOLD responses in the putamen and the ACG during louder scans suggest minimization of neural processes in task-irrelevant brain to minimize competition and maximize resources for attention processing in noisier conditions. The reduced responses in the ACG and putamen are unlikely the result of “blood stealing” phenomena (local reduction of CBF in less active adjacent brain regions to compensate for CBF-increases in those brain regions more active during louder scans), since these regions are not directly adjacent to other activated brain regions.
The AN-related increase of BOLD signals in the LG is consistent with the fMRI studies on perceptual, cognitive, and affective processing performed at different field strengths (Krasnow, et al., 2003). These studies found significant activation in the LG for experiments performed at 3 Tesla field strength but not those performed at 1.5 Tesla. This discrepancy could have resulted from the increased scanner noise [approximately 6−10 dBA spl-increase, (Price, et al., 2001)] or the higher sensitivity at 3T compared to 1.5T. Increased BOLD signals in the LG during louder scans, but not with increased WM-load, demonstrates that the LG is more specific for general attention processing but less so for WM-load processing.
AN, and WM-load related increases in brain activation in the cerebellum and the IFG (Table 1, Fig 6) suggest increased attentional modulation in these brain regions during louder scans. These areas might have a general role for attention, and commonly activate during verbal and visuospatial WM tasks (LaBar, et al., 1999), as well as visual attention tasks (Chang, et al., 2004). Therefore, fMRI-acoustic noise might lead to an increased requirement for attentional modulation to perform a given task, causing corresponding increases in fMRI-signals. However, the lack of increases in BOLD signals in the FusG and IPL with increased WM load in the setting of louder scanner noise suggests that the capacity in these brain regions might be saturated already with the interference from the louder noise, and that these regions cannot further activate with the additional WM load.
The negative correlations between load- and AN-related changes in BOLD responses (Fig. 7) support the theoretical notion that the working memory network is a limited capacity system (Baddeley, 2003). According to Fig 7, there is a ceiling effect in the BOLD responses; - α ΔBOLD (AN) + ΔBOLD (WM-load) = constant, where the value of the weighting factor α, which is the negative slope of linear fits in Fig. 7, varies across brain regions. The behavioral data during the study demonstrate that the 2-back task is very demanding, and some subjects probably require the use of near-full network capacity (performance accuracy drops from 98% to 92%, and reaction time increases from 540 to 610 ms from 1-back to 2-back). Other fMRI studies using similar WM tasks (Kumari, et al., 2003) have shown a more severe drop in performance accuracy (to approximately 50%) during the even more demanding 3-back WM task. Therefore, when WM-resources are allocated to compensate for decreased efficiency due to increased acoustic noise, the reserve capacity may be exhausted for even more demanding WM-processing (i.e. further increased WM-load).
The different AN-related activation patterns between men and women are consistent with a previous fMRI study on gender differences in brain activation during WM tasks (Speck, et al., 2000). In agreement with our previous study, the present investigation shows that brain activation during WM tasks is greater in the right hemisphere for male, but greater in the left hemisphere for female subjects. In contrast, AN-activation was larger in the opposite hemisphere relative to that observed with WM activation for each sex, i.e. in the left hemisphere for males, and in the right hemisphere for females. These gender-specific differences in noise-related activation during WM tasks further emphasize the importance of careful gender matching on fMRI studies.
Finally, the observed AN-related differences in brain activation are not a consequence of small differences in acquisition bandwidth because there was no difference in brain activation between “Quiet” and “Loud” scans for the less demanding task (0-back task).
In summary, we studied the effect of increased acoustic noise on fMRI activation using a verbal working memory paradigm with graded levels of task difficulty. The study was conducted at high field strength in a large cohort (30) of healthy volunteers. The spl of scanner noise was increased by 12 dBA from “Quiet” to “Loud” EPI scans by taking advantage of the resonant modes of vibration of our gradient coil (Tomasi and Ernst, 2003). Increased scanner noise produced increased BOLD responses bilaterally in temporal (FusG), occipital (LG), and prefrontal (SFG, medFG, IFG) cortices and the cerebellum, and decreased BOLD responses bilaterally in frontal cortices (ACG) and subcortical gray matter regions (putamen). These findings support greater recruitment of neural resources from the attention network to compensate for interference due to increased scanner noise. WM-load dependent increases in BOLD signals correlated negatively with increased scanner noise throughout the WM network, which suggests that the WM network is a limited capacity system. Furthermore, this study demonstrates that MR noise can alter brain activation patterns. Therefore, comparisons of fMRI studies performed at different magnetic field strengths (i.e. > 3 Tesla vs. 1.5 Tesla) or on different systems or with different pulse sequences (e.g. EPI vs. spiral) should measure and control for acoustic noise.
Acknowledgements
We thank K. Leckova and K. Warren for their help in subject recruitment, assessment and coordination. The study was partly supported by the Department of Energy (Office of Biological and Environmental Research), the National Institutes of Health (GCRC 5-MO1-RR-10710), and the National Institute on Drug Abuse (K24 DA16170; K02 DA16991; R03 DA 017070-01).
References
- Amaro EJ, Williams S, Shergill S, Fu C, MacSweeney M, Picchioni M, Brammer M, McGuire P. Acoustic noise and functional magnetic resonance imaging: current strategies and future prospects. J Magn Reson Imaging. 2002;16:497–510. doi: 10.1002/jmri.10186. [DOI] [PubMed] [Google Scholar]
- Ashburner J, Neelin P, Collins DL, Evans AC, Friston KJ. Incorporating prior knowledge into image registration. Neuroimage. 1997;6:344–352. doi: 10.1006/nimg.1997.0299. [DOI] [PubMed] [Google Scholar]
- Baddeley A. Working memory: looking back and looking forward. Nat Rev Neurosci. 2003;4:829–839. doi: 10.1038/nrn1201. [DOI] [PubMed] [Google Scholar]
- Bandettini PA, Jesmanowicz A, Van Kylen J, Birn RM, Hyde JS. Functional MRI of brain activation induced by scanner acoustic noise. Magn Reson Med. 1998;39:410–416. doi: 10.1002/mrm.1910390311. [DOI] [PubMed] [Google Scholar]
- Bilecen D, Radu E, Scheffler K. The MR tomograph as a sound generator: fMRI tool for the investigation of the auditory cortex. Magn Reson Med. 1998;40:934–937. doi: 10.1002/mrm.1910400621. [DOI] [PubMed] [Google Scholar]
- Buonocore MH, Gao L. Ghost artifact reduction for echo plannar imaging using image phase correction. Magn Reson Med. 1997;38:89–100. doi: 10.1002/mrm.1910380114. [DOI] [PubMed] [Google Scholar]
- Caparelli EC, Tomasi D, Arnold S, Chang L, Ernst T. k-Space based summary motion detection for functional magnetic resonance imaging. NeuroImage. 2003;20:1411–1418. doi: 10.1016/S1053-8119(03)00339-2. [DOI] [PubMed] [Google Scholar]
- Chang L, Speck O, Miller E, Braun A, Jovicich J, Koch C, Itti L, Ernst T. Neural Correlates Of Attention And Working Memory Deficits In HIV Patients. Neurology. 2001;57:1001–1007. doi: 10.1212/wnl.57.6.1001. [DOI] [PubMed] [Google Scholar]
- Chang L, Tomasi D, Yakupov R, Lozar C, Arnold S, Caparelli E, Ernst T. Adaptation of the attention network in human immunodeficiency virus brain injury. Ann Neurol. 2004;56:259–272. doi: 10.1002/ana.20190. [DOI] [PubMed] [Google Scholar]
- Cho ZH, Chung SC, Lim DW, Wong EK. Effects of the acoustic noise of the gradient systems on fMRI: A study on auditory, motor, and visual cortices. Magn Reson Med. 1998;39:331–336. doi: 10.1002/mrm.1910390224. [DOI] [PubMed] [Google Scholar]
- de Zwart J, van Gelderen P, Kellman P, Duyn J. Reduction of gradient acoustic noise in MRI using SENSE-EPI. NeuroImage. 2002;16:1151–1155. doi: 10.1006/nimg.2002.1119. [DOI] [PubMed] [Google Scholar]
- Di Salle F, Formisano E, Seifritz E, Linden D, Scheffler K, Saulino C, Tedeschi G, Zanella F, Pepino A, Goebel R, Marciano E. Functional fields in human auditory cortex revealed by time-resolved fMRI without interference of EPI noise. NeuroImage. 2001;13:328–338. doi: 10.1006/nimg.2000.0683. [DOI] [PubMed] [Google Scholar]
- Elliott MR, Bowtell RW, Morris PG. The effect of scanner sound in visual, motor, and auditory functional MRI. Magn Reson Med. 1999;41:1230–1235. doi: 10.1002/(sici)1522-2594(199906)41:6<1230::aid-mrm20>3.0.co;2-1. [DOI] [PubMed] [Google Scholar]
- Friston KJ, Holmes AP, Worsley KJ, Poline JB, Frith CD, Franckowiak RSJ. Statistical parametric maps in functional imaging: a general approach. Hum Brain Map. 1995;2:189–210. [Google Scholar]
- Friston KJ, Worsley KJ, Frackowiak RSJ, Mazziotta JC, Evans AC. Assessing the significance of focal activations using their spatial extent. Human Brain Mapping. 1994;1:214–220. doi: 10.1002/hbm.460010306. [DOI] [PubMed] [Google Scholar]
- Hall D, Summerfield A, Goncalves M, Foster J, Palmer A, Bowtell R. Time-course of the auditory BOLD response to scanner noise. Magn Reson Med. 2000;43:601–606. doi: 10.1002/(sici)1522-2594(200004)43:4<601::aid-mrm16>3.0.co;2-r. [DOI] [PubMed] [Google Scholar]
- Hennig J, Scheffler K. Hyperechoes. Magn Reson Med. 2001;46:6–12. doi: 10.1002/mrm.1153. [DOI] [PubMed] [Google Scholar]
- Jakob P, Schlaug G, Griswold M, Lovblad K, Thomas R, Ives J, Matheson J, Edelman R. Functional burst imaging. Magn Reson Med. 1998;40:614–621. doi: 10.1002/mrm.1910400414. [DOI] [PubMed] [Google Scholar]
- Krasnow B, Tamm L, Greicius M, Yang T, Glover G, Reiss A, Menon V. Comparison of fMRI activation at 3 and 1.5 T during perceptual, cognitive, and affective processing. NeuroImage. 2003;18:813–826. doi: 10.1016/s1053-8119(03)00002-8. [DOI] [PubMed] [Google Scholar]
- Kumari V, Gray J, ffytche D, Mitterschiffthaler M, Das M, Zachariah E, Vythelingum G, Williams S, Simmons A, Sharma T. Cognitive effects of nicotine in humans: an fMRI study. Neuroimage. 2003;19:1002–1013. doi: 10.1016/s1053-8119(03)00110-1. [DOI] [PubMed] [Google Scholar]
- LaBar K, Gitelman D, Parrish T, Mesulam M. Neuroanatomic overlap of working memory and spatial attention networks: a functional MRI comparison within subjects. NeuroImage. 1999;10:695–704. doi: 10.1006/nimg.1999.0503. [DOI] [PubMed] [Google Scholar]
- Lee JH, Garwood M, Menon R, Adriany G, Andersen P, Truwit CL, Ugurbil K. High contrast and fast three-dimensional magnetic resonance imaging at high fields. Magn Reson Med. 1995;34:308–312. doi: 10.1002/mrm.1910340305. [DOI] [PubMed] [Google Scholar]
- MacSweeney M, Amaro E, Calvert G, Campbell R, David A, McGuire P, Williams S, Woll B, Brammer M. Silent speechreading in the absence of scanner noise: an event-related fMRI study. Neuroreport. 2000;11:1729–1733. doi: 10.1097/00001756-200006050-00026. [DOI] [PubMed] [Google Scholar]
- Mazard A, Mazoyer B, Etard O, Tzourio-Mazoyer N, Kosslyn S, Mellet E. Impact of fMRI acoustic noise on the functional anatomy of visual mental imagery. J Cogn Neurosci. 2002;14:172–186. doi: 10.1162/089892902317236821. [DOI] [PubMed] [Google Scholar]
- McJury M, Shellock F. Auditory noise associated with MR procedures: a review. J Magn Reson Imaging. 2000;12:37–45. doi: 10.1002/1522-2586(200007)12:1<37::aid-jmri5>3.0.co;2-i. [DOI] [PubMed] [Google Scholar]
- Moelker A, Pattynama P. Acoustic noise concerns in functional magnetic resonance imaging. Hum Brain Mapp. 2003;20:123–141. doi: 10.1002/hbm.10134. [DOI] [PMC free article] [PubMed] [Google Scholar]
- Price DL, De Wilde JP, Papadaki AM, Curran JS, Kitney RI. Investigation of acoustic noise on 15 MRI scanners from 0.2T to 3T. J Magn Reson Imaging. 2001;13:288–293. doi: 10.1002/1522-2586(200102)13:2<288::aid-jmri1041>3.0.co;2-p. [DOI] [PubMed] [Google Scholar]
- Ravicz M, Melcher J. Isolating the auditory system from acoustic noise during functional magnetic resonance imaging: examination of noise conduction through the ear canal, head, and body. J Acoust Soc Am. 2001;109:216–231. doi: 10.1121/1.1326083. [DOI] [PMC free article] [PubMed] [Google Scholar]
- Shah N, Jancke L, Grosse-Ruyken M, Muller-Gartner H. Influence of acoustic masking noise in fMRI of the auditory cortex during phonetic discrimination. J Magn Reson Imaging. 1999;9:19–25. doi: 10.1002/(sici)1522-2586(199901)9:1<19::aid-jmri3>3.0.co;2-k. [DOI] [PubMed] [Google Scholar]
- Speck O, Ernst T, Braun J, Koch C, Miller E, Chang L. Gender differences in the functional organization of the brain for working memory. NeuroReport. 2000;11:2581–2585. doi: 10.1097/00001756-200008030-00046. [DOI] [PubMed] [Google Scholar]
- Tomasi D, Ernst T. Echo Planar Imaging at 4Tesla with Minimum Acoustic Noise. J Magn Reson Imaging. 2003;18:128–130. doi: 10.1002/jmri.10326. [DOI] [PubMed] [Google Scholar]
- Tomasi D, Ernst T, Caparelli E, Chang L. Practice-induced changes of brain function during visual attention: A parametric fMRI study at 4 Tesla. NeuroImage. 2004;23:1414–1421. doi: 10.1016/j.neuroimage.2004.07.065. [DOI] [PubMed] [Google Scholar]
- Wager T, Smith E. Neuroimaging studies of working memory: A meta-analysis. Cogn Affect Behav Neurosci. 2003;3:255–274. doi: 10.3758/cabn.3.4.255. [DOI] [PubMed] [Google Scholar]
- Worsley K, Marrett S, Neelin P, Vandal A, Friston K, Evans A. A unified statistical approach for determining significant signals in images of cerebral activation. Hum Brain Mapp. 1996;4:58–73. doi: 10.1002/(SICI)1097-0193(1996)4:1<58::AID-HBM4>3.0.CO;2-O. [DOI] [PubMed] [Google Scholar]
- Yang Y, Engelien A, Engelien W, Xu S, Stern E, Silbersweig D. A silent event-related functional MRI technique for brain activation studies without interference of scanner acoustic noise. Magn Reson Med. 2000;43:185–190. doi: 10.1002/(sici)1522-2594(200002)43:2<185::aid-mrm4>3.0.co;2-3. [DOI] [PubMed] [Google Scholar]