Abstract
c-Cbl-associated protein (CAP) is a signaling protein that interacts with both c-Cbl and the insulin receptor that may be involved in the specific insulin-stimulated tyrosine phosphorylation of c-Cbl. The restricted expression of CAP in cells metabolically sensitive to insulin suggests an important potential role in insulin action. The expression of CAP mRNA and proteins are increased in 3T3-L1 adipocytes by the insulin sensitizing thiazolidinedione drugs, which are activators of the peroxisome proliferator-activated receptor γ (PPARγ). The stimulation of CAP expression by PPARγ activators results from increased transcription. This increased expression of CAP was accompanied by a potentiation of insulin-stimulated c-Cbl tyrosine phosphorylation. Administration of the thiazolidinedione troglitazone to Zucker (fa/fa) rats markedly increased the expression of the major CAP isoform in adipose tissue. This effect was sustained for up to 12 weeks of treatment and accompanied the ability of troglitazone to prevent the onset of diabetes and its complications. Thus, CAP is the first PPARγ-sensitive gene identified that participates in insulin signaling and may play a role in thiazolidinedione-induced insulin sensitization.
It recently was demonstrated that insulin stimulates the tyrosine phosphorylation of the c-Cbl protooncogene product. This phosphorylation of c-Cbl occurred in differentiated adipocytes but was not observed in preadipocytes or other cell types (1). On phosphorylation, c-Cbl is translocated to the caveolae-enriched domain in the plasma membrane, where it can interact with the kinase fyn to initiate localized and specific tyrosine phosphorylation of caveolin and other sequestered proteins (2). To explore the tissue-specific nature of insulin-stimulated c-Cbl tyrosine phosphorylation, we searched for adipocyte-specific c-Cbl-interacting proteins. These efforts resulted in the cloning of a gene encoding a protein that we termed CAP for c-Cbl-associated protein (3). Both CAP mRNA and proteins are expressed in 3T3-L1 adipocytes and not in 3T3-L1 fibroblasts. CAP contains a unique structure with three adjacent SH3 domains in the C terminus and a putative sorbin homology domain at the N terminus. Both CAP expression and c-Cbl tyrosine phosphorylation were observed exclusively in cells that respond metabolically to insulin, suggesting that this pathway might play a critical role in insulin signal transduction.
Thiazolidinediones (TZDs) are a class of antidiabetic drugs that improve insulin sensitivity in both animals and humans with insulin resistance (4, 5). These drugs decrease hyperglycemia, hyperinsulinemia, and hypertriglyceridmia associated with insulin resistance, reversing many of the clinical manifestations of Type II diabetes (6). TZDs bind to and activate the peroxisome proliferator-activated receptor γ (PPARγ), a member of ligand-activated nuclear receptor family (7, 8). PPARγ is expressed prominently in adipocytes and regulates the transcription of a number of adipocyte-specific genes (9–13). Although adipose tissue is an important target for the effect of TZDs (14), it remains unclear how expression of these genes in adipose tissue leads to the profound improvement in insulin sensitivity produced by these drugs.
Thus far, most of the genes known to be regulated directly by PPARγ activation are involved in fatty acid and lipid metabolism and are associated with the differentiation of fat cells (15). As of yet, there have not been target genes for PPARγ identified that play a clear role in signal transduction for insulin. We report here that CAP gene expression is increased directly by PPARγ activation in both in vitro and in vivo models, suggesting that CAP may represent the first direct link of PPARγ to insulin sensitization.
MATERIALS AND METHODS
Cell Culture and Treatment.
3T3-L1 fibroblasts were grown and differentiated into adipocytes as described (16). By using this protocol, 95% of the cells acquired the adipocyte phenotype 5 days after initiating differentiation. Fully differentiated 3T3-L1 adipocytes, 8–10 days after induction of differentiation, were switched to fresh media containing troglitazone or rosiglitazone (BRL49653). Before hormonal treatment, cells were serum-deprived for 12–18 h. Unless otherwise indicated, 100 nM insulin was added directly to the medium, and the incubation was continued for the indicated times at 37°C. The NIH 3T3-PPARγ1 cell line was generated by viral infection of a pBabe-puromycin plasmid containing PPARγ1. At confluency, differentiation was initiated by placing the cells in DMEM containing 10% fetal bovine serum (FBS), 5 μg/ml insulin, 1 μM dexamethasone, and 0.5 mM isometylbuthylxanthine. After 48 h (day 2), the medium was changed to DMEM–10% FBS with 5 μg/ml insulin for an additional 48 h (day 4). When indicated, 50 μM rosiglitazone was included. They subsequently were maintained in DMEM–10% FBS for 3–5 days.
Analysis of RNA.
Total cellular RNA was isolated from cells by the acid guanidinium thiocyanate method (17). Northern blot analyses were performed on total cellular RNA (20 μg) with a purified CAP cDNA or β-actin probes as described (3). RNase protection assays were performed as described (18) by using 10 μg total RNA. The antisense [α-32P]UTP-labeled single stranded RNA probe for CAP mRNA was generated from pGAD-GH-CAP (clone 2.2) (3). Cyclophilin cDNA (Ambion, Austin, TX) was used as a control. All results were quantified by using a Molecular Dynamics PhosphorImager.
Nuclear Run-On Transcription.
Purified nuclei were obtained from 3T3-L1 adipocytes as described (19). For run-on analyses, nuclei were incubated for 30 min at 30°C with 0.3 mCi of [α-32P]UTP (3,000 Ci/mmol, Amersham)-containing transcription assay mixture, and then total RNA was extracted (20). RNA aliquots containing equal amounts of radioactivity (≈20 × 106 cpm/ml) were hybridized with immobilized denatured cDNA fragments of CAP or β-actin (1 μg each). Blots were washed to high stringency and were autoradiographed for 48 h at −70°C.
Experimental Animals.
Male Zucker diabetic fatty rats (ZDF; fa/fa) and lean Zucker littermates (fa/+ or +/+) were from Genetic Models (Indianapolis). The animals were fed either a control diet or a diet containing troglitazone (6 mg/kg/day) beginning at 6 weeks of age and continuing for an additional 12 weeks. The animals were maintained at 22°C with a 12-/12-h fixed light-dark cycle. Blood was collected from the tail vein, and plasma glucose, insulin, and triglyceride concentrations were monitored throughout the dosing period.
Immunoprecipitations and Immunoblotting.
Epididymal adipose tissues were minced and homogenized with 20 strokes of a Dounce homogenizer in lysis buffer containing 2% Triton X-100, 50 mM Tris⋅HCl (pH 7.6), 300 mM NaCl, and 10 μg/ml each aprotinin and leupeptin. Cell lysates from 3T3-L1 adipocytes were prepared and immunoprecipitated as described (1). Equal protein amounts were separated by SDS/PAGE and were transferred and immunoblotted with anti-CAP antibodies (3) or were precipitated with anti-c-Cbl antibodies (Santa Cruz Biotechnology), followed by immunoblotting with antiphosphotyrosine antibody RC20H (Transduction Laboratories, Lexington, KY). Individual proteins were detected with the specified antibodies and were visualized by blotting with horseradish peroxidase-linked secondary antibodies (Amersham).
Statistical Analysis.
Statistical significance of differences was assessed by using the Student’s t test for unpaired data. A P value <0.05 was considered to be statistically significant.
RESULTS
Thiazolidinediones Stimulate the Expression of CAP in 3T3-L1 Adipocytes.
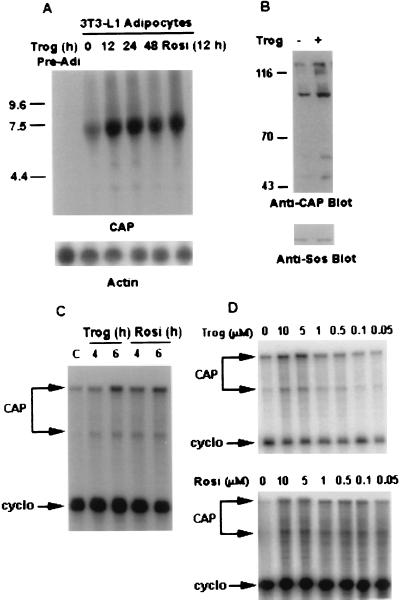
To explore the role of CAP in insulin signaling, we investigated whether activation of PPARγ by thiazolidinediones would affect CAP gene expression in 3T3-L1 adipocytes (Fig. 1A). CAP mRNA was not detected in undifferentiated fibroblasts. A major, broad band of 7 kilobases appeared after the induction of differentiation into adipocytes. Treatment of differentiated 3T3-L1 cells (days 8–10) with the TZD troglitazone for 12 h caused a 4- to 5-fold increase in the level of CAP mRNA that was sustained for up to 48 h. This response also was observed with the TZD rosiglitazone (Fig. 1A).
Figure 1.
Activation of CAP gene in 3T3-L1 adipocytes by PPARγ activators. (A) 3T3-L1 adipocytes were treated with troglitazone (10 μM) for the indicated times or with rosiglitazone (10 μM) for 12 h. CAP and β-actin mRNA expressions were measured by Northern blot analysis sequentially. (B) Cell lysates prepared from 3T3-L1 adipocytes treated with troglitazone (10 μM) for 12 h or left untreated were analyzed directly by immunoblotting with anti-CAP antibodies (anti-CAP Blot) or anti-Sos antibodies (Anti-Sos Blot). (C) 3T3-L1 adipocytes were treated either with troglitazone or rosiglitazone (10 μM) for the indicated times or were left untreated. RNase protection assay was performed on total RNA (10 μg/per sample) as described in Materials and Methods. (D) 3T3-L1 adipocytes were treated with the indicated concentrations of either troglitazone or rosiglitazone for 12 h, and 10 μg/sample total RNA was analyzed by RNase protection assay. Trog, troglitazone; Rosi, rosiglitazone; cyclo, cyclophilin.
To determine whether troglitazone treatment stimulates the expression of CAP proteins, equivalent amounts of proteins prepared from 3T3-L1 adipocytes treated with or without troglitazone for 12 h were analyzed by immunoblotting with anti-CAP antibodies. Anti-CAP antibodies detected several proteins in 3T3-L1 adipocyte cell lysates (3) representing different isoforms or alternatively spliced variants of CAP. Troglitazone treatment significantly increased the expression levels of all detectable translation products of CAP in 3T3-L1 adipocytes (Fig. 1B). There was no change in levels of the nonrelated protein Sos. Thus, the effect of troglitazone to increase CAP mRNA is associated closely with an increase in CAP proteins.
Analysis of CAP mRNA levels by RNase protection assay using a CAP antisense probe spanning the splice site B in CAP cDNA (3) revealed that both troglitazone and rosiglitazone increased the expression of two CAP mRNA bands corresponding to protection of the two splicing products (Fig. 1C). The effect of both troglitazone and rosiglitazone on CAP mRNA occurred within 4–6 h after treatment of adipocytes with the compounds.
To confirm that the regulated expression of CAP by TZDs was modulated by activation of PPARγ, the dependence of these changes on troglitazone or rosiglitazone concentration was determined. Treatment of 3T3-L1 adipocytes with troglitazone for 12 h induced a dose-dependent increase in CAP mRNA, with a maximum effect attained at 5–10 μM and with an EC50 of 1 μM (Fig. 1D). Rosiglitazone treatment also increased CAP mRNA levels in a dose-dependent manner, with the half-maximal response occurring at ≈50–100 nM (Fig. 1D). These concentrations are in agreement with the reported Kd of troglitazone and rosiglitazone for binding to PPARγ, as well as concentrations required for reporter gene expression in transactivation assays (7, 8, 21).
Thiazolidinediones Directly Increase the Transcription of the CAP Gene in 3T3-L1 Adipocytes.
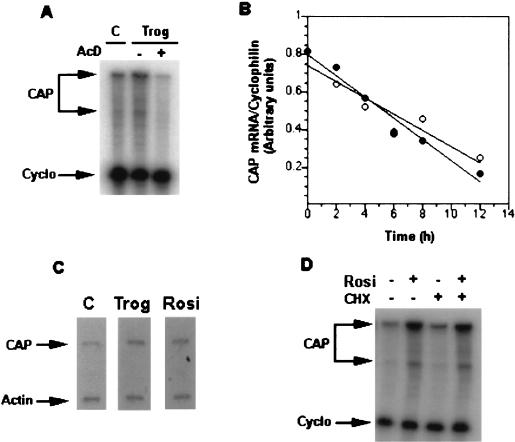
To elucidate the mechanism by which TZDs regulate CAP mRNA levels in 3T3-L1 adipocytes, we measured mRNA stability and the rate of transcription of the gene. Preincubation with the transcription inhibitor actinomycin D (5 μg/ml) completely inhibited the troglitazone-induced increase in the steady-state level of CAP mRNA (Fig. 2A). To measure CAP mRNA stability, cells were exposed to troglitazone for 12 h and were incubated further with actinomycin D in the absence or presence of the drug (Fig. 2B). The estimated half-life of CAP mRNA was ≈8 h in both troglitazone-treated and control cells, indicating that troglitazone treatment did not alter CAP message stability.
Figure 2.
Regulation of CAP mRNA level by PPARγ activators. (A) Actimomycin D (5 μg/ml) was added 1 h before troglitazone treatment of 3T3-L1 adipocytes for 12 h. The relative level of CAP mRNA was determined by RNase protection assay. (B) After treatment of 3T3-L1 adipocytes with troglitazone (10 μM) for 12 h, the cells were rinsed three times, and actimomycin D (5 μg/ml) then was added. Cells were incubated further in the absence (○) and presence (•) of troglitazone for the indicated times. CAP mRNA was measure by RNase protection assay. Message levels were quantitated, and the CAP/cyclophilin mRNA ratio was calculated. Results shown are representative of three separate experiments with essentially identical results. (C) 3T3-L1 adipocytes were untreated or treated with troglitazone or rosiglitazone (10 μM) for 12 h. Nuclei were isolated, and nuclear transcription assays were performed as described in Materials and Methods. (D) 3T3-L1 adipocytes were treated with cycloheximide (5 μg/ml) for 30 min before treatment with rosiglitazone (10 μM) for 12 h. Total RNA was isolated and analyzed for CAP mRNA expression by RNase protection assay. Trog, troglitazone; Rosi, rosiglitazone; CHX, cycloheximide.
To evaluate transcriptional activation of CAP gene by troglitazone or rosiglitazone, nuclear run-on assays were performed. As shown in Fig. 2C, nuclei isolated from 3T3-L1 adipocytes exposed to either troglitazone or rosiglitazone had a 2- to 3-fold higher CAP transcription rate compared with untreated cells. The relative transcription rates were normalized to the hybridization with β-actin.
To determine whether synthesis of new protein is required for the stimulation of CAP transcription, 3T3-L1 adipocytes were treated with the protein synthesis inhibitor cycloheximide (5 μg/ml) before rosiglitazone treatment (Fig. 2D). Inhibition of protein synthesis with cycloheximide did not significantly alter basal CAP mRNA and did not block the ability of rosiglitazone to stimulate CAP gene expression. Taken together, these experiments suggest that troglitazone and rosiglitazone regulate the expression of CAP mRNA at the transcriptional level, in a manner independent of new protein synthesis.
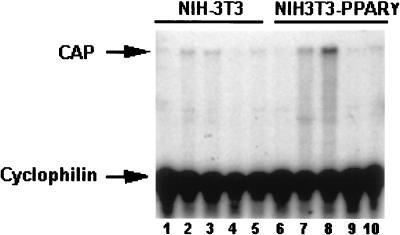
To study further the role of PPARγ in regulating CAP expression, we quantitated CAP mRNA levels in NIH 3T3 fibroblasts that express PPARγ1 cDNA from a retroviral vector by RNase protection assay (Fig. 3). NIH 3T3 parental or PPARγ-expressing cells maintained in FBS-containing medium did not express CAP (Fig. 3, lanes 1 and 6), consistent with previous findings (22). CAP mRNA expression was detected in NIH 3T3-PPARγ cells cultured in differentiation medium (Fig. 3, lane 7). Addition of rosiglitazone to NIH 3T3-PPARγ cells cultured in differentiation medium markedly enhanced CAP mRNA expression (Fig. 3, lane 8). Culture of these cells in medium containing only insulin did not result in CAP mRNA expression (Fig. 3, lane 9) whereas exposure to rosiglitazone alone had a minor effect (Fig. 3, lane 10). NIH 3T3 parental cells did not contain significantly elevated levels of CAP mRNA under either condition (Fig. 3, lanes 2–5). Thus, expression and activation of PPARγ in nonadipogenic fibroblasts, which is sufficient to promote their differentiation into mature adipocytes (23), also induces the expression of CAP mRNA in these cells.
Figure 3.
Expression of PPARγ1 activates CAP gene expression. NIH 3T3 cells infected with a retrovirus carrying PPARγ1 or vector alone were cultured in medium containing 10% FBS (lanes 1 and 6), differentiation media (lanes 2 and 7), differentiating media containing 50 μM rosiglitazone (lanes 3 and 8), medium containing 10% FBS and insulin (lanes 4 and 9), or rosiglitazone (lanes 5 and 10). Total RNA was extracted and analyzed (30 μg/lane) by RNase protection assay.
PPARγ Activation Enhances the Tyrosine Phosphorylation of c-Cbl by Insulin.
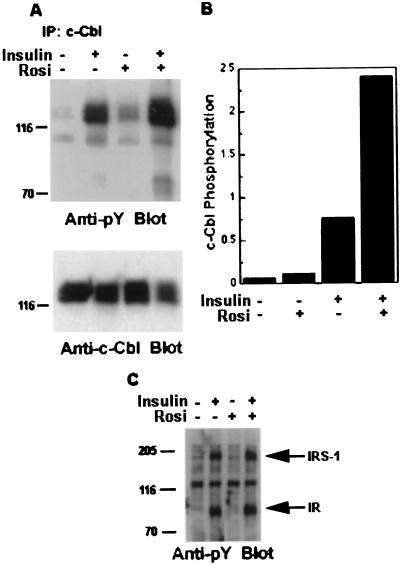
The specificity of c-Cbl tyrosine phosphorylation by insulin for differentiated 3T3-L1 cells, and the possible involvement of CAP in this phosphorylation, led us to evaluate whether PPARγ activation can modulate the insulin-stimulated tyrosine phosphorylation of c-Cbl. 3T3-L1 adipocytes were treated with or without rosiglitazone for 12 h before serum starvation and then for an additional 12 h in the presence of rosiglitazone. Cells were treated with or without insulin, and equal amounts of protein were immunoprecipitated with anti-c-Cbl antibodies. Phosphorylation was analyzed by immunoblotting with antiphosphotyrosine antibodies (Fig. 4A, Anti-pY Blot). Although tyrosine phosphorylation of c-Cbl was barely detected in unstimulated 3T3-L1 adipocytes, addition of insulin caused a marked increase. After pretreatment of cells with rosiglitazone, a slight increase in the basal tyrosine phosphorylation of c-Cbl was observed. Addition of insulin to these cells further produced a significant increase in the tyrosine phosphorylation of the protein (Fig. 4B). This phenomenon was not caused by increased expression of c-Cbl (Fig. 4A, Anti-c-Cbl Blot). The small increase in insulin-stimulated tyrosine phosphorylation of IRS-1 and insulin receptor in cells pretreated with rosiglitazone, consistent with previous results, were not comparable to those observed with c-Cbl (Fig. 4C and ref. 24).
Figure 4.
Effect of rosiglitazone on c-Cbl tyrosine phosphorylation in 3T3-L1 adipocytes. (A) 3T3-L1 adipocytes were treated with or without 5 μM rosiglitazone for 12 h before serum starvation for an additional 12 h in the presence of rosiglitazone. After insulin stimulation for 1 min, equal amounts of protein were immunoprecipitated with anti-c-Cbl antibodies. The resulting immunoprecipitates were analyzed by immunoblotting with anti-phosphotyrosine antibodies (Anti-pY Blot). The blot then was stripped and reprobed with anti-c-Cbl antibodies (Anti-c-Cbl Blot). (B) The Western blots from A were quantitated by densitometric scanning. The results represent the intensities of the signal corresponding to tyrosine-phosphorylated c-Cbl normalized against that of c-Cbl protein in the same sample. (C) Equal protein amounts (30 μg per lane) of the cell lysates used in A were analyzed directly by antiphosphotyrosine antibodies immunoblotting (anti-pY Blot). The positions of the insulin receptor (IR) and the insulin receptor substrate 1 (IRS-1) are indicated by arrows. Results are representative of experiments performed at least three times.
Regulation of CAP Expression in Zucker Diabetic Fatty (ZDF) (fa/fa) Rats Treated with Troglitazone.
To explore whether PPARγ activation would induce changes in CAP expression in vivo similar to those observed in 3T3-L1 adipocytes, we examined the effect of troglitazone in a rodent model of insulin resistance, the ZDF rat. Both ZDF and lean littermate rats were treated with troglitazone at 6 weeks of age. Treatment of ZDF rats with troglitazone completely prevented hyperglycemia in this experiment (Table 1). After 4 weeks of treatment, the drug also prevented the hyperinsulinemia associated with insulin resistance. By 12 weeks, the ZDF rats characteristically lose β-cell function (25). Troglitazone treatment raised plasma insulin levels at this stage, suggesting that sufficient β-cell function was preserved by the reversal of insulin resistance. Additionally, plasma triglycerides levels also were decreased in both ZDF rats and lean littermates treated with troglitazone (Table 1).
Table 1.
Prevention of diabetes in ZDF rats
| Blood glucose, mg/dl
|
Plasma insulin, ng/dl
|
Plasma triglyceride, mg/dl
|
|||||||
|---|---|---|---|---|---|---|---|---|---|
| Treatment time, weeks
|
Treatment time, weeks
|
Treatment time, weeks
|
|||||||
| 0 | 4 | 12 | 0 | 4 | 12 | 0 | 4 | 12 | |
| Zucker lean | |||||||||
| Control | 137 ± 3 | 131 ± 1 | 143 ± 3 | 0.78 ± 0.13 | 1.08 ± 0.17 | 1.4 ± 0.3 | 74 ± 1 | 110 ± 8 | 134 ± 8 |
| Troglitazone | 132 ± 2 | n.d. | n.d. | n.d. | 80 ± 7 | n.d. | |||
| ZDF | |||||||||
| Control | 146 ± 4 | 447 ± 25 | 675 ± 25 | 5.87 ± 0.62 | 13.32 ± 1.26 | 3.5 ± 0.4 | 80 ± 2 | 1107 ± 66 | 813 ± 85 |
| Troglitazone | 131 ± 2** | 162 ± 3* | 8.86 ± 0.62** | 20.9 ± 1.6** | 120 ± 5** | 362 ± 16** | |||
Male Zucker (fa/fa) rats or lean littermates (n = 6–9 for each group) were 6 weeks old when troglitazone treatment began. Blood glucose, plasma insulin, and triglycerides levels were determined 4 weeks and 12 weeks after troglitazone treatment. Data are means ± SEM. Differences are statistically significant for *P < 0.05, **P < 0.001 compared to troglitazone treated rats. n.d., not determined.
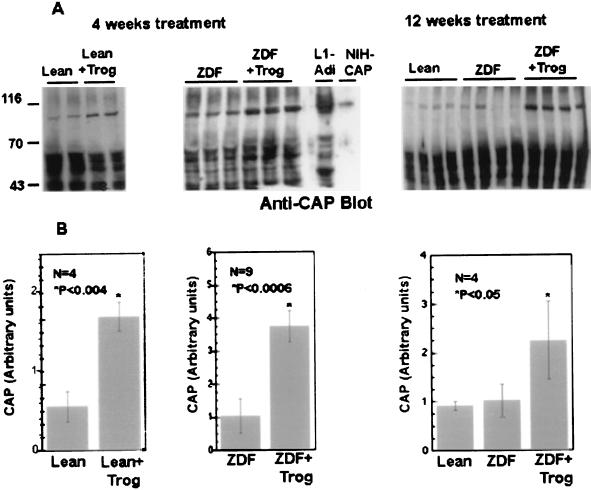
To determine whether changes in CAP expression correlated with the antidiabetic effects of troglitazone, we analyzed CAP expression in lysates of epididymal adipose tissues isolated from these animals. Fig. 5 shows that the anti-CAP antibodies recognized an 88- to 90-kDa protein in rat adipose tissue that comigrated with the major 88- to 90-kDa isoform of CAP in 3T3-L1 adipocytes or recombinant CAP expressed in NIH 3T3 cells (Fig. 5A Center). The level of the 88- to 90-kDa CAP protein was 3- to 4-fold higher in adipose tissue from troglitazone-treated animals and was maintained for 12 weeks. Moreover, treatment of lean Zucker littermates with troglitazone for 4 weeks resulted in a marked increase in CAP protein levels. In contrast to adipose tissue, there was no statistically significant change in the expression of CAP in liver or skeletal muscle of troglitazone-treated ZDF rats (data not shown). Thus, the regulation of CAP expression by troglitazone is adipose-specific, consistent with the predominant expression of PPARγ in this tissue.
Figure 5.
Effect of troglitazone on CAP levels in Zucker rats. (A) Zucker lean rats (+/fa) and ZDF rats were treated with troglitazone for 4 or 12 weeks as indicated. Each lane contains 30 μg of protein prepared from white adipose tissues of individual animals. The proteins were separated by SDS/PAGE followed by immunoblotting with anti-CAP antibodies. A representative Western blot using anti-CAP antibodies is shown. (B) The intensities of the 80- to 90-kDa protein were measured by densitometric scanning and were normalized against the expression of Sos examined in the same sample as a control. The results represent the mean ± SD derived from all experimental animals. L1-Adi, 3T3-L1 adipocytes cell lysates, NIH-CAP, NIH 3T3 stably transfected with an expression vector containing CAP cDNA. Values statistically significant from their respective controls are indicated by an asterisk.
DISCUSSION
Thiazolidinediones are a class of orally active drugs designed to enhance the activity of insulin and thus reverse insulin resistance common to Type II diabetes and other metabolic disorders (4–6). The effects of these drugs are mediated by changes in the transcription of genes via a direct interaction with the nuclear receptor PPARγ (7, 8). Although the full spectrum of the transcriptional targets of this receptor remains to be determined, in vitro studies have revealed that PPARγ induces differentiation of preadipocytes into adipocytes (23). This increased differentiation is accompanied by enhanced expression of adipocyte-specific genes such as the fatty acid binding protein aP2 (12), lipoprotein lipase (13), and acyl-CoA synthetase (14).
Although the gene products regulated by PPARγ participate in fatty acid uptake and metabolism in the adipocyte, it remains uncertain whether changes in expression of these genes underlie the insulin-sensitizing effects of TZDs. Although these drugs can reduce the elevation in free fatty acids, triglycerides, and lipoproteins associated with insulin resistance, improvements in insulin sensitivity also are observed in animal models and humans that do not exhibit marked dyslipidemias (6). However, because there are no reliable in vitro models of insulin resistance, it has been difficult to identify PPARγ-responsive genes that can explain the improvement in insulin action observed in vivo with PPARγ-activating TZDs. To address this dilemma, we have evaluated the effect of PPARγ activation on the expression of certain genes encoding proteins that are thought to play some role in insulin action in 3T3-L1 adipocytes. We report here that TZDs directly and potently increase CAP gene expression. The effect of TZDs on CAP gene expression is consistent with a direct stimulatory effect on PPARγ. Expression of the CAP gene is activated rapidly and persistently by both troglitazone and rosiglitazone in a dose-dependent manner and correlates with the ability of the compounds to bind and activate PPARγ. Moreover, this increase in CAP gene expression is a direct result of increased transcription, which is independent of new protein synthesis. Additionally, ectopic expression of PPARγ in fibroblasts leads to CAP expression. Taken together, these data suggest that the regulation of CAP expression by TZDs is caused by direct interaction of PPARγ with a peroxisome proliferator responsive element in CAP gene, although this element has yet to be identified.
In addition to effects observed in 3T3-L1 adipocytes, CAP expression apparently was induced by the TZD troglitazone in vivo in a rodent model of Type II diabetes, the Zucker (fa/fa) rat. This increased expression of CAP was pronounced, was correlated with the insulin sensitizing effects of the drug, and was sustained over a long period. Although CAP is expressed prominently in liver and muscle in addition to adipose tissue in the rat (3), the increase in expression produced by troglitazone was observed only in adipose tissue. This is in accordance with experiments demonstrating that PPARγ is found predominately in adipose tissue, which is likely to represent an important target for the effect of TZD in the rat (9, 26). Moreover, these data suggest that, in this animal model, increased sensitivity of muscle to insulin induced by TZD treatment may be indirect.
The identification of CAP as a PPARγ-sensitive gene may represent the first direct connection between activation of this nuclear receptor and insulin sensitivity. The effects of TZDs on the CAP gene were observed in mature 3T3-L1 adipocytes and were not merely reflective of enhanced adipocyte differentiation. The increased expression of CAP directly correlated with enhanced sensitivity of 3T3-L1 adipocytes to insulin and was associated with increases in insulin-stimulated tyrosine phosphorylation of c-Cbl. This likely was caused by the presumed role of CAP in recruiting c-Cbl to the insulin receptor for c-Cbl tyrosine phosphorylation (3).
CAP expression and c-Cbl tyrosine phosphorylation provide a potential mechanism for spatial compartmentalization in insulin signaling because of the specific association of c-Cbl with caveolae proteins on tyrosine phosphorylation. Unlike other phosphorylation events in 3T3-L1 adipocytes, the activation of this pathway is insulin-specific and correlates with metabolic sensitivity of cells to insulin (27). The activation of PPARγ with insulin-sensitizing TZDs increases CAP expression both in vitro and in vivo, suggesting that the CAP-c-Cbl pathway may play a critical role in insulin action and, further, that CAP gene may be an important transcriptional target for PPARγ.
ABBREVIATIONS
- CAP
c-Cbl associated-protein
- TZD
thiazolidinedione
- PPARγ
peroxisome proliferator-activated receptor γ
- FBS
fetal bovine serum
- ZDF
Zucker diabetic fatty
References
- 1.Ribon V, Saltiel A R. Biochem J. 1997;324:839–846. doi: 10.1042/bj3240839. [DOI] [PMC free article] [PubMed] [Google Scholar]
- 2.Mastick C C, Saltiel A R. J Biol Chem. 1997;272:20706–20714. doi: 10.1074/jbc.272.33.20706. [DOI] [PubMed] [Google Scholar]
- 3.Ribon V, Printen J A, Hoffman N G, Kay B K, Saltiel A R. Mol Cell Biol. 1998;18:872–879. doi: 10.1128/mcb.18.2.872. [DOI] [PMC free article] [PubMed] [Google Scholar]
- 4.Nolan J J, Ludvik B, Beerdsen P, Joyce M, Olefsky J M. N Engl J Med. 1994;331:1188–1193. doi: 10.1056/NEJM199411033311803. [DOI] [PubMed] [Google Scholar]
- 5.Saltiel A R, Olefsky J M. Diabetes. 1996;45:1661–1669. doi: 10.2337/diab.45.12.1661. [DOI] [PubMed] [Google Scholar]
- 6.Hoffman C A, Colca J R. Diabetes Care. 1992;15:1075–1078. doi: 10.2337/diacare.15.8.1075. [DOI] [PubMed] [Google Scholar]
- 7.Lehmann J M, Morre L B, Smith-Oliver T A, Wilkison W O, Willson T M, Kliewer S A. J Biol Chem. 1995;270:12953–12956. doi: 10.1074/jbc.270.22.12953. [DOI] [PubMed] [Google Scholar]
- 8.Willson T M, Cobb J E, Cowan D J, Wiethe R W, Cirrera I D, Prakash S R, Beck K D, Moore L B, Kliewer S A, Lehmann J M. J Med Chem. 1996;39:665–668. doi: 10.1021/jm950395a. [DOI] [PubMed] [Google Scholar]
- 9.Tontonoz P, Hu E, Graves R A, Budavari A B, Spiegelman B. Genes Dev. 1994;8:1224–1234. doi: 10.1101/gad.8.10.1224. [DOI] [PubMed] [Google Scholar]
- 10.Harris P K, Kletzien R F. Mol Pharmacol. 1994;45:439–445. [PubMed] [Google Scholar]
- 11.Tontonoz P, Hu E, Devine J, Beale E G, Spiegelman B. Mol Cell Biol. 1995;15:351–357. doi: 10.1128/mcb.15.1.351. [DOI] [PMC free article] [PubMed] [Google Scholar]
- 12.Schoonjans K, Peinado-Onsurbe J, Heyman R A, Briggs M, Cayet D, Deeb S, Staels B, Auwerx J. EMBO J. 1996;15:5336–5348. [PMC free article] [PubMed] [Google Scholar]
- 13.Martin G, Schoonjan K, Lefebvre A, Staels B, Auwerx J. J Biol Chem. 1997;272:28210–28217. doi: 10.1074/jbc.272.45.28210. [DOI] [PubMed] [Google Scholar]
- 14.Chawla A, Schwartz E J, Dimaculangan D D, Lazar M A. Endocrinology. 1994;135:798–800. doi: 10.1210/endo.135.2.8033830. [DOI] [PubMed] [Google Scholar]
- 15.Spiegelman B M, Filer J S. Cell. 1996;87:377–389. doi: 10.1016/s0092-8674(00)81359-8. [DOI] [PubMed] [Google Scholar]
- 16.Rubin C S, Lai E, Rosen O M. J Biol Chem. 1977;252:3554–3557. [PubMed] [Google Scholar]
- 17.Chomcynski P, Sacchi N. Anal Biochem. 1987;162:156–159. doi: 10.1006/abio.1987.9999. [DOI] [PubMed] [Google Scholar]
- 18.Markowitz A J, Wu G D, Birkenmeire E H, Traber P H. Am J Physiol. 1993;265:G526–G539. doi: 10.1152/ajpgi.1993.265.3.G526. [DOI] [PubMed] [Google Scholar]
- 19.Greenberg M E. In: in Current Protocols in Molecular Biology. Ausubel F M, Brent R, Kinston R E, Moore D D, Smith J A, Seidman J G, Stranl K, editors. New York: Wiley; 1988. pp. 4.10.1–4.10.8. [Google Scholar]
- 20.MacDougald O A, Cornelius P, Liu R, Lane M D. J Biol Chem. 1995;270:647–654. doi: 10.1074/jbc.270.2.647. [DOI] [PubMed] [Google Scholar]
- 21.Sears I, NacGinntie M A, Kovacs L G, Graves R A. Mol Cell Biol. 1996;16:3410–3419. doi: 10.1128/mcb.16.7.3410. [DOI] [PMC free article] [PubMed] [Google Scholar]
- 22.Ribon V, Herrera R, Kay B K, Saltiel A R. J Biol Chem. 1998;273:4073–4080. doi: 10.1074/jbc.273.7.4073. [DOI] [PubMed] [Google Scholar]
- 23.Tontonoz P, Hu E, Spiegelman B. Cell. 1994;79:1147–1156. doi: 10.1016/0092-8674(94)90006-x. [DOI] [PubMed] [Google Scholar]
- 24.Peraldi P, Xu M, Spiegelman B M. J Clin Invest. 1997;100:1863–1869. doi: 10.1172/JCI119715. [DOI] [PMC free article] [PubMed] [Google Scholar]
- 25.Sturis J, Pugh W L, Tang J, Polonsky K S. Am J Physiol. 1995;269:E786–E792. doi: 10.1152/ajpendo.1995.269.4.E786. [DOI] [PubMed] [Google Scholar]
- 26.Braissant O, Foufelle F, Scotto C, Dauca M, Whali W. Endocrinology. 1996;137:354–366. doi: 10.1210/endo.137.1.8536636. [DOI] [PubMed] [Google Scholar]
- 27.Saltiel A R. Am J Physiol. 1996;270:E375–E385. doi: 10.1152/ajpendo.1996.270.3.E375. [DOI] [PubMed] [Google Scholar]


