

Abstract
This was a prospective, cluster randomized controlled trial in patients with uncontrolled hypertension aged 21 to 85 years (mean, 61 years). Pharmacists made recommendations to physicians for patients in the intervention clinics (n=101) but not patients in the control clinics (n=78). The mean adjusted difference in systolic blood pressure (BP) between the control and intervention groups was 8.7 mm Hg (95% confidence interval [CI], 4.4–12.9), while the difference in diastolic BP was 5.4 mm Hg (CI, 2.8–8.0) at 9 months. The 24‐hour BP levels showed similar effects, with a mean systolic BP level that was 8.8 mm Hg lower (CI, 5.0–12.6) and a mean diastolic BP level that was 4.6 mm Hg (CI, 2.4–6.8) lower in the intervention group. BP was controlled in 89.1% of patients in the intervention group and 52.9% in the control group (adjusted odds ratio, 8.9; CI, 3.8–20.7; P<.001). Physician/pharmacist collaboration achieved significantly better mean BP values and overall BP control rates, primarily by intensification of medication therapy and improving patient adherence.
Hypertension is a serious problem throughout the world, affecting more than 1 billion persons. 1 , 2 Uncontrolled blood pressure (BP) is thought to contribute to 7 million deaths worldwide each year. 2 Controlling BP can reduce heart failure by >50%, stroke by 35% to 40%, and myocardial infarction by 20% to 25%. 3 The reasons for poor control are multifactorial and include patient, physician, and care delivery factors. 4 , 5 , 6 , 7 , 8 Reports suggest that many physicians do not adhere to hypertension guidelines. 8 , 9 , 10 , 11 , 12 One common finding is that medications are frequently not used optimally when BP remains uncontrolled. 4 , 5 , 6 , 7 , 8 These problems contribute to the finding that in 2003 to 2004, hypertension was only controlled in about 37% of the 65 million Americans with this condition. 13
Studies have evaluated numerous approaches to improving BP control and have generally found that education is important but may be an insufficient strategy. 14 , 15 , 16 , 17 Various analyses have found that changing the organization of office practices, including adding pharmacists, may improve outcomes for chronic conditions including hypertension. 18 , 19 , 20 , 21 , 22 An international review of best practices to effect change in improving practices suggested that expanding pharmacists' roles led to better prescribing behavior. 18 An analysis of clinical trials conducted by the Stanford‐UCSF Evidence‐Based Practice Center for the Agency for Health Care Research and Quality (AHRQ) found that the most effective strategies include interdisciplinary management of hypertension. 15 These analyses found that using clinical pharmacists in case management resulted in improvements in BP control. 22 , 23 , 24 , 25 , 26 , 27 , 28 , 29 Many previous studies, however, were small single‐site studies; involved only one intervention pharmacist; did not control for many patient, physician, or clinic variables; and/or did not use an unbiased BP measurement technique. There was also a suggestion of publication bias because most studies were small. 15
The purpose of the present efficacy study was to evaluate the ability of a physician/pharmacist collaborative model to improve BP control while maintaining high internal validity. We hypothesized that in patients cared for using this model, lower mean BP values and higher rates of BP control as defined by the Seventh Report of the Joint National Committee on Prevention, Detection, Evaluation, and Treatment of High Blood Pressure guidelines (JNC 7) 3 would be achieved.
METHODS
Study Sites
This study was a prospective, cluster randomized, controlled efficacy trial involving 5 clinics operated by one university. General internists or family physicians staffed all clinics. Two clinics had clinical pharmacist practitioners for many years, while 3 clinics had never had a pharmacist in the office. The clinics with or without clinical pharmacists were randomized separately to control (n=3, 1 with clinical pharmacists previously) or intervention clinics (n=2, 1 with a clinical pharmacist previously). Randomization of clinics was performed using a table of random numbers. Randomization at the clinic level was used to minimize contamination at the physician level. A new clinical pharmacist was assigned to the one intervention site that previously had not had a pharmacist in the office. The 3 clinical pharmacists in the control site abstained from making recommendations for any patients in the control group, but they continued to answer general treatment questions from physicians in their clinic.
Patients, Physicians, and Data Collection
Educational lectures were provided to physicians in all 5 clinics (control and intervention sites) by one investigator (BLC) immediately before patients were enrolled and after clinic randomization. The majority of participating physicians attended these training sessions. Handouts, slides, and the JNC 7 express version were supplied to all physicians, including those who were unable to attend these sessions.
To reduce variation due to physician training, only patients cared for by faculty physicians were included in the study. One control and one intervention clinic were located in the Family Care Center at the university. These clinics were distinct, and patients did not move between these clinics. The other 3 clinics were located approximately 4 (intervention), 6 (control), and 15 (control) miles from the university.
Lists of patients with diagnostic codes for hypertension were obtained, and the research nurses screened medical records of all patients with hypertension. Patients who met the study criteria were sent a postcard and asked to contact the research nurse. In addition, research nurses periodically screened daily schedules for patients with hypertension. Finally, physicians could refer patients to the study. Patient recruitment began in January 2004, and patients were assigned to the control or intervention group by virtue of the clinics' randomization. The last patient completed the trial in October 2006.
Men and women aged 21 to 85 years with a diagnosis of hypertension were eligible if they did not have diabetes and their clinic systolic BP (SBP) level was between 145 and 179 mm Hg or their clinic diastolic BP (DBP) level was 95 to 109 mm Hg. Patients with diabetes who had a clinic SBP level between 135 and 179 mm Hg or a clinic DBP from 85 to 109 mm Hg were eligible. Exclusion criteria included BP medication or dose change within 4 weeks of the baseline visit, enrollment in the 24‐hour BP monitoring consult service within the previous 6 months, stage 3 hypertension (BP >180/110 mm Hg), evidence of hypertensive urgency or emergency, recent myocardial infarction or stroke (within 6 months before enrollment), New York Heart Association class III or IV congestive heart failure, unstable angina, serious renal or hepatic disease, pregnancy, poor prognosis (life expectancy <3 years), dementia, or cognitive impairment.
Prior to this study, there were no clinical trials of this model that randomized by clinic. Thus, several fixed and random effects that affect power were unknown a priori, such as within‐ and between‐patient variability, between‐physician variability, and between‐clinic variability. Therefore, we used several techniques to estimate power and sample size. First, we powered the study by letting sigma denote the population standard deviation of the change scores averaged across physicians within each clinic for a given quantitative outcome (eg, mean BP) and assumed an α=.05 (2‐sided). The power for detecting a 3.4‐sigma difference between 2 intervention clinics and 3 control clinics would be 80%, and a 3.9‐sigma difference will be detected with 90% certainty. Even with this uncertainty, the clinical effect was known from previous studies to be 10 to 12 mm Hg SBP. 15 We assumed a typical 2‐sample comparison of normal data and a 2‐tailed test with α and β of .05 and .95, respectively. The estimated sample size was 47 patients per group. As noted above, because this was a longitudinal study with several fixed and random effects, we inflated the sample size to 90 patients per group (180 total) in consideration of this unknown variability.
The study was approved by the University of Iowa Institutional Review Board, and all patients signed informed consent. Patients and physicians were aware that there were control and intervention groups as part of the consent process, but this fact was not emphasized by the investigators and research nurses. Nonetheless, most physicians and patients likely recognized their group assignment. Both physicians and patients were blinded to the 24‐hour BP results, however, so the 24‐hour results were the most important for analysis purposes. Two different research nurses were dedicated to patients in either control sites or intervention sites to minimize contamination. The research nurses were employed by the investigators specifically for this study. The research nurse collected the following data at the baseline visit: patient age, sex, race, education level, insurance status, household income, marital status, smoking status, alcohol intake, and history of coexisting conditions. They measured the patient's height and weight; calculated a body mass index; recorded all antihypertensive medications, doses, and dates of last refills; and performed a pill count of BP medications. The nurse personally administered questions on adverse reactions. 30 The adverse reaction questionnaire was developed for another study and included 47 questions of typical medication adverse effects. 30 For each potential reaction, the patient was asked, “In the past 4 weeks, how much have you been bothered by …” The patient could rate the potential reaction as follows: 0 (not at all), 1 (a little bit), 2 (somewhat), 3 (quite a bit), or 4 (very much). The responses for each patient were summed (potential range, 0–188).
Research nurses were specially trained to measure BP using American Heart Association guidelines and the process used in the African American Study of Kidney Disease and Hypertension (AASK). 31 , 32 Specifically, the nurses measured the participants' BP 3 times at each data collection visit using a mercury sphygmomanometer and standardized techniques from clinical BP trials. 31 , 32 The second and third values were averaged and used as the clinic BP. The nurses were certified quarterly in their ability to accurately position patients and measure BP to ensure consistent and valid readings. The clinic BP values were provided to the physician and/or clinical pharmacist for patients in both the control and intervention groups. The clinical pharmacist then interviewed patients at intervention sites (see Intervention section below). Patients in both the control and intervention groups saw their physicians at the baseline visit.
Next, a 24‐hour BP monitor set to measure BP every 20 minutes during the day and every 30 minutes during sleep was provided (SpaceLabs 90217‐A, SpaceLabs Medical, Redmond, WA). 33 The 24‐hour results were used as a blinded objective outcome and were not made available to either the patient's physician or the clinical pharmacist until the patient completed the trial. Finally, patients in both groups were given written information on hypertension from the National Heart, Lung, and Blood Institute (NHLBI). The research nurses encouraged all patients (control and intervention) to follow the lifestyle modifications (diet, exercise, smoking cessation) as described in these resources. Patients were also made aware of their goal BP level.
Patients returned at 2, 4, 6, and 8 months for follow‐up data collection visits with the research nurses at which clinic BP measurements, adverse reaction assessments, and pill counts were repeated. At the 9‐month visit, the nurses performed all of the same procedures as performed at the baseline visit, including repeating the 24‐hour BP assessment. Patients received $100 if they completed both 24‐hour BP measurements to compensate them for the inconvenience of wearing the 24‐hour monitors and the extra time required to return the monitors. Patients were telephoned before clinic visits to encourage adherence with study visits.
Intervention
Intervention physicians and pharmacists underwent team‐building exercises conducted by 2 investigators (KBF, WRD) using previous strategies. 34 The sessions explored strategies to investigate suboptimal treatment, poor medication adherence, potential adverse reactions, drug interactions, and other barriers to success. If there was disagreement, the physician made the final decision and these instances were recorded to determine the degree of acceptance of the pharmacists' recommendations.
There were 5 intervention clinical pharmacists, 4 of whom were faculty or clinical pharmacy residents in the university family medicine intervention site. The fifth was placed into the community‐based intervention clinic that had never had a clinical pharmacist on staff before this study. We hoped to increase the generalizability of the study by including 5 different clinical pharmacists and one site that had not previously had a clinical pharmacist. The pharmacists were well versed in hypertension treatment; however, 2 initial 90‐minute training sessions were conducted by one investigator (BLC) to ensure that intervention pharmacists provided a consistent intervention. These training sessions included the JNC 7 guidelines, strategies to improve BP control, methods to optimize therapy, and strategies to improve medication adherence. Follow‐up discussions were held at least quarterly with the pharmacists to ensure fidelity to the intervention.
The intervention protocol specified a patient interview at baseline by the clinical pharmacist. The pharmacist assessed the patient's regimen, suggested a goal BP value, and provided recommendations to improve BP control. BP control was defined as an office BP level <130/80 mm Hg for patients with diabetes or chronic kidney disease and <140/90 mm Hg for all other patients. 3 The protocol specified that pharmacists should recommend therapies consistent with JNC 7 guidelines and educate the physician by providing background information if necessary. 3 The primary focus of the pharmacists was to address suboptimal medication regimens. For instance, pharmacists suggested adding thiazide diuretics if not in the regimen, increasing medication doses to at least moderate levels, utilizing appropriate combination regimens based on pharmacology, and utilizing agents for coexisting conditions when appropriate (eg, angiotensin‐converting enzyme inhibitors for patients with diabetes).
The second major area of the intervention protocol was for patients with poor medication adherence. The pharmacist recommended adherence aids if poor adherence was unintentional. If poor adherence appeared to be intentional, the pharmacist tried to negotiate a strategy to improve adherence. The pharmacists educated all patients using written information from the NHLBI and/or taught them to perform home monitoring. All study visits with intervention pharmacists occurred in the medical office clinic. Pharmacists were encouraged to attend each clinic visit (2, 4, 6, and 8 months), and they were encouraged to initiate additional visits or telephone contact if BP remained uncontrolled. The results of these interviews served as the basis for patient‐specific recommendations and feedback to the physician. Pharmacists could not independently prescribe therapy, so all changes were approved by the physician. Most recommendations to the physician were performed face‐to‐face during the patient visit, but some physicians provided the authority for pharmacists to make dosage changes and then inform them immediately after the visit. Every encounter with the pharmacist was recorded on a case report form that included all recommendations made by the pharmacist. We confirmed how the physician reacted by reconciling the recommendation with the medication list and dose the research nurse collected at each study visit. In the control group, we examined the baseline medication list and dosages and examined changes at each study visit to determine changes by physicians in the control group.
Data Management and Statistical Analysis
All patient data were entered into case report forms by the research nurses. Individual data elements were double‐entered into a database by a blinded data management team that included data technicians, the data manager, and the biostatistician (JDD).
Descriptive statistics (means, standard deviations, and percentages) of patient demographic and health‐related variables were calculated at baseline for each group. Medication adherence was calculated from the pill counts as the percent of predicted doses measured at each study visit. Baseline comparisons between the groups were made using Student t test and Fisher exact test. Preliminary analysis revealed that the response variables were correlated within‐patient, but no significant clustering due to clinics or physicians was observed. For continuous responses (SBP and DBP), likelihood‐based mixed models with random patient effects were fit in SAS PROC MIXED to incorporate all available data from baseline through 9 months in an intention‐to‐treat analysis. For BP control, a Generalized Estimating Equation (GEE) model using the binomial distribution and the logit link was fit in SAS PROC GENMOD, accommodating the correlations across patients. For both of these types of models (mixed and GEE), contrasts were estimated to test for the treatment effect at 2, 4, 6, 8, and 9 months postbaseline. Also in these models, we adjusted for baseline BP level, age, sex, race, education level, insurance status, household income, marital status, smoking status, alcohol intake, body mass index, number of coexisting conditions, number of antihypertensive medications, medication adherence, and total number of visits.
RESULTS
We enrolled 179 patients, and 160 (89.4%) patients had data at both the baseline and 9‐month visit (P=.47 between groups; Figure 1). Most patients (87%) completed all 6 study visits (5.7±1.0 in the intervention group vs 5.5±1.3 in the control group; P=.43). There were optional visits with the pharmacists in the intervention group, resulting in 6.8±1.6 total visits in that group, which we controlled for in the analyses. When adjusted for the intervention effect, the within‐clinic interclass correlation coefficient (ICC) for SBP at 9 months was 0.0084 (within‐clinic variance, 139.1; between‐clinic variance, 1.2; clinic effect; P=.416). When adjusted for all relevant baseline covariates, the ICC went from 0.0084 down to 0.0010. Similarly, the physician effects appeared to be very small, as the within‐physician ICC was 0.0097, within‐physician variance was 138.4, and between‐physician variance was 1.4 (physician effect; P=.418). When adjusted for the baseline covariates, the between‐physician ICC went from 0.0097 down to 0.0005. These results demonstrate that there was no clustering of effect by clinic or physician.
Figure 1.
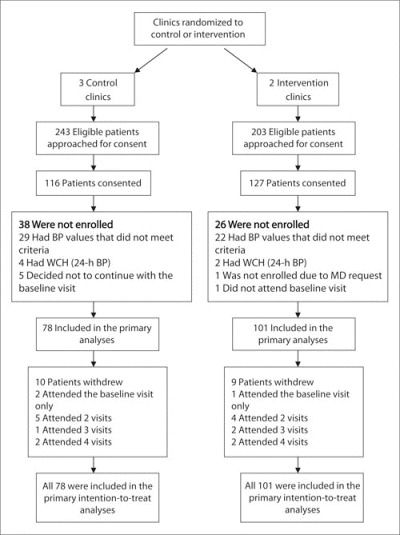
Flow of patients through the study protocol. BP indicates blood pressure; WCH, white‐coat hypertension.
All physicians in the study were on the faculty at the university. Thirty‐two physicians had patients enrolled in the study (15 control, 17 intervention). Eighty percent of physicians at the control sites were internists and 20% were family physicians, while 100% of physicians in the intervention sites were family physicians. The mean age of physicians in control sites was 41.5±6.1 years and was 43.2±9.6 years in the intervention clinics (P=.599). The percentage of female physicians was 40% vs 35.3% (P=.784), and the mean number of years in practice was 13.7±7.3 vs 12.9±8.9 (P=.803) in the control and intervention sites, respectively. These physician demographics are very similar to the demographics for all physicians in these clinics, including those who did not have patients enrolled in the study.
Baseline characteristics of the participants are shown in Table I. The baseline number of antihypertensive medications did not differ between the intervention (1.5±1.0) and control groups (1.4±1.0). There was no difference between the control (76%) and intervention (84%) groups in the percentage of patients who were prescribed medication at baseline (P=.185).
Table I.
Patient Demographics at Baseline
| Control Group (n=78) | Intervention Group (n=101) | |
|---|---|---|
| Sex | ||
| Female | 42 (53.8) | 59 (58.4) |
| Male | 36 (46.2) | 42 (41.6) |
| Race | ||
| Caucasian | 74 (94.9) | 89 (88.1) |
| Non‐Caucasian | 4 (5.1) | 12 (11.9) |
| Age, ya | 61.9 (11.3) | 59.6 (13.7) |
| Married | 52 (66.7) | 59 (58.4) |
| Education beyond high school | 42 (53.9) | 64 (63.4) |
| Household income <$25,000 | 19 (24.7) | 19 (18.8) |
| Insurance status | ||
| Individual or group plan | 65 (83.3) | 89 (88.1) |
| Medicare/Medicaid | 12 (15.4) | 7 (6.9) |
| Self‐pay or other | 1 (1.3) | 5 (5.0) |
| BMI, kg/m2a | 31.8 (14.7) | 32.3 (7.7) |
| >2 Alcoholic drinks/wk | 27 (21.8) | 35 (34.7) |
| Family history of premature CV event | 18 (23.1) | 28 (27.7) |
| Diabetes mellitus | 19 (24.4) | 25 (24.8) |
| History of stroke or TIA | 2 (2.6) | 9 (8.9) |
| History of myocardial infarction | 5 (6.4) | 4 (4.0) |
| Coronary artery bypass grafting | 6 (7.7) | 1 (1.0)b |
| Heart failure | 0 | 2 (2.0) |
| Angina | 0 | 2 (2.0) |
| Peripheral arterial disease | 2 (2.6) | 3 (3.0) |
| Nephropathy | 0 | 1 (1.0)c |
| Left ventricular hypertrophy | 2 (2.6) | 0 |
| ≥1 Coexisting condition | 26 (33.3) | 34 (33.7) |
| No. of coexisting conditionsa | 0.46 (0.78) | 0.47 (0.81) |
| Taking ≥1 antihypertensive agent | 59 (75.6) | 85 (84.2) |
| No. of antihypertensive medicationsa | 1.4 (1.0) | 1.5 (1.0) |
| Baseline medication adherence score, % | 88.6 (20.9) | 71.1 (27.0)d |
| Abbreviations: BMI, body mass index; CV, cardiovascular; TIA, transient ischemic attack. Values are presented as No. (%) unless otherwise noted. aMean (SD). b P=.044, Fisher exact test. cNephropathy was documented in the patient's problem list, and this patient had diabetes. d P<.001, 2‐sample t test. Unless otherwise indicated, groups were not significantly different. | ||
Primary Outcomes
Table II displays the BP results at each prespecified study visit. After adjustment for the covariates, including baseline BP, the mean difference (control group minus the intervention group) in 9‐month SBP was 8.7 mm Hg (95% confidence interval [CI], 4.4–12.9; Figure 2), while the adjusted mean difference in 9‐month DBP was 5.4 mm Hg (CI, 2.8–8.0) (data not shown). The 24‐hour BP effect size was nearly identical, with a mean difference of 8.8 mm Hg (CI, 5.0–12.6) in SBP and 4.6 mm Hg (CI, 2.4–6.8) in DBP.
Table II.
Clinic BP, 24‐hour BP, and BP Control
| Variable Control group (n=78) | Baseline | 2 Mo | 4 Mo | 6 Mo | 8 Mo | 9 Mo |
|---|---|---|---|---|---|---|
| SBP | 150.3±9.0 | 136.6±13.4 | 134.1±15.5 | 131.4±15.4 | 131.4±13.6 | 133.0±14.2 |
| DBP | 85.4±11.0 | 81.3±11.3 | 78.1±10.9 | 77.7±12.0 | 78.9±10.6 | 78.5±10.9 |
| BP control, %a | 0 | 42.1 | 54.9 | 59.4 | 60.9 | 52.9 |
| 24‐Hour average SBP | 136.0±13.3 | — | — | — | — | 131.3±11.8 |
| 24‐Hour average DBP | 76.6±9.9 | — | — | — | — | 73.7±8.0 |
| Intervention group (n=101) | ||||||
| SBP | 153.1±10.0 | 133.8±13.5 | 130.7±14.2 | 126.6±11.9b | 125.5±10.5c | 124.2±9.7d |
| DBP | 84.9±12.0 | 77.6±10.2d | 76.2±9.9c | 76.1±10.3c | 75.6±10.4d | 74.7±9.6d |
| BP control, %a | 0 | 52.0 | 66.7 | 73.4 | 84.3d | 89.1d |
| 24‐Hour average SBP | 135.5±11.3 | — | — | — | — | 121.2±9.9d |
| 24‐Hour average DBP | 76.0±9.8 | — | — | — | — | 69.1±8.6d |
| Abbreviations: BP, blood pressure; DBP, diastolic blood pressure; SBP, systolic blood pressure. aDefined as a BP level <130/80 mm Hg for diabetic patients and <140/90 for nondiabetic patients. P values are based on adjusted between‐group differences: b P<.05; c P<.01; d P<.001. | ||||||
Figure 2.
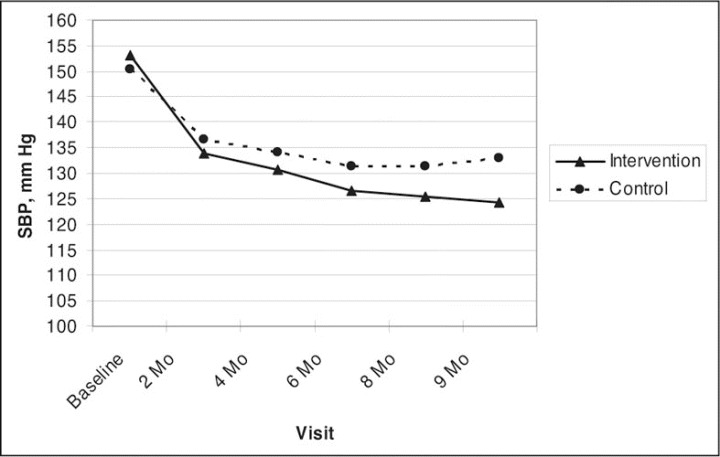
Clinic‐measured systolic blood pressure (SBP) levels by visit.
At 9 months, BP was controlled in 89.1% of patients in the intervention group and 52.9% in the control group (adjusted odds ratio, 8.9; CI, 3.8–20.7; P<.001; Figure 3). BP was controlled at <140/90 mm Hg in 62.8% of nondiabetics in the control group and 91.4% in the intervention group (adjusted odds ratio, 10.2; CI, 3.4–29.9; P<.001). For patients with diabetes, BP was controlled at <130/80 mm Hg in 23.5% of patients in the control group and 81.8% in the intervention group (adjusted odds ratio, 40.1; CI, 4.1–394.7; P=.002). The data demonstrated that for SBP, DBP, BP control, 24‐hour SBP, and 24‐hour DBP, the adjusted between‐group differences were similar to the crude effects (data not shown).
Figure 3.
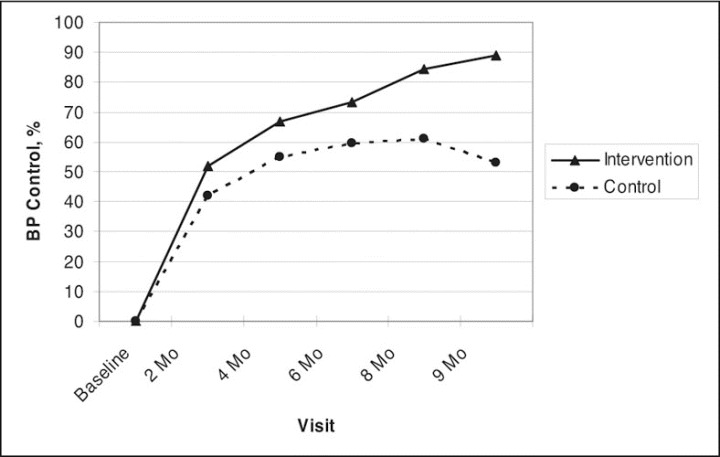
Blood pressure (BP) control based on clinic blood pressure values. Goal BP in patients with uncomplicated hypertension was <140/90 mm Hg, and in patients with diabetes or chronic kidney disease, goal BP was <130/80 mm Hg.
We performed a sensitivity analysis to check the robustness of our findings in the presence of informative dropout. First, we reran our analysis under a scenario that all 19 patients who dropped out had uncontrolled BP at the end of the study and found that the intervention and control BP control rates would be 81.2% and 46.2%, respectively (adjusted odds ratio, 6.1; CI, 2.1–17.7; P<.001). More pessimistically, we considered the scenario in which all dropouts in the intervention group had uncontrolled BP and all dropouts in the control group had controlled BP. In this situation, the respective BP control rates would be 81.2% and 59.0% (adjusted odds ratio, 5.3; CI, 1.9–14.2; P=.001).
Secondary Outcomes
By the end of the study, the mean number of antihypertensive medications was significantly higher (P=.003) in the intervention group (2.4±0.9) compared with the control group (1.9±1.0). At baseline, medication adherence was significantly better in the control group compared with the intervention group (89% vs 71%; P<.001). There was no apparent reason for this baseline difference. By the 9‐month visit, there was no difference in medication adherence (92% in the control group vs 94% in the intervention group; P=.369).
There was no difference in the adverse effect score at baseline (mean, 26.5 in the control group vs 28.8 in the intervention group; P=.397). In spite of the increase in medication use in both groups, adverse effect scores declined at 9 months to 18.3 in the control group (P=.003 vs baseline) and 22.2 in the intervention group (P=.014 vs baseline). There was no difference in adverse effect scores between groups at 9 months (P=.135).
The clinical pharmacists made 267 recommendations (2.6 per patient) to change BP medications, and physicians accepted 256 (95.9%). Of all the drug‐therapy changes (n=256) made by physicians on the recommendations of the pharmacists, the majority were to increase the dose (34%), add another nondiuretic antihypertensive (30%), and add a thiazide diuretic (17%). Other recommendations included switching within class (5%), decreasing a dose (4%), discontinuing a drug (7%), and changing dosing frequency (3%). Most of the recommendations (60%) occurred at or before the 2‐month visit. Physicians in the control group changed medications 100 times (1.28 per patient; P<.001 compared with the intervention group).
The clinical pharmacists made 441 recommendations concerning lifestyle modifications to patients, and most involved increasing activity (45%), reducing weight (27%), or initiating the Dietary Approaches to Stop Hypertension (DASH) diet (22%). Many of these recommendations were multiple suggestions to the same patients at several clinic visits. There were only 17 (4%) recommendations to improve medication adherence, which suggests that nonadherence was rarely a problem. Other than medication adherence, we did not systematically evaluate the degree to which patients changed their exercise level or diet.
DISCUSSION
We found high BP control rates (89%) and mean BP reductions in the intervention group; this confirms reviews that suggest that interdisciplinary management of BP is an effective approach. 15 , 22 A systematic review was conducted for AHRQ that found control rates of 45% to 70% and an SBP difference of approximately 14 mm Hg when using clinical pharmacists to assist with BP management. 15 Our controlled efficacy trial found a BP control rate of 89% and a difference in SBP of 8.7 mm Hg for research‐measured BP and 8.8 mm Hg for 24‐hour BP.
There are several explanations for the good BP results in the control group, especially at 2 months, including that the research nurse reinforced the goal BP, adherence, and lifestyle modifications and provided written material on hypertension, which is known to reduce BP (so education did appear to make some difference). The protocol required that all patients see their physicians at the baseline visit, and this increased surveillance probably caused physicians in the control group to provide medical care once they were alerted to the lack of BP control. There was also the possibility of a Hawthorne effect (due to being observed in a study) and/or regression to the mean. Thus, the control group cannot be considered usual care. Even so, our intervention was still more effective in achieving BP control. The effect in the control group appeared to peak at 6 months and then wane at 9 months. In contrast, BP control rates continued to increase in the intervention group. It is not known whether longer follow‐up would increase the differences between groups or whether the effect in the intervention group might also wane with time.
Controlling BP within 6 months reduces cardiovascular risks. 35 Most of the pharmacists' recommendations were made in the first 2 months, and BP was controlled in 73% of patients at 6 months and in 89% at 9 months. Of importance, BP was controlled to current standards in 81.8% of patients with diabetes. Mean BP began to diverge at the 2‐month visit and became significant at 4 to 6 months; this may have been secondary to the pharmacodynamic delay in antihypertensive response. 36
A recent study provided a clinical pharmacist educational intervention along with unit dose blister packages, both intended to improve medication adherence in patients with hypertension. 16 Following a 6‐month intervention, SBP decreased from 133.2±14.9 mm Hg to 129.9±16.0 mm Hg (P=.02). Patients (N=159) were then randomized to continued clinical pharmacist intervention with unit dose medications or usual care with standard prescription bottles for another 6 months. This prior study did not attempt to intensify medication doses but focused on medication adherence. SBP continued to decline in the intervention group to 124.4±14.0 mm Hg but deteriorated slightly in the usual care group to 133.3±21.5 mm Hg (P=.005). It is not possible, however, to determine whether the improvement was due to the clinical pharmacists, the unit dose packaging, or both. It is interesting that SBP after 12 months was similar to that in our study at 9 months (133.3 vs 133.0 mm Hg in the control group and 124.4 vs 124.2 mm Hg in the intervention group, respectively). Our baseline SBP values were higher (151 vs 134 mm Hg), however, and most of our patients exhibited good medication adherence.
The common strategy to overcome suboptimal therapy or poor guideline adherence has been to provide educational lectures and information on guidelines. These approaches in our study, along with increased surveillance noted above, achieved BP control in 53% of patients with previously uncontrolled BP in our control group. The present study suggests that educational approaches may not be optimal. Our findings suggest that poor BP control was due to suboptimal medication regimens and support our previous cross‐sectional study in the same group of physicians that found no relationship between knowledge and BP control. 17 The majority of recommendations in our study involved adding medications or increasing dosages and doing this early in the intervention. In most cases, decisions were made collaboratively by the physician and pharmacist. Physicians agreed with the pharmacists' recommendations 95% of the time. We did not capture the instances when physicians actually turned care over to the pharmacists; however, because pharmacists in our state cannot prescribe medications independently, any new prescriptions had to at least be signed by the physician.
It may appear that the interventions to change drug therapy were simple, and it might be questioned why physicians did not make these changes on their own. Berlowitz and colleagues 5 found that physicians frequently did not increase medication dosages even though patients continued to have uncontrolled BP in spite of up to 6 physician visits per year. Oliveria and associates 6 found that the primary barrier to BP control was related to physicians who were satisfied with poorly controlled BP. A recent national Harris Interactive survey reported that physicians failed to increase or change medication in almost one‐third of patients in whom BP was not controlled. 37 Garg and colleagues 4 evaluated the causes of resistant hypertension referred to a specialty hypertension clinic. The most common reasons for resistant hypertension were drug‐related causes (61%, including sub‐optimal regimens), patient nonadherence (13%), secondary hypertension (7%), and other (18%). In many of these studies, the addition of or modification of a diuretic dosage led to controlled BP. 38 These findings are consistent with our study, which found that the lack of BP control was primarily due to suboptimal regimens, and diuretics were frequently added. Primary care physicians are required to deal with multiple competing priorities during short office visits. Our intervention was probably effective because pharmacists could focus on achieving therapeutic goals in patients taking medications for hypertension. 39
Of importance, the greater use of antihypertensive drugs in the intervention group did not lead to higher adverse effect scores, which may seem counterintuitive. Other studies have demonstrated increased quality of life and reduced adverse symptoms when BP control is achieved following the use of medications including thiazides. 28 , 40 , 41
Patient nonadherence was a less common cause of poor BP control in our study, which is also consistent with the studies by Garg and coworkers 4 and Oliveria and colleagues. 6 Nevertheless, medication adherence based on pill counts improved from 71% to 94% in the intervention group. It is not known whether this improvement was due to the counseling by the pharmacists, the increased attention in the study, or both. It may also seem unusual that medication adherence was so high at both baseline and at 9 months, especially in the control group. Caro and associates 42 found that medication adherence was 97% after 1 year of follow‐up and 82% after 4.5 years of follow‐up in patients with established hypertension. Our patients and those of Caro and coworkers continued to receive care and are likely to be more adherent than patients who have dropped out of care. In addition, studies have also found that patients taking more medications may adhere at a higher rate, which may possibly be explained by the Health Belief Model. 43
Strengths of the Trial
This study had several strengths, including the use of standardized clinic BP measurements, 31 24‐hour BP monitoring, intention‐to‐treat analyses, and control of numerous covariables. The importance of standardized BP measurements is reflected by the fact that usual office BP measurements are often performed incorrectly. 44 It might be assumed that the data on pharmacist‐assisted BP management were already conclusive. A review of the international literature identified 63 quality‐improvement strategies in hypertension, and 12 involved pharmacy interventions. 15 The authors of these and other studies have suggested that modifying the role of pharmacists to include disease management may improve outcomes of care. 18 , 21 , 45 Studies of pharmacist‐assisted management of hypertension had many limitations, however. Few studies used research nurses to measure BP, 23 and none controlled for baseline covariates or used an intention‐to‐treat analysis. In addition, our study is the first to use 24‐hour BP monitoring. Another strength of this study is that we randomized by clinic, which avoided contamination that would have occurred if we had randomized by patient or by physician. Finally, we studied 5 clinics and used 5 intervention pharmacists, which is more than in nearly all previous studies of physician/pharmacist collaboration in hypertension.
Limitations
While the study was designed to have high internal validity, it does have some limitations. First, we used a cluster design that randomized a small number of clinics. This study, however, used the largest numbers of clinics to date, and our ICCs for clinics and physicians were low and not statistically significant; uneven clinic or physician characteristics did not likely influence these results. Our design was stronger than randomization at the patient level in which physicians would have had patients in both the control and intervention groups, potentially leading to serious contamination. Our design resulted in uneven enrollment between the two groups, but this did not negatively impact either the ICC or the overall results. This efficacy study can only be generalized to clinics that principally utilize faculty physicians. Our design was used to simulate other efficacy clinical trials in hypertension to achieve high internal validity. 31 , 46 It is likely that BP control rates would be different in other practice settings and when patients were not required to attend specific research study visits.
Another limitation is that a cost‐effectiveness analysis was not performed, in part because this efficacy study included prespecified pharmacist visits and attempted to have high fidelity to the intervention. It would be more appropriate to perform a cost‐effectiveness analysis in an effectiveness study in which costs are calculated based on actual practice patterns. While the intervention may be considered unusual or costly, current guidelines for the US Department of Veterans Administration/Department of Defense state: “If BP continues to be elevated, clinicians should consider … management by a pharmacist in the follow‐up and adjustment of medications to improve BP goal.” 47 Future studies of this model should include more clinics with greater geographic, ethnic, and socioeconomic diversity since these populations are likely to respond differently to the intervention. Finally, our study only lasted 9 months, and future studies should determine how long such an intervention is effective.
CONCLUSIONS
An intervention involving physician/pharmacist collaboration that focused on optimizing and intensifying medications was associated with significant reductions in BP and improvements in BP control. This study was the first to include 24‐hour BP monitoring to objectively confirm clinic pressures. These improvements were correlated with increased intensity of medication use, which suggests that the model had an effect to overcome suboptimal medication regimens. The intervention also improved medication adherence in the small number of patients with poor adherence without increasing adverse effects. This study suggests that for clinics or health systems that have clinical pharmacists, their reallocation to provide more direct patient management may significantly improve BP control.
Acknowledgments and disclosures:
The authors acknowledge Alan Zillich, PharmD, Janyce Stewart, RN, and Gail Ardery, PhD (project managers); Karen Kluesner, RN, and Sheryl Eastin, RN (research nurses); Jessica Milchak, PharmD, Michael Ernst, PharmD, Cynthia Weber, PharmD, Jennifer Steffensmeier, PharmD, and Michael Kelly, PharmD (intervention pharmacists); Yinghui Xu, MS (data management); Carrie Franciscus (database development); and Paul James, MD, Christopher Goerdt, MD, and David Katz, MD (data and safety monitoring board). This trial is registered with Clinicaltrials.gov (Identifier: NCT00201045). The findings of this study were presented, in part, at the 22nd Annual Scientific Meeting and Exposition of the American Society of Hypertension, May 19, 2007, Chicago, IL. Funding for this project was supported by the National Heart, Lung, and Blood Institute (HL069801). Dr Carter is also supported by the Center for Research in Implementation in Innovative Strategies in Practice (CRIISP), Department of Veterans Affairs, Veterans Health Administration, Health Services Research and Development Service (HFP 04‐149). The views expressed in this article are those of the authors and do not necessarily reflect the position or policy of the Department of Veterans Affairs.
Editor's Note:
This interesting study illustrates what can be done in clinics or other facilities where nurses and pharmacists are readily available. There is obviously a cost involved in this approach and, in fact, most practitioners do not practice in this type of environment. There is a message, however, that can be taken away from the findings of Dr Carter and colleagues. Medications should be added or changed and/or dosages increased if goal blood pressure levels are not achieved. Some physicians have been reluctant to do this, with the result, as noted in the control group in this trial, that control rates are not as high as they can be.—Marvin Moser, MD, Editor in Chief
References
- 1. European Society of Hypertension‐European Society of Cardiology Guidelines Committee . 2003 European Society of Hypertension‐European Society of Cardiology guidelines for the management of arterial hypertension. J Hypertens. 2003;21(6):1011–1053. [DOI] [PubMed] [Google Scholar]
- 2. World Health Organization . World Health Report 2002–Reducing Risks, Promoting Healthy Life. Geneva, Switzerland: World Health Organization; 2002.http://www.who.int/whr/2002/. Accessed December 26, 2006. [Google Scholar]
- 3. Seventh Report of the Joint National Committee on Prevention, Detection, Evaluation, and Treatment of High Blood Pressure. Hypertension. 2003;42(6):1206–1252. [DOI] [PubMed] [Google Scholar]
- 4. Garg JP, Elliott WJ, Folker A, et al. Resistant hypertension revisited: a comparison of two university‐based cohorts. Am J Hypertens. 2005;18(5, pt 1):619–626. [DOI] [PubMed] [Google Scholar]
- 5. Berlowitz DR, Ash AS, Hickey EC, et al. Inadequate management of blood pressure in a hypertensive population. N Engl J Med. 1998;339(27):1957–1963. [DOI] [PubMed] [Google Scholar]
- 6. Oliveria SA, Lapuerta P, McCarthy BD, et al. Physician‐related barriers to the effective management of uncontrolled hypertension. Arch Intern Med. 2002;162(4):413–420. [DOI] [PubMed] [Google Scholar]
- 7. Hyman DJ, Pavlik VN. Characteristics of patients with uncontrolled hypertension in the United States. N Engl J Med. 2001;345(7):479–486. [DOI] [PubMed] [Google Scholar]
- 8. Milchak JL, Carter BL, James PA, et al. Measuring adherence to practice guidelines for the management of hypertension: an evaluation of the literature. Hypertension. 2004;44(5):602–608. [DOI] [PMC free article] [PubMed] [Google Scholar]
- 9. Carter BL, Malone DC, Ellis SL, et al. Antihypertensive drug utilization in hypertensive veterans with complex medication profiles. J Clin Hypertens (Greenwich). 2000;2(3):172–180. [PubMed] [Google Scholar]
- 10. Hill MN, Levine DM, Whelton PK. Awareness, use, and impact of the 1984 Joint National Committee consensus report on high blood pressure. Am J Public Health. 1988;78(9):1190–1194. [DOI] [PMC free article] [PubMed] [Google Scholar]
- 11. Naiman DJ, Barker LR. Adherence to the JNC VI guidelines for the treatment of hypertension in the resident clinic. Md Med J. 1999;48(6):307–311. [PubMed] [Google Scholar]
- 12. Nelson CR, Knapp DA. Trends in antihypertensive drug therapy of ambulatory patients by US office‐based physicians. Hypertension. 2000;36(4):600–603. [DOI] [PubMed] [Google Scholar]
- 13. Ong KL, Cheung BM, Man YB, et al. Prevalence, awareness, treatment, and control of hypertension among United States adults 1999–2004. Hypertension. 2007;49(1):69–75. [DOI] [PubMed] [Google Scholar]
- 14. Goldstein MK, Lavori P, Coleman R, et al. Improving adherence to guidelines for hypertension drug prescribing: cluster‐randomized controlled trial of general versus patient‐specific recommendations. Am J Manag Care. 2005;11(11):677–685. [PubMed] [Google Scholar]
- 15. Walsh JM, McDonald KM, Shojania KG, et al. Quality improvement strategies for hypertension management: a systematic review. Med Care. 2006;44(7):646–657. [DOI] [PubMed] [Google Scholar]
- 16. Lee JK, Grace KA, Taylor AJ. Effect of a pharmacy care program on medication adherence and persistence, blood pressure, and low‐density lipoprotein cholesterol: a randomized controlled trial. JAMA. 2006;296(21):2563–2571. [DOI] [PubMed] [Google Scholar]
- 17. Carter BL, Hartz A, Bergus G, et al. Relationship between physician knowledge of hypertension and blood pressure control. J Clin Hypertens (Greenwich). 2006;8(7):481–486. [DOI] [PMC free article] [PubMed] [Google Scholar]
- 18. Grol R, Grimshaw J. From best evidence to best practice: effective implementation of change in patients' care. Lancet. 2003;362(9391):1225–1230. [DOI] [PubMed] [Google Scholar]
- 19. Battersby MW. Health reform through coordinated care: SA HealthPlus. BMJ. 2005;330(7492):662–665. [DOI] [PMC free article] [PubMed] [Google Scholar]
- 20. Wilson T, Buck D, Ham C. Rising to the challenge: will the NHS support people with long term conditions? BMJ. 2005;330(7492):657–661. [DOI] [PMC free article] [PubMed] [Google Scholar]
- 21. Avery AJ, Pringle M. Extended prescribing by UK nurses and pharmacists. BMJ. 2005;331(7526):1154–1155. [DOI] [PMC free article] [PubMed] [Google Scholar]
- 22. Carter BL, Zillich AJ, Elliott WJ. How pharmacists can assist physicians with controlling blood pressure. J Clin Hypertens (Greenwich). 2003;5(1):31–37. [DOI] [PMC free article] [PubMed] [Google Scholar]
- 23. Bogden PE, Abbott RD, Williamson P, et al. Comparing standard care with a physician and pharmacist team approach for uncontrolled hypertension. J Gen Intern Med. 1998;13(11):740–745. [DOI] [PMC free article] [PubMed] [Google Scholar]
- 24. Bond CA, Monson R. Sustained improvement in drug documentation, compliance, and disease control. A four‐year analysis of an ambulatory care model. Arch Intern Med. 1984;144(6):1159–1162. [PubMed] [Google Scholar]
- 25. Borenstein JE, Graber G, Saltiel E, et al. Physician‐pharmacist comanagement of hypertension: a randomized, comparative trial. Pharmacotherapy. 2003;23(2):209–216. [DOI] [PubMed] [Google Scholar]
- 26. Bogden PE, Koontz LM, Williamson P, et al. The physician and pharmacist team. An effective approach to cholesterol reduction. J Gen Intern Med. 1997;12(3):158–164. [DOI] [PMC free article] [PubMed] [Google Scholar]
- 27. Carter BL, Barnette DJ, Chrischilles E, et al. Evaluation of hypertensive patients after care provided by community pharmacists in a rural setting. Pharmacotherapy. 1997;17(6):1274–1285. [PubMed] [Google Scholar]
- 28. Erickson SR, Slaughter R, Halapy H. Pharmacists' ability to influence outcomes of hypertension therapy. Pharmacotherapy. 1997;17(1):140–147. [PubMed] [Google Scholar]
- 29. Hawkins DW, Fiedler FP, Douglas HL, et al. Evaluation of a clinical pharmacist in caring for hypertensive and diabetic patients. Am J Hosp Pharm. 1979;36(10):1321–1325. [PubMed] [Google Scholar]
- 30. Kaboli PJ, Hoth A, Carter BL, et al. The VA Enhanced Pharmacy Outpatient Clinic (EPOC) Study: a randomized‐controlled pharmacist‐physician intervention trial [abstract]. J Gen Intern Med. 2004;19(suppl 1):227. [Google Scholar]
- 31. Wright JT Jr, Bakris G, Greene T, et al. Effect of blood pressure lowering and antihypertensive drug class on progression of hypertensive kidney disease: results from the AASK trial. JAMA. 2002;288(19):2421–2431. [DOI] [PubMed] [Google Scholar]
- 32. Pickering TG, Hall JE, Appel LJ, et al. Recommendations for blood pressure measurement in humans and experimental animals: part 1: blood pressure measurement in humans: a statement for professionals from the Subcommittee of Professional and Public Education of the American Heart Association Council on High Blood Pressure Research. Hypertension. 2005;45(1):142–161. [DOI] [PubMed] [Google Scholar]
- 33. O'Brien E, Coats A, Owens P, et al. Use and interpretation of ambulatory blood pressure monitoring: recommendations of the British hypertension society. BMJ. 2000;320(7242):1128–1134. [DOI] [PMC free article] [PubMed] [Google Scholar]
- 34. Farris KB, Cote I, Feeny D, et al. Enhancing primary care for complex patients. Demonstration project using multidisciplinary teams. Can Fam Physician. 2004;50:998–1003. [PMC free article] [PubMed] [Google Scholar]
- 35. Julius S, Kjeldsen SE, Weber M, et al. Outcomes in hypertensive patients at high cardiovascular risk treated with regimens based on valsartan or amlodipine: the VALUE randomised trial. Lancet. 2004;363(9426):2022–2031. [DOI] [PubMed] [Google Scholar]
- 36. Carter BL, Frohlich ED, Elliott WJ, et al. Selected factors that influence responses to antihypertensives. Choosing therapy for the uncomplicated patient. Arch Fam Med. 1994;3(6):528–536. [DOI] [PubMed] [Google Scholar]
- 37. Moser M, Franklin SS. Hypertension management: results of a new national survey for the hypertension education foundation: Harris interactive. J Clin Hypertens (Greenwich). 2007;9(5):316–323. [DOI] [PMC free article] [PubMed] [Google Scholar]
- 38. Moser M, Setaro JF. Clinical practice. Resistant or difficult‐to‐control hypertension. N Engl J Med. 2006;355(4):385–392. [DOI] [PubMed] [Google Scholar]
- 39. Singer GM, Izhar M, Black HR. Goal‐oriented hypertension management: translating clinical trials to practice. Hypertension. 2002;40(4):464–469. [DOI] [PubMed] [Google Scholar]
- 40. Neaton JD, Grimm RH Jr, Prineas RJ, et al. Treatment of Mild Hypertension Study. Final results. Treatment of Mild Hypertension Study Research Group . JAMA. 1993;270(6):713–724. [PubMed] [Google Scholar]
- 41. Materson BJ, Reda DJ, Cushman WC, et al. Single‐drug therapy for hypertension in men. A comparison of six antihypertensive agents with placebo. The Department of Veterans Affairs Cooperative Study Group on Antihypertensive Agents . N Engl J Med. 1993;328(13):914–921. [DOI] [PubMed] [Google Scholar]
- 42. Caro JJ, Salas M, Speckman JL, et al. Persistence with treatment for hypertension in actual practice. CMAJ. 1999;160(1):31–37. [PMC free article] [PubMed] [Google Scholar]
- 43. Billups SJ, Malone DC, Carter BL. The relationship between drug therapy noncompliance and patient characteristics, health‐related quality of life, and health care costs. Pharmacotherapy. 2000;20(8):941–949. [DOI] [PubMed] [Google Scholar]
- 44. Villegas I, Arias IC, Botero A, et al. Evaluation of the technique used by health‐care workers for taking blood pressure. Hypertension. 1995;26(6, pt 2):1204–1206. [DOI] [PubMed] [Google Scholar]
- 45. Rothman R, Weinberger M. The role of pharmacists in clinical care: where do we go from here? Eff Clin Pract. 2002;5(2):91–94. [PubMed] [Google Scholar]
- 46. The ALLHAT Officers and Coordinators for the ALLHAT Collaborative Research Group . Major outcomes in high‐risk hypertensive patients randomized to angiotensin‐converting enzyme inhibitor or calcium channel blocker vs diuretic: the Antihypertensive and Lipid‐Lowering Treatment to Prevent Heart Attack Trial (ALLHAT). JAMA. 2002;288(23):2981–2997. [DOI] [PubMed] [Google Scholar]
- 47. VA/DoD Clinical Practice Guideline for Diagnosis and Management of Hypertension in the Primary Care Setting. Washington, DC: Department of Veterans Administration, Department of Defense; 2004. Revised July 2005. [Google Scholar]