

Abstract
A deficit in IL-4 production has been previously reported in both diabetic human patients and non-obese diabetic (NOD) mice. In addition, re-introducing IL-4 into NOD mice systemically, or as a transgene, led to a beneficial outcome in most studies. Here, we show that prediabetic, 12-wk old female NOD mice have a deficit in IL-4 expression in the pancreatic lymph nodes (PLN) compared to age-matched diabetes-resistant NOD.B10 mice. By bioluminescence imaging, we demonstrated that the PLN was preferentially targeted by bone marrow-derived dendritic cells (DCs) following intravenous (IV) administration. Following IV injection of DCs transduced to express IL-4 (DC/IL-4) into 12-wk old NOD mice, it was possible to significantly delay or prevent the onset of hyperglycemia. We then focused on the PLN to monitor, by microarray analysis, changes in gene expression induced by DC/IL-4 and observed a rapid normalization of the expression of many genes, that were otherwise under-expressed compared to NOD.B10 PLN. The protective effect of DC/IL-4 required both MHC and IL-4 expression by the DCs. Thus, adoptive cellular therapy, using DCs modified to express IL-4, offers an effective, tissue-targeted cellular therapy to prevent diabetes in NOD mice at an advanced stage of pre-diabetes, and may offer a safe approach to consider for treatment of high risk human pre-diabetic patients.
Introduction
Type 1 diabetes (T1D) is caused by a T cell-mediated autoimmune destruction of insulin-producing β cells in the pancreatic islets. In the non-obese diabetic (NOD) mouse model of T1D, peri-insulitic infiltration can be detected as early as 2–3 wks after birth, and remains in a ‘passive’ state until about 12 wks of age, when overt destruction of β cells begins. By 30 wks of age, > 80% of female NOD mice have developed overt diabetes (hyperglycemia) in our colony. The mechanisms underlying the abrupt switch from passive to destructive insulitis remain poorly understood.
The NOD model has been widely used to test many therapeutic regimens, the majority of which have been reviewed [1]. Although many of these treatments had a successful outcome in young NOD mice (treated before 8 wks of age), fewer were tested or found to demonstrate efficacy in older NOD mice with advanced insulitis or hyperglycemia. Currently, human patients with a high risk of developing diabetes can be identified more efficiently and earlier than in the past, however, most accurate predictions or diagnoses occur during a relatively advanced stage of disease, in which β cell destruction is well under way [2]. Thus, more attention should be focused on therapeutic initiatives in older NOD mice with advanced insulitis or overt hyperglycemia to mimic therapeutic opportunities in man [3]. Successful therapies of T1D should (i) counteract the mechanisms initiating β cell destruction or block ongoing β cell destruction, (ii) restore immune tolerance, (iii) be targeted to a tissue (or antigen) of relevance [4], (iv) be effective in individuals with imminent or overt disease, and if possible (v) stimulate or allow β cell regeneration.
The potential role of IL-4 in NOD disease has been documented in several studies. IL-4 may be important in the maintenance of a protective Th2 response [5], but it has also been implicated in the stimulation of a broader T cell repertoire composed of non-pathogenic cells [6] and in differential expression of B7.1 and B7.2 molecules by DCs, affecting the quality of CTL responses [7]. Systemic administration of IL-4 appeared to alleviate a form of unresponsiveness among NOD thymocytes and peripheral T cells, which correlated with disease protection [8]. Finally, IL-4 may participate in the induction de novo of peripheral Foxp3+ regulatory T cells [9]. NKT cells are a source of IL-4 and were shown to play a beneficial role in T1D [10–13]. A deficiency of IL-4 production by NKT cell has been reported in murine models of T1D [14, 15] and in human T1D patients [16, 17]. A defect in IL-4 production was also observed in PBMCs of T1D patients [18–20]. Islet-infiltrating T cells from male NOD mice, unlike those from their female counterparts, can sustain IL-4 production following activation, which may help explain the relative resistance of male NOD mice to the disease [21].
While some T1D research is directed toward enhancement of NKT cell function, other researchers have focused their attention on ways to provide protective levels of IL-4 by various means. Systemic IL-4 administration, via regular intraperitoneal injections [5, 8, 22], gene gun- or carrier- mediated DNA delivery [23, 24] or IL-4-encoding adenoviral vectors [25], prevented T1D when NOD mice were treated at a young age (up to 7 weeks). At the level of cellular gene therapy, IL-4-expressing transduced T cells [26, 27] or dendritic cells (DCs) [28] have been used with some success. Unlike antigen-specific and/or regulatory T cells, autologous DCs are easy to generate and have been safely used in numerous human clinical trials for therapeutic vaccination against cancer [29] and chronic viral infections [30]. Because of their ability to migrate to selective tissues and lymph nodes to regulate immune responses, DCs represent an attractive cellular candidate to be used in adoptive cellular therapy of autoimmune diseases. In the NOD model, DCs have been used to induce tolerance [31] or deliver immunoregulatory products such as IL-4 [28] and galectin-1 [32] as transgenes.
In this report, we demonstrate a relative defect in Il4 gene expression in pancreatic lymph node (PLN) cells of 12-wk old prediabetic NOD mice, and by modifying bone marrow-derived DCs by lentiviral transduction to express IL-4 (DC/IL-4), explored their potential to restore IL-4 expression in the PLN, and prevent or delay disease progression. We observed that transduced DCs preferentially homed to the PLN after intravenous (IV) injection. Following a single injection of DC/IL-4, the onset of disease was delayed and long-term protection was conferred to the majority of treated mice, while the control DC/GFP had little effect. In addition to correcting the deficiency in IL-4 expression in the PLN, IV treatment with DC/IL-4 also normalized the expression of the great majority of genes that were over- or under-expressed in the PLN of 12-wk old NOD mice, compared to disease-free NOD.B10 PLN. The observed protection against T1D induced by DC/IL-4 required concomitant expression of MHC molecules on the therapeutic DCs, suggesting a possible role for cognate interaction between IL-4-expressing DCs and PLN-resident T cells.
Materials and methods
Mice
Female NOD, NOD.B10 (NOD.B10Sn-H2b/J) and MHC−/− NOD (NOD.129(B6)-B2mtm1UncC2tatm1Ccum/BhsJ) mice were purchased from the Jackson Laboratories, and kept or bred in our animal facility under SPF conditions. Bone marrow donors for the generation of DCs were 8–10 wks old, while recipient mice were used at 12 wks of age, unless otherwise specified. All manipulations were approved by the Stanford Administrative Panel on Laboratory Animal Care.
Quantitative real-time PCR
PLN was extracted from 12-wk old NOD and NOD.B10 mice, homogenized in 0.5 ml TRIzol reagent (Sigma) and frozen at −80ºC until analysis. After addition of 100 μl chloroform, samples were centrifuged for 10 min at 8000 rpm. The aqueous phase was mixed with an equal volume of 70% ethanol and applied to an RNeasy Mini column (Qiagen). Total RNA isolation was then conducted according to the manufacturer’s instructions. 1 μg RNA was used as template to generate cDNA using QuantiTect Reverse Transcription kit (Qiagen). Real-time PCR was done using QuantiTect SYBR Green PCR kit (Qiagen) on an Mx4000 device (Stratagene). Primers used for RT-PCR were CAGGCATTGCTGACAGGATGCA (Beta-actin forward), GGCCAGGATGGAGCCACCGATC (Beta-actin reverse), AGCCATATCCACGGATGCGACAAA (IL-4 forward), AATATGCGAAGCACCTTGGAAGCC (IL-4 reverse), GGCCATCAGCAACAACATAAGCGT (IFN-γ forward) and TGGGTTGTTGACCTCAAACTTGGC (IFN-γ reverse).
Lentivirus generation
The lentiviral vector pHR-IG was made by Dr Yoshitaka Akagi in our lab by replacement of eGFP in pHR-G (pHR’tripCMV-GFP-SIN) [33] by IRES-eGFP from pIRES2-eGFP (Promega). The IL-4 gene was cloned upstream of the IRES to generate pHR-IL4IG. pHR2 was made by replacement of eGFP in pHR-G by a multiple cloning site. The GFP-firefly luciferase fusion (GLF) gene was subcloned from pJW.GFP-yLuc (kindly provided by Dr MH Bachmann) into pHR2 to generate pHR2-GLF. Lentiviral particles expressing GFP, IL-4/GFP or GLF were prepared as described before [33]. Briefly, 293T cells plated in 175 cm2 flasks, and the next day, near-confluent cells were co-transfected with 45 μg lentiviral vector together with packaging and VSV-G-expressing vectors (3:2:1 ratio) in presence of 25 μM chloroquine (Sigma). The medium was changed after 8–12 hours, and then harvested after 24–36 hours. Supernatant was filtered through 0.45 micron PES filter and ultracentrifuged for 2 hours 20 min at 19,500 rpm at 4ºC. Pelleted virus was resuspended in plain IMDM medium (Invitrogen) and frozen at −80ºC. The titer was determined by infection of 293T cells with several dilutions of the virus and analysis of GFP+ cells by flow cytometry 36 hours later.
Dendritic cell culture, transduction and treatment
Bone marrow was harvested from the femurs and tibias of female mice. The bone marrow cells were depleted of CD3+, B220+ and Gr-1+ cells on AutoMACS (Miltenyi) using biotinylated antibodies (eBioscience) and anti-biotin microbeads (Miltenyi), and then cultured in complete RPMI medium (10% FCS, 2mM L-glutamine, 100 U/ml penicillin, 100 μg/ml streptomycin, 0.1 mM non-essential amino acids, 1 mM sodium pyruvate, 14.3 μM β-mercaptoethanol) in presence of recombinant mouse GM-CSF and IL-4 (Peprotech) at 10 ng/ml each. On day 4, cells were infected with lentiviral particles (MOI=15) in presence of 10 μg/ml protamine sulfate (Sigma). After 16–24 hours incubation with virus, the medium was changed. DCs were collected on day 6 and analyzed on LSR flow cytometer (conjugated antibodies against CD11b, CD11c and I-Ak (also stains I-Ag7) were from BD Pharmingen: those against CD40, CD80 and CD86 were from Caltag). For the treatment experiments, DC/GFP cells were diluted with untransduced DCs so that both DC/GFP and DC/IL-4 have the same percentage of GFP+ cells. Ultimately, 5–7.5x10⁵ GFP+ cells in 0.2 ml PBS were injected into the lateral tail vein of 12-wk old non-diabetic NOD mice. Other control mice were injected with 0.2 ml PBS. Different treatments were randomly applied to mice within the same cage. The blood glucose was measured weekly and animals with levels > 250 mg/dl over two consecutive bleedings were considered diabetic.
ELISA
Some of the DCs harvested on day 6 were washed and re-plated at different numbers in complete RPMI without GM-CSF or IL-4. Supernatant was collected 36 hours later and frozen. ELISA was performed using standard protocol and reagents from BD Pharmingen (anti-IL-4 capture and detection antibodies), Peprotech (IL-4 standard) and Sigma (ExtrAvidin peroxidase and TMB substrate).
In vivo and ex vivo bioluminescence imaging
NOD mice were injected IV with 0.5–1x10⁶ GLF-transduced GFP+ DCs (average luciferase activity up to 800 RLU/cell) and imaged several times between 24h and 8 days. At each time point, all mice were injected intraperitoneally with D-Luciferin (3 mg/mouse, Biosynth), anesthetized for 10 min with isoflurane and imaged for 5 min using the IVIS-100 system (Caliper LifeSciences). Then, several mice (n=3/group) were sacrificed, and various tissues were harvested, weighted, homogenized in PBS (liver and pancreas in PBS containing protease inhibitor cocktail III, Calbiochem), and finally frozen at −80ºC. The tissue samples were further subjected to 3 freeze-thaw cycles, and were centrifuged for 10 min. Supernatant was collected and its volume measured. Firefly luciferase (Fluc) activity in 10 μl supernatant was measured on luminometer (Turner Biosystems, Model 2030-001) immediately after addition of reconstituted LAR2 reagent (Promega). The total Fluc activity was extrapolated to the total volume of supernatant recovered, and then was normalized by dividing it by the tissue weight.
Microarray analysis
Microarray data on the expression of PLN genes from (untreated) 12-wk old NOD mice (n=7), relative to NOD.B10 control were extracted from the Roadmap study (Kodama et al., manuscript submitted; and raw data available on http://fathmanlab.stanford.edu/downloads.html). PLN from DC/IL-4-treated 12-wk old NOD mice (n=9, from two independent experiments) were harvested 3 days after IV injection and processed the same way as the samples used in the Roadmap study. Briefly, tissues were homogenized in TRIzol and total RNA was isolated as described in the “Quantitative real-time PCR” section above. cRNA amplification and fluorescence labeling (cyanine 3 for NOD and cyanine 5 for NOD.B10) was performed using the Agilent Low RNA Input Fluorescent Linear Amplification Kit (Agilent Technologies). Both were combined and hybridized onto the Agilent 41K whole mouse genome (60-mer) oligo microarray slide. Log10 (NOD processed signal /NOD.B10 processed signal) were obtained using the Agilent Feature Extraction software version 8.5 and used for data analysis.
Results
IL-4 gene expression becomes deficient over time in the PLN of NOD mice
A temporal analysis of gene expression in various NOD tissues including PLN, was carried out by our group (Kodama et al., manuscript submitted). In this study, the gene expression in PLN, spleen and peripheral blood cells (PBCs), taken from female NOD mice at different ages, was directly compared by microarray analysis to a tissue-matched pooled sample from non-diabetic MHC-congenic female NOD.B10 mice, derived from 3-wk and 20-wk old animals. In the PLN of NOD mice, we observed a consistent decrease in Il4 gene expression over time, evident at 12 wks of age and thereafter (Kodama et al., manuscript submitted). The consistency of this drop was significant by the Bartholomew trend test (p=0.032), whereas changes in Il4 expression in the spleen or PBCs did not reflect a significant trend (data not shown). To validate this observation, we performed real-time PCR to assess the relative Il4 expression in total PLN from 12-wk old NOD and NOD.B10 mice (samples independent from those used in the Kodama study). The expression of Il4 in the PLN was significantly lower in NOD compared to NOD.B10 (p=0.02) at 12 wks of age (Fig. 1).
Figure 1.
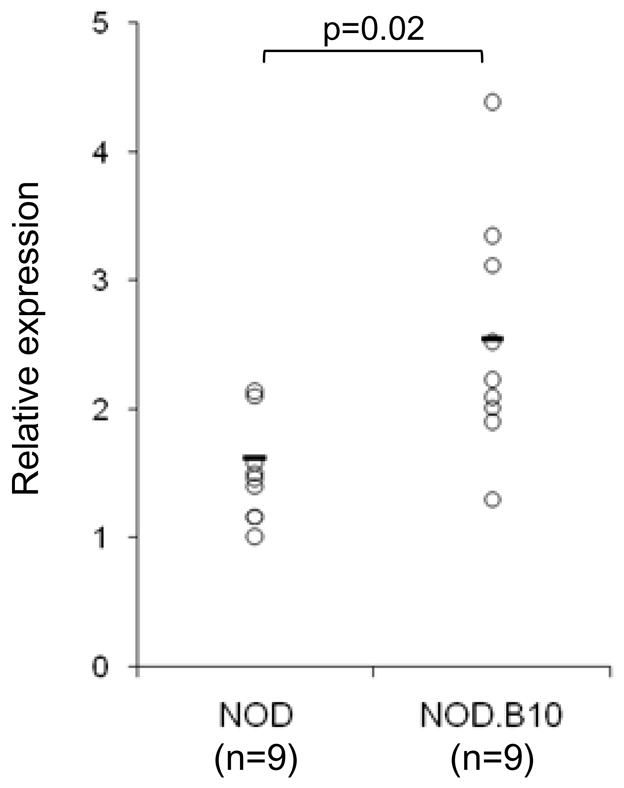
IL-4 deficiency in the PLN of 12-wk old NOD mice. IL-4 expression in the PLN of 12-wk old euglycemic NOD (n=9) and NOD.B10 (n=9) was determined by RT-PCR. The expression was normalized to β actin. Individual values and mean are shown and T-test was applied for statistical analysis.
Characterization of DCs used for adoptive cellular gene therapy
Using the protocol described in the method section, a high purity of DC (over 90%) was achieved at the end of a 6-day culture, without the need for further purification (Fig. 2A). These culture-expanded DCs were of the myeloid type (CD11c+ CD11b+) and did not express CD4 or CD8 (data not shown). Infection with lentiviral particles, performed on day 4 of culture, typically resulted in 70–80% transduction efficiency with GFP (data not shown), 40–60% with IL-4-IRES-GFP and 30–40% with the GFP-luciferase fusion vector (Fig. 2B, top left histogram). Furthermore, lentiviral transduction resulted in increased levels of CD11c (Fig. 2B, middle left histogram; MFI = 1399, 2967 and 2926 for DC/Unt, DC/GLF and DC/IL-4, respectively), and to a very limited extent, of the maturation markers CD40, CD80 and CD86 (Fig. 2B, right histograms), but had little effect on class II MHC expression (Fig. 2B, bottom left histogram). GFP-only transduced DCs did not secrete detectable IL-4 within 36 hours of re-culture in cytokine-free medium, while IL-4 was secreted by DC/IL-4 in an amount linearly proportional to the number of transduced cells (Fig. 2C).
Figure 2.
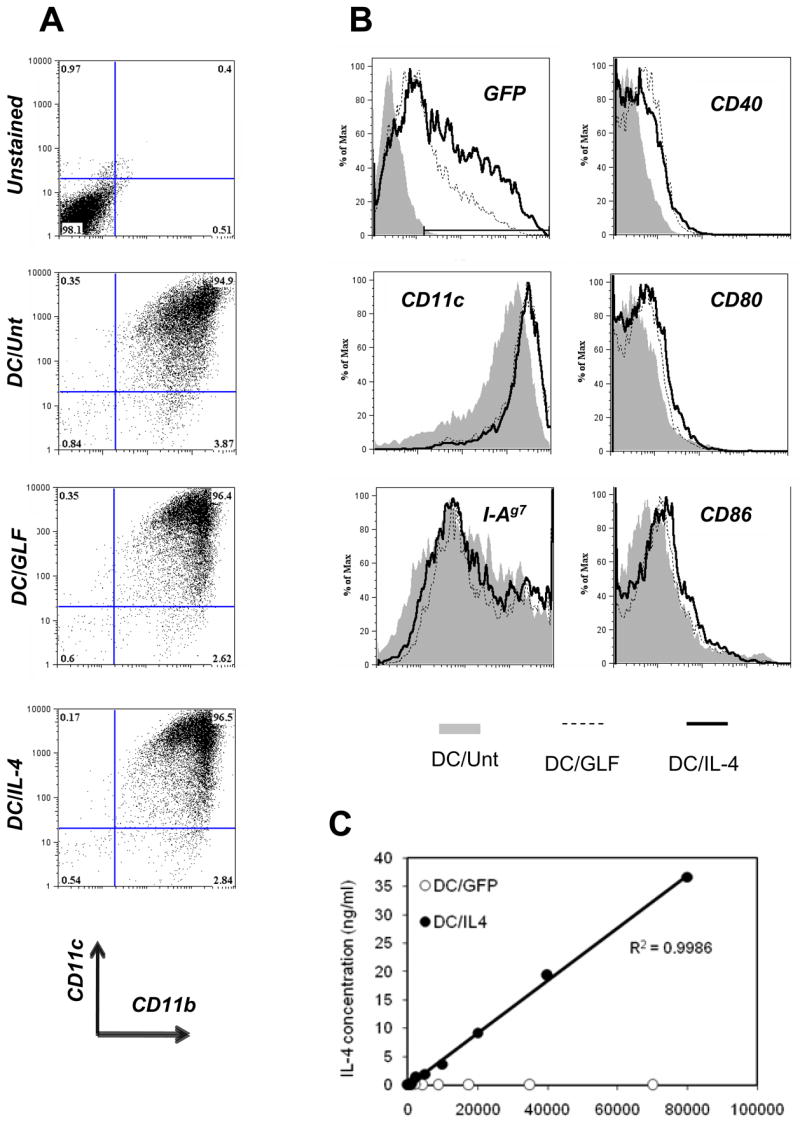
Characterization of DCs used for adoptive cellular gene therapy. Untransduced DCs (DC/Unt) and transduced DCs (DC/GLF and DC/IL-4) were analyzed by flow cytometry. Plots were all gated on live DCs based on FSc and PI profile. (A) Purity was determined based on CD11c and CD11b expression. (B) Transduction efficiency was assessed by GFP expression on live DCs. Surface marker levels (CD11c, CD40, CD80, CD86 and class II MHC I-Ag7) were analyzed on total live DCs for DC/Unt (grey-filled histograms), or on the GFP+ live DC fraction for DC/GLF (dashed line) and DC/IL-4 (thick line). (C) After harvest on day 6, transduced DCs (DC/GFP and DC/IL-4) were re-plated at various cell numbers in cytokine-free medium for another 36h, after which supernatant was collected and used for ELISA (one of two representative experiments shown).
IL-4-secreting dendritic cells delay disease onset and confer significant protection
12 wk-old prediabetic female NOD mice received a single IV injection of PBS, DC/GFP or DC/IL-4. The blood glucose level of treated mice was measured weekly and the percentage of diabetic mice over time is shown in Fig. 3. By 30 wks of age, 80% of control (PBS-injected) mice developed diabetes. In contrast, only 30% of the mice treated with DC/IL-4 had become diabetic by 35 wks of age, with an onset of disease delayed by 4–8 wks. The protection conferred by DC/IL-4 was highly significant compared to PBS controls (p=0.000002, Log rank test). Treatment with DC/GFP had only a limited protective effect, which was not significant compared to PBS controls (p=0.18, Log rank test).
Figure 3.
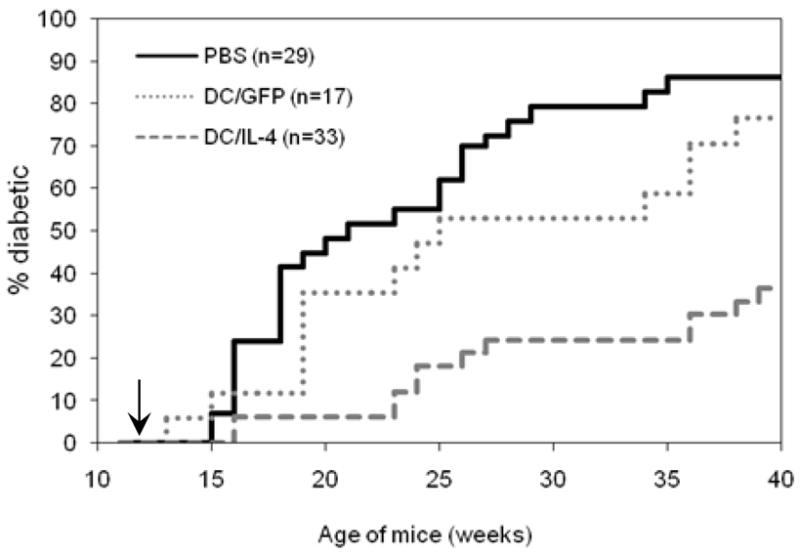
Incidence of diabetes after IV treatment of 12-wk old prediabetic female NOD mice with PBS, DC/GFP or DC/IL-4. Combined results from 3 similar, independent experiments (5–7.5x10⁵ GFP+ DCs/mouse) are shown. Statistical analysis: PBS vs DC/IL-4, p=2x10⁻⁶ by Log Rank and 5x10⁻⁶ by Wilcoxon; PBS vs DC/GFP, p=0.18 by Log Rank and Wilcoxon; DC/GFP vs DC/IL-4, p=0.002 by Log Rank and Wilcoxon.
Dendritic cells preferentially home to the pancreatic lymph nodes
Several investigators have previously reported the presence of transduced DCs in the PLN following IV injection [28, 32]. However, the relative homing specificity to PLN compared to other lymph nodes and tissues was not addressed. Because homing specificity is an important component of targeted cellular therapies, we conducted a more systematic analysis of DC homing to various tissues to identify potential sites of therapeutic effect. To track the anatomical location of the injected DCs, we transduced DCs with a lentiviral vector carrying a GFP/firefly luciferase fusion gene (GLF) and intravenously injected 0.5–1x10⁶ GFP+ DCs (Luc+ DCs). Recipient mice were monitored by bioluminescence imaging several days after injection, and 3 mice per group were sacrificed at each time point for biodistribution analysis. Representative images of bioluminescence activity in vivo, at 24h and 72h after DC/GLF injection, are shown in Fig. 4A. The biodistribution of Luc+ DCs was confirmed by measuring luciferase activity in homogenized tissues. The total signal (Relative Light Units, or RLU) in various tissues, as well as the normalized bioluminescence activity (RLU/mg of tissue) are shown in Fig. 4B and Fig. 4C respectively. High signal was detected 24h after IV injection in the well-vascularized tissues such as lungs, liver and spleen, but not in kidneys. In lungs and liver, luciferase expression was transient and disappeared by day 3. In contrast, the signal in the spleen and PLN was detected above background for up to a week (Fig. 4 and data not shown). Interestingly, no or very little signal was measured in mesenteric (MLN), inguinal (ILN), lumbar (LLN) lymph nodes (Fig. 4B,C), or in renal, brachial and cervical LNs (data not shown). Other than PLN, only lung-draining lymph nodes had a strong signal, whose intensity correlated with that of the lungs, but persisted longer (data not shown). We then tested whether inflammation in the pancreas of NOD mice accounted for the preferential homing of the DCs to PLN. DCs from NOD.B10 mice, which do not develop insulitis and related inflammation, were also transduced with GLF and injected into 12-wk old NOD.B10 mice. Again, a strong normalized luminescent signal was seen in the spleen and PLN, but not in the MLN, ILN and LLN (Fig. 4D). We also used L2G85 mice (expressing luciferase as a transgene, [34]) bred in several genetic backgrounds (FVB, NOD, NOD.B10 and BALB/c) to generate DCs and track their homing in mice of their respective background. Selective homing to PLN was observed in all these strains (Creusot et al., manuscript in preparation), suggesting that this phenomenon is general and not related to inflammation in the pancreas or the fact that DCs were lentivirally transduced. Migration to the thymus was never observed in these experiments.
Figure 4.
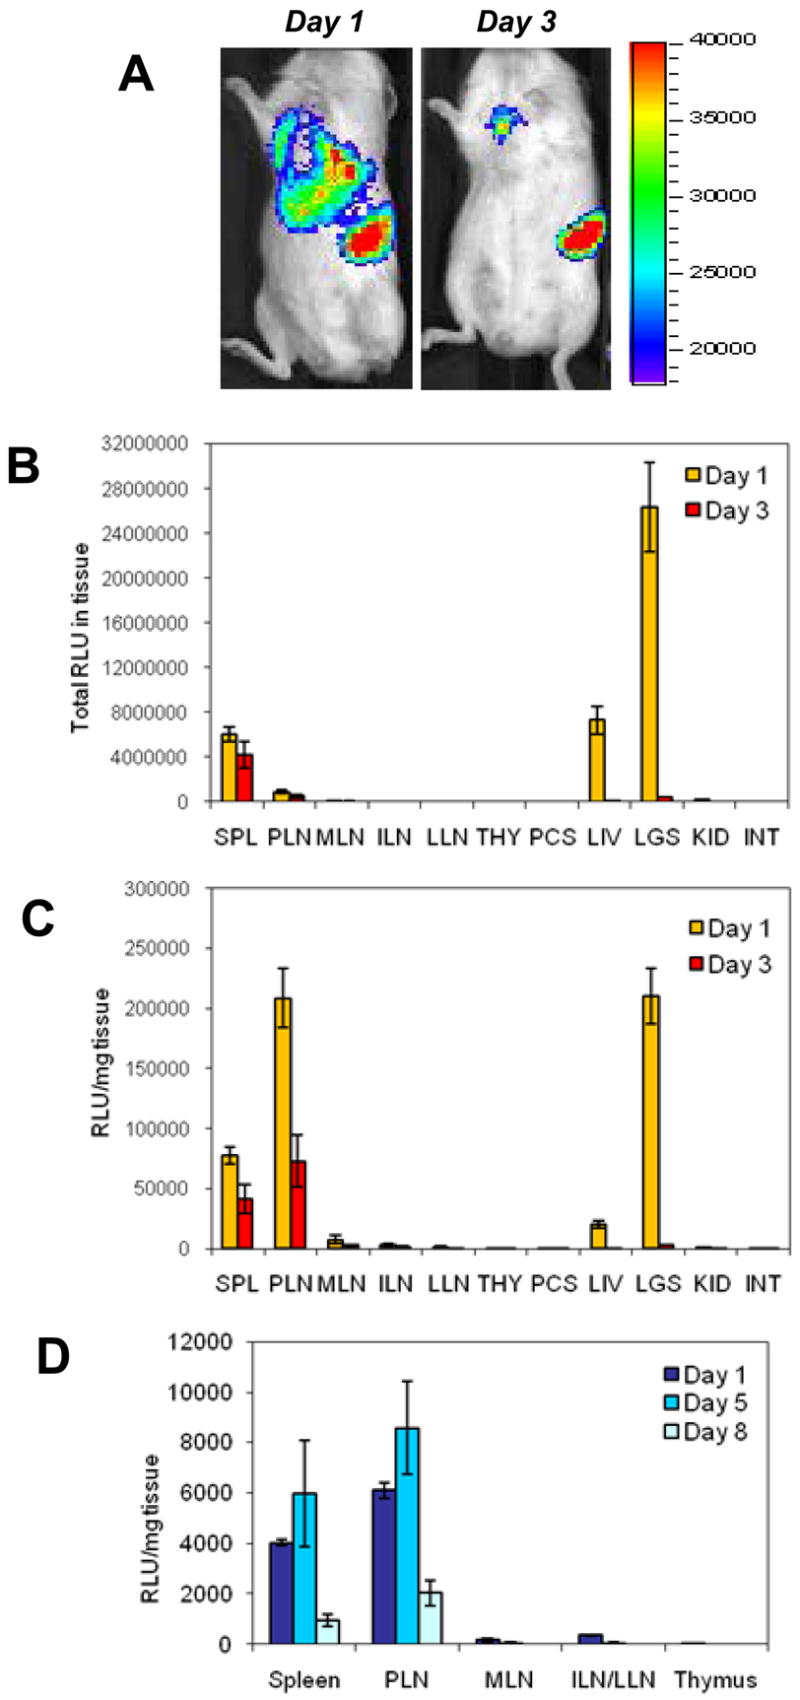
In vivo bioluminescence imaging (A) and biodistribution analysis (B, C) of Luc+ NOD DCs, 1 and 3 days after IV injection. DC/GLF (1x10⁶ GFP+ cells) were injected into 12-wk old euglycemic NOD mice. Mice were imaged live at various time points (A), and some of them sacrificed for biodistribution analysis. Total luciferase activity in tissues (B) and normalized activity per mg tissue (C) are shown (mean ± SE, n=3 mice per time point, one of two similar experiments shown). Migration of Luc+ NOD.B10 DCs after IV injection (5x10⁵ GFP+ cells/mouse) into 12-wk old NOD.B10 mice was also evaluated. Panel (D) shows normalized luciferase activity per mg tissue at different time points after IV injection (mean ± SE, n=3 mice per time point). Abbreviations: SPL, spleen; PLN, pancreatic LNs; MLN, mesenteric LNs; ILN, inguinal LNs; LLN, lumbar LNs; THY, thymus; PCS, pancreas; LIV, liver (left lobe only); LGS, lungs; KID, kidney; INT, ileum part of intestine.
DC/IL-4 treatment normalizes gene expression in the PLN
Several mechanisms of action have been suggested in the past [6, 7, 35] for the effect of DC and/or IL-4 in NOD mice. We opted for a different approach, using microarray analysis, to get a broader picture of the impact of DC/IL-4 treatment on gene expression in targeted tissues. Due to cost and time restrictions, we chose to first focus on the PLN, since it is preferentially targeted by DCs and relevant to the disease. We took advantage of the analysis already done as part of the NOD Roadmap study (Kodama et al., manuscript submitted, and raw data available online on http://fathmanlab.stanford.edu/downloads.html). From these data, we selected genes that were most over- or under-expressed in 12-wk old NOD PLN (untreated, n = 7 mice) compared to control PLN from NOD.B10 (one array per mouse), using a p value of 0.01 as a cut-off. Some of these genes, if not all, may be differentially expressed due to the NOD disease. Using a log10 ratio >0.45 or <-0.45 (~3 fold difference), we filtered 221 genes. PLN samples were also obtained from DC/IL-4-treated 12-wk old NOD mice 3 days after DC injection (n = 9 mice from 2 independent experiments), and gene expression in these samples was also compared to the same NOD.B10 control (one array per NOD mouse to the pooled NOD.B10 tissue). Data presented in Table 1 and Fig. 5A illustrate how the expression of these 221 genes has been affected by the treatment (effect considered significant if p<0.05 when comparing log10 ratios from all untreated NOD/NOD.B10 and treated NOD/NOD.B10 data). Strikingly, expression in over 85% of these genes was significantly normalized (log10 ratio closer to 0, or gene expression more similar to NOD.B10), not significantly changed in about 14%, and significantly changed, but further apart from NOD.B10 levels in less that 1% (two genes: 4930535B03Rik and Cxcl7). The complete list can be obtained in our supplementary data (“Restricted list” in the file “DC-IL4 IV analyzed.xls”). If we relaxed our selection criteria by taking all genes over- or under-expressed more than 2 fold (log10 ratio >0.3 or <-0.3, p<0.01), about 87% of the 686 genes had their expression normalized by the treatment, ~12% were unchanged and in less than 1% (3 genes), the difference was enhanced (Table 1). The complete list can be found in our supplementary data (“Expanded list” in the file “DC-IL4 IV analyzed.xls”). The Il4 gene was not on the above group of genes because it did not fulfill all of the criteria (less than 2 fold change between NOD and NOD.B10 in Roadmap study). However, as expected, there was a significant increase in Il4 gene expression (p=0.0002), which was driven above the NOD.B10 levels (Fig. 5B and supplemental data “Selected genes” in the file “DC-IL4 IV analyzed.xls”). Similarly, expression of Gata3 was significantly increased (p=0.0008), whereas that of Ifng (IFN-γ) and Tbx1 (T-bet) was not significantly changed (Supplementary data “Selected genes” in the file “DC-IL4 IV analyzed.xls”). For confirmation, we performed RT-PCR analysis of relative IL-4 and IFN-γ expression in total PLN of individual mice, untreated or 3 days post-treatment (Fig. 5C and 5D respectively). The increase in Il4 expression in total PLN after treatment was highly significant (p=1.2x10⁻⁵), while Ifng expression was unchanged (p=0.64). In addition to normalizing most of the genes, whose expression may have been influenced by the disease (Table 1), DC/IL-4 treatment induced major changes in gene expression in the PLN. Out of 41,167 features on the Agilent chip, expression in 5197 of them (12.6%) was significantly up-regulated more than 2 fold in treated animals ((log10 ratio treated – log10 ratio untreated) >0.3 and p<0.01); examples of such genes are Cd4, Itgax (CD11c), Il2ra (CD25), Itgae (CD103), Gata3, Traf6, Zap70, Il4, Il15, Tnf (TNF-α), Ccl3/Ccl4 (MIP1-α/β), Ccl20 (MIP-3α), Ccl24 (Eotaxin-2), Ccr3, Ccr4, Cxcr3, Gzma (granzyme A), Lgals1 (galectin-1), Tnfrsf9 (4-1BB) and Tlr3. In addition, expression in 5272 of all features (12.8%) was significantly down-regulated after treatment ((log10 ratio treated – log10 ratio untreated) <-0.3 and p<0.01); this group include Cd28, Ctla4, Stat1, Stat3, Stat5a, Stat6, Ifnb1 (IFN-β), Ccl5 (Rantes), Cxcl12 (SDF1-α), Il2, Il5, Il7r, Ifngr1, Tnfsf11 (TRANCE) and Tlr4. The complete list of genes is available in supplementary data “Changed genes (2x, p<0.01)” in the file “DC-IL4 IV analyzed.xls”.
Table 1.
Effect of DC/IL-4 treatment on the most over- or under-expressed genes in the PLN of 12-wk old NOD mice (relative to NOD.B10 control). The two halves of the table shows the fate, following DC/IL-4 treatment, of the genes that there ~3 fold (top) or 2 fold (bottom) over- or under-expressed in NOD mice. The list of 2-fold changed (“Expanded list”) and 3-fold changed (“Restricted list”) genes can be found on the file “DC-IL4 IV analyzed.xls” from http://fathmanlab.stanford.edu/therapy.html.
| Genes changed in Roadmap (> 3 fold) | |||
|---|---|---|---|
| Effect of DC/IL-4 iv | Up (log ratio>0.45) | Down (log ratio<-0.45) | Total |
| Normalized (p<0.05) | 5 (71.4%) | 183 (85.5%) | 188 (85.1%) |
| Unchanged (p>0.05) | 1 (14.3 %) | 30 (14%) | 31 (14%) |
| Enhanced (p<0.05) | 1 (14.3%) | 1 (0.5%) | 2 (0.9%) |
| Total | 7 | 214 | 221 |
| Genes changed in Roadmap (> 2 fold) (include above genes) | |||
| Effect of DC/IL-4 iv | Up (log ratio>0.3) | Down (log ratio<-0.3) | Total |
| Normalized (p<0.05) | 71 (76.3%) | 527 (88.9%) | 598 (87.2%) |
| Unchanged (p>0.05) | 20 (21.5%) | 65 (11%) | 85 (12.4%) |
| Enhanced (p<0.05) | 2 (2.2%) | 1 (0.1%) | 3 (0.4%) |
| Total | 93 | 593 | 686 |
Figure 5.
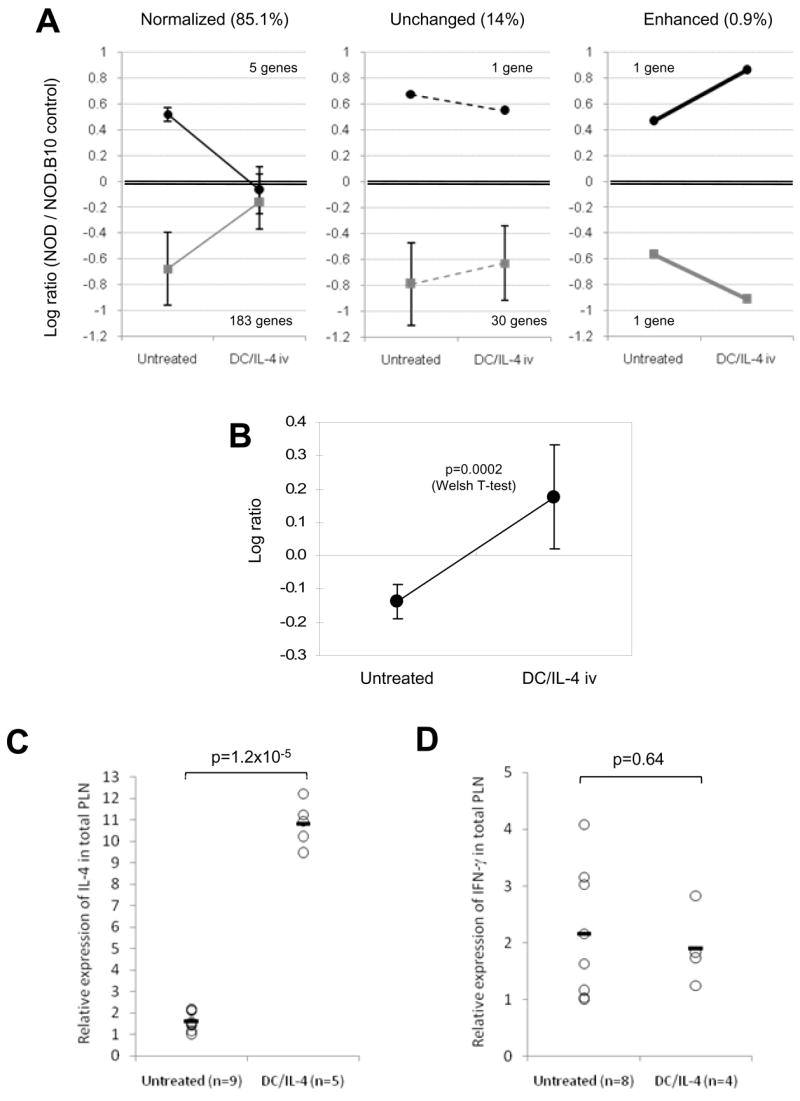
Changes in gene expression induced by DC/IL-4 in the PLN of 12 wk-old NOD mice. (A) Gene expression in PLN from female NOD mice, untreated (n=7) or treated with DC/IL-4 iv (n=9), was analyzed against a tissue-matched control from female NOD.B10 mice. A total of 221 genes, which expression was ~3 fold over- (log10 ratio >0.45) or under-expressed (log10 ratio <-0.45) in NOD compared to NOD.B10 (p<0.01) were selected. Their change, 3 days following treatment with DC/IL-4, was graphically represented in three groups (normalized, unchanged or enhanced; mean of log10 ratios ± SD) using data shown on Table 1. Normalized or enhanced gene expression were significantly changed by DC/IL-4 treatment (p<0.05). (B) IL-4 expression in NOD PLN, relative to NOD.B10 control, before and after DC/IL-4 treatment (mean ± SD; p=0.0002, T-test). IL-4 was not part of the above genes, because although significantly under-expressed, its log10 ratio was <0.45. (C, D) Relative expression of IL-4 (C) and IFN-γ (D) by RT-PCR in PLN of untreated or DC/IL-4-treated 12-wk old NOD mice (individual results and mean; data normalized to β actin; T-test applied).
DC/IL-4 require MHC expression to protect against diabetes
To address whether the simple delivery of IL-4 to the PLN is sufficient or whether interaction with T cells is important, we compared treatment with DC/IL-4 from normal NOD mice and from MHC-deficient (C2ta−/− β 2m−/−) NOD mice (Fig. 6A). Following lentiviral infection, the two types of DCs were transduced with identical efficiency (Fig. 6B, right histogram). We also observed no difference in morphology, viability, in the expression of CD11c and CD40 (Fig. 6B, left and middle histograms), as well as in the expression of CD49d (Integrin α4), CD54 (ICAM-1), CD80 (B7-1), CD86 (B7-2), and CD103 (Integrin αE) by flow cytometry analysis (data not shown). We treated 12-wk old female NOD mice by IV injection with either PBS, DC/IL-4 or with the same number of MHC−/− DC/IL-4. Only 20% of DC/IL-4 treated mice were diabetic by 33 wks of age, while over 70% of mice that got MHC−/− DC/IL-4 were diabetic at 29 wks of age (Fig. 6C), a similar incidence to the PBS-treated control mice. Thus, MHC expression by DCs plays an important role in addition to IL-4 secretion in the observed therapeutic effect.
Figure 6.

MHC expression is required for protection in addition to IL-4 secretion. (A) Class I and class II MHC expression on DCs from normal or MHC−/− NOD mice. (B) Similar expression of CD11c, CD40 and transduction efficiency in DCs from normal or MHC−/− NOD mice. (C) Incidence of diabetes after IV treatment of 12-wk old prediabetic female NOD mice with either PBS, DC/IL-4 or MHC−/− DC/IL-4 (7.5x10⁵ GFP+ DCs/mouse). Statistical analysis (Log Rank test): PBS vs DC/IL-4, p=0.02; PBS vs MHC−/− DC/IL-4, p=0.6; MHC−/− DC/IL-4 vs DC/IL-4, p=0.05.
Discussion
In the Roadmap study (Kodama et al., manuscript submitted), IL-4 was one of the very few cytokines whose gene expression was significantly changed over the course of NOD disease at the level of the total PLN. In accordance with many previous observations indicating a defect in IL-4 in both NOD mice and humans with T1D, we observed a deficiency in IL-4 expression in the NOD PLN relative to diabetes-resistant NOD.B10 PLN, at 12 wks of age (by RT-PCR), and during the period of disease onset spanning from 12 to 20 wks of age (Roadmap microarrays). The cause of this deficit in IL-4 expression only in the PLN among tissues examined in diabetes-prone mice relative to diabetes-resistant mice is difficult to explain, because an increase in Th1 cytokines was not detected during that time. Moreover, such deficit was not seen in younger mice (Kodama et al., manuscript submitted). It is interesting that this reduction in IL-4 expression in the PLN at 12 wks of age precedes the period of onset of hyperglycemia, and follows a period (between 6 and 12 wks) previously characterized by a loss of Th2-priming ability by major β cell autoantigens [36].
Several groups have reported successful prevention of diabetes by treatment of young NOD mice (4–5 wks of age) with DCs [37–39]. In contrast, such non-modified DCs have not been shown to confer protection to old NOD mice with advanced insulitis. Later, Feili-Hariri et al. [28] used DCs adenovirally-transduced to express IL-4 (Ad4.DCs) in NOD mice at 10 wks of age, and obtained significant protection, while control DCs (unmodified or expressing GFP) had no significant effect. Our study not only confirms these observations, but provides substantial additional information. First, adenovirus infection renders the DCs more mature and more immunogenic, whereas lentiviral transduction has no such effect [40]. Feili-Hariri et al. reported an enhanced CD40, CD80 and CD86 expression, while these markers, as well as MHC class II, were not or minimally changed in our case. Moreover, lentiviral transduction of DCs may enhance their differentiation, as they were found to express higher levels of CD11c, whereas adenoviral infection tended to reduce CD11c expression [28]. In support of the immunogenicity issue, Feili-Hariri et al. [28] reported that GFP+ Ad.DCs were detected in the spleen and PLN 24h after injection, but had disappeared by 72h, while we could still detect the presence of Luc+ DCs in these tissues for up to a week. Second, we were able to achieve the same level of significant protection as did Feili-Hariri et al. [28], ~30% diabetic in treated, compared to ~80% in controls, using fewer administrations of DC/IL-4 in even older mice (one versus two injections; 12-wk old versus 10-wk old). Third, despite a similar level of protection achieved, there was an evident delay of onset seen with DC/IL-4, but not with Ad4.DCs. In both studies, the control DCs (Ad.DCs or DC/GFP) had a noticeable but insignificant protective effect.
Some studies involving transduced DCs in prediabetic NOD mice reported the presence of these cells in both the spleen and PLN after IV injection [28, 32], but did not address the selectivity of DC migration. We set out to determine whether all lymph nodes were equally targeted using such a systemic route or whether preferential homing specificity existed. To this end, DCs were lentivirally transduced to express luciferase and injected into 12-wk old NOD mice. We then followed the biodistribution of the DCs in live animals by bioluminescence imaging in vivo, and by analysis of various tissues ex vivo. Following IV injection, DCs rapidly homed to the most vascularized tissues (lungs, liver and spleen). Importantly, we show that bone marrow-derived DCs do not traffic equally to all lymph nodes. Migration to lung-draining mediastinal lymph nodes [41] was not so surprising given the strong signal from Luc+ DCs measured in the lungs 24h after injection. However, rapid and specific migration to the PLN was more surprising to us, given that the tissues they are known to drain (pancreas and duodenum) did not appear to harbor Luc+ DCs. Moreover, we have observed PLN-specific homing after IV injection in absence of inflammation (in several non-diabetic strains) and in the absence of lentiviral infection (using DCs from Luc-transgenic mice; Creusot et al., manuscript in preparation). It is possible that the PLN has an additional uncharacterized drainage or expresses a unique set of chemo-attractants. We are currently investigating what makes the PLN preferentially attract DCs in the absence of inflammation. Although PLN-specific homing appears to be a general phenomenon, it is a property worth exploiting for DC-mediated therapy of T1D, and possibly other pancreatic diseases.
Because of its selective targeting and known relevance to T1D, we have focused on the PLN tissue to address some of the cellular and molecular events that follow the migration of DCs and the delivery of IL-4. To this end, we first set out to determine by microarray analysis whether significant changes in gene expression occur in the NOD PLN during the course of disease, using a control from NOD.B10 PLN as a constant baseline (Kodama et al., manuscript submitted). For this report, we focused on the genes that were the most over- or under-expressed in NOD PLN at 12 wks of age, compared to the NOD.B10 PLN control. We hypothesized that these changes in expression may constitute a signature associated with the beginning of destructive insulitis (since most of these particular changes were not seen in younger mice). Using an arbitrary threshold of ~3-fold difference in expression level (with a significance value of p<0.01), 221 genes were identified, the great majority of which (214) were under-expressed in NOD PLN (Supplementary data “Restricted list” in file “DC-IL4 IV analyzed.xls”). Using PLN samples obtained 3 days after IV injection of DC/IL-4 in NOD mice, we performed microarray analysis against the same NOD.B10 PLN control, in order to assess the effect of the treatment on the expression level of these genes. We showed that >85% of these 221 genes become significantly normalized (expression driven back towards NOD.B10 levels, with a p value <0.05 between untreated and treated). Less than 1% of the genes had their expression driven significantly further apart from the NOD.B10 levels. Similar results were seen by relaxing the threshold to a 2-fold difference in expression between NOD and NOD.B10 (p<0.01), which yielded 686 genes, >87% of which were significantly normalized by DC/IL-4 treatment (Supplementary data “Expanded list” in file “DC-IL4 IV analyzed.xls”). The possible relevance of these genes in the disease process is discussed elsewhere (Kodama et al., manuscript submitted). However, it is interesting that few immune-associated genes appear in this list of 221 genes. One example is galectin-1 (Lgals1), which is known to hinder proliferation and promote apoptosis of activated T cells [42]. Galectin-1 was significantly under-expressed at 12 wks of age in the PLN, but its expression was corrected by treatment with DC/IL-4. This fits nicely with the report that DCs modified to express galectin-1 can delay the onset of diabetes [32]. The genes that were normalized do not belong to particular ‘biological process’ or ‘molecular function’ categories (Gene Ontology data, not shown). However, the most under-expressed genes (214 genes) may have more in common in terms of their regulation. For example, a good number of them (Gatm, Ambp, Gal, Chgb, Pap, Tff2, Aldh1a1, Ins2, Camp, S100a9, S100a8, Ltf) are believed to be AIRE-regulated [43, 44]. All but one (S100a9) had their expression up-regulated by treatment and half of them significantly, although the expression of Aire was not changed (p=0.93). Furthermore, many among the most under-expressed genes in the PLN are islet-specific (Gcg, Ins1, Ins2, Sst, Reg2, Reg3a, Pap (Reg3b), Ingaprp (Reg3d)), and may represent tissue-restricted antigens, regulated by AIRE and/or other factors. They were all up-regulated after treatment (all but Ins1 and Ins2 were significantly normalized). These observations point toward a possible defect in the maintenance of peripheral tolerance against islet antigens, which may be partially corrected by DC/IL-4 treatment. We are now further investigating the relevance of the changes affecting the expression of these genes.
We then analyzed all the genes, whose expression was changed in NOD PLN by DC/IL-4 treatment, regardless of whether they were over-, under- or normally expressed relative to NOD.B10 PLN. The number of genes significantly changed by treatment (p<0.01) was very high: about 1/8th of all the microarray features showed up-regulation, and another 1/8th showed down-regulation. It is at this point difficult to draw many conclusions until we can further dissect which cell types are responsible for these changes. This is complicated by the fact that most cell types in lymph nodes express IL-4Rα (data not shown). Our data are in agreement with a previously proposed Th2 deviation as mechanism of action, demonstrated by the significant increase in expression of some Th2 genes (Il4, Gata3, Ccl24), while expression of typical Th1 genes, such as Ifng and Tbx1, was not changed. The effect on IL-4 and IFN-γ expression was confirmed by RT-PCR, again at the level of the whole PLN tissue. This suggests that changes at the level of the responsible cell types may be even more dramatic.
Remarkably, DCs can be detected in the PLN within a few hours after injection (Creusot et al., manuscript in preparation) and transgene expression can be measured up to a week after injection. We have focused our analysis on day 3 after injection, a time at which DCs have cleared from most tissues, except the spleen and the PLN. As shown above, DC/IL-4 induced profound effects in the PLN, and as a consequence, the majority of treated mice were protected long-term. The effects on the spleen remain to be investigated. As seen in the Roadmap study (Kodama et al., manuscript submitted), genes that were significantly over- or under-expressed in 12-wk old NOD (compared to NOD.B10 control) did not overlap very much between spleen and PLN. In addition, we have studied the migration of Luc+ DCs and the therapeutic effect of DC/IL-4 after intraperitoneal (IP) injection. Although DCs homed more efficiently to the PLN after IP injection, their migration to the spleen was very poor compared to IV injection (Creusot et al., manuscript in preparation). We also observed that IP-injected DC/IL-4 significantly protected NOD mice, but not as efficiently as IV-injected DC/IL-4 (data not shown), suggesting that the spleen may also play an important role.
Finally, we have demonstrated that MHC class I and class II deficient DCs, transduced to express IL-4, fail to confer protection. A likely explanation is that the protection is T cell-mediated and that DCs are required to crosspresent antigens and to interact with T cells, while providing them with IL-4 in a paracrine manner. However, we are currently testing the possibility that MHC-deficient DCs may, to some extent, be impaired in their ability to efficiently home to the spleen and PLN.
Overall, our data demonstrate that therapeutic DCs (here, expressing IL-4) can effectively work at a later age than previously reported to prevent or delay the onset of hyperglycemia in NOD mice. Their effect required MHC expression, and in the PLN, was characterized by the normalization of many genes that were under-expressed during the late prediabetic stage of T1D (12-wk old NOD compared to NOD.B10). Th2 deviation may not be the only mechanism by which DC/IL-4 prevent disease; restoration of peripheral tolerance to islet antigen is another possibility that we are now investigating. Moreover, the restricted tissue (in particular PLN) homing specificity of these therapeutic DCs has provided implications for their use in clinical studies. Molecular imaging of monocyte-derived DCs, the human myeloid equivalent of murine bone marrow-derived DCs, will be required to confirm similar homing properties in man. High resolution and sensitive techniques such as positron emission tomography, using the Herpes Simplex Virus 1 thymidine kinase reporter gene and the 9-[4-[18F]fluoro-3-(hydroxymethyl)butyl]guanine probe [45], combined with computed tomography can safely be applied to human patients to address the possible use of modified DCs in terms of homing and therapeutic potential. Furthermore, the potential of DC/IL-4 to reverse overt disease (ongoing hyperglycemia) will be explored.
Supplementary data
All microarray data (~41K features) relative to the comparison of untreated NOD/NOD.B10 with DC/IL-4 treated NOD/NOD.B10 can be found on the file “DC-IL4 IV raw data.xls” from http://fathmanlab.stanford.edu/therapy.html. All analyzed data presented in this article can be found on the file “DC-IL4 IV analyzed.xls” from the same URL address. In this file, sheets “Restricted list” and “Expanded list” contain the list of genes that were significantly over- (column M in red) or under-expressed (column M in blue) in PLN of 12-wk old NOD mice compared by two-color microarray analysis to the NOD.B10 tissue matched control (p<0.01). Log10 ratios (NOD/NOD.B10) are shown for each mouse and mean ± SD (n=7, RM1 to RM7). The “Expanded list” shows all genes that were over- or under-expressed more than 2 fold (log10 ratio >0.3 or <-0.3, 686 genes total), while the “Restricted list” only shows genes that were over- or under-expressed more than ~3 fold (log10 ratio >0.45 or <-0.45, 221 genes total). The log10 ratios (DC/IL-4-treated NOD/NOD.B10) are shown for each treated mouse and mean ± SD (n=9, DC1 to DC9). PLN samples DC1 to DC9 were obtained from two independent experiments, and compared by microarray analysis to the same NOD.B10 PLN control as with the untreated samples. T-test (column AA) was used to calculate the significance of gene expression changes between untreated and treated mice. If p<0.05, the expression was considered normalized (gene expression more similar to NOD.B10) or, for a few genes only, enhanced (gene expression further under- or over-expressed). If p>0.05, the expression was considered not significantly changed (shown in grey). Genes highlighted in yellow were detected by more than one probe on the microarray. These probes showed similar results and the values were averaged for each multiprobe gene (number of probes indicated). If a gene is comprised within an Idd region, the Idd region was indicated also. The sheet “Changed genes (p<0.01)” contains all genes that were significantly up-regulated (highlighted in red on column AA) and down-regulated (highlighted in blue on column AA). The sheet “Selected genes” contains a list of immunologically relevant genes selected from the previous list, some of which have been mentioned in the article as example.
Acknowledgments
We wish to thank Cariel Taylor, Claire Holness, Ingo Tarner and Pearl Chang for miscellaneous help, and Carlo Heirman for his initial work on pHR lentiviral constructs.
This work was primarily funded by NIH grants AI039646-04 and DK 078123-02, AI55468, AI36535, JDRF grant 1-2005-1107 and JDRF postdoctoral fellowship 3-2005-1019. Additional support came through NCI's Small Animal Imaging Resource Program (SAIRP grant number R24CA92862).
Footnotes
Publisher's Disclaimer: This is a PDF file of an unedited manuscript that has been accepted for publication. As a service to our customers we are providing this early version of the manuscript. The manuscript will undergo copyediting, typesetting, and review of the resulting proof before it is published in its final citable form. Please note that during the production process errors may be discovered which could affect the content, and all legal disclaimers that apply to the journal pertain.
References
- 1.Shoda L, Young D, Ramanujan S, Whiting C, Atkinson M, Bluestone J, Eisenbarth G, Mathis D, Rossini A, Campbell S, Kahn R, Kreuwel H. A comprehensive review of interventions in the NOD mouse and implications for translation. Immunity. 2005;23:115–26. doi: 10.1016/j.immuni.2005.08.002. [DOI] [PubMed] [Google Scholar]
- 2.Staeva-Vieira T, Peakman M, von Herrath M. Translational mini-review series on type 1 diabetes: Immune-based therapeutic approaches for type 1 diabetes. Clin Exp Immunol. 2007;148:17–31. doi: 10.1111/j.1365-2249.2007.03328.x. [DOI] [PMC free article] [PubMed] [Google Scholar]
- 3.Roep B, Atkinson M, von Herrath M. Satisfaction (not) guaranteed: re-evaluating the use of animal models of type 1 diabetes. Nat Rev Immunol. 2004;4:989–97. doi: 10.1038/nri1502. [DOI] [PubMed] [Google Scholar]
- 4.Creusot R, Fathman CG, Muller-Ladner U, Tarner I. Targeted gene therapy of autoimmune diseases: advances and prospects. Expert Rev Clin Immunol. 2005;1:385–404. doi: 10.1586/1744666X.1.3.385. [DOI] [PubMed] [Google Scholar]
- 5.Cameron M, Arreaza G, Zucker P, Chensue S, Strieter R, Chakrabarti S, Delovitch T. IL-4 prevents insulitis and insulin-dependent diabetes mellitus in nonobese diabetic mice by potentiation of regulatory T helper-2 cell function. J Immunol. 1997;159:4686–92. [PubMed] [Google Scholar]
- 6.Mueller R, Bradley L, Krahl T, Sarvetnick N. Mechanism underlying counterregulation of autoimmune diabetes by IL-4. Immunity. 1997;7:411–8. doi: 10.1016/s1074-7613(00)80362-3. [DOI] [PubMed] [Google Scholar]
- 7.King C, Mueller Hoenger R, Malo Cleary M, Murali-Krishna K, Ahmed R, King E, Sarvetnick N. Interleukin-4 acts at the locus of the antigen-presenting dendritic cell to counter-regulate cytotoxic CD8+ T-cell responses. Nat Med. 2001;7:206–14. doi: 10.1038/84659. [DOI] [PubMed] [Google Scholar]
- 8.Rapoport M, Jaramillo A, Zipris D, Lazarus A, Serreze D, Leiter E, Cyopick P, Danska J, Delovitch T. Interleukin 4 reverses T cell proliferative unresponsiveness and prevents the onset of diabetes in nonobese diabetic mice. J Exp Med. 1993;178:87–99. doi: 10.1084/jem.178.1.87. [DOI] [PMC free article] [PubMed] [Google Scholar]
- 9.Skapenko A, Kalden J, Lipsky P, Schulze-Koops H. The IL-4 receptor alpha-chain-binding cytokines, IL-4 and IL-13, induce forkhead box P3-expressing CD25+CD4+ regulatory T cells from CD25–CD4+ precursors. J Immunol. 2005;175:6107–16. doi: 10.4049/jimmunol.175.9.6107. [DOI] [PubMed] [Google Scholar]
- 10.Sharif S, Arreaza G, Zucker P, Mi Q, Sondhi J, Naidenko O, Kronenberg M, Koezuka Y, Delovitch T, Gombert J, Leite-De-Moraes M, Gouarin C, Zhu R, Hameg A, Nakayama T, Taniguchi M, Lepault F, Lehuen A, Bach J, Herbelin A. Activation of natural killer T cells by alpha-galactosylceramide treatment prevents the onset and recurrence of autoimmune Type 1 diabetes. Nat Med. 2001;7:1057–62. doi: 10.1038/nm0901-1057. [DOI] [PubMed] [Google Scholar]
- 11.Hong S, Wilson M, Serizawa I, Wu L, Singh N, Naidenko O, Miura T, Haba T, Scherer D, Wei J, Kronenberg M, Koezuka Y, Van Kaer L. The natural killer T-cell ligand alpha-galactosylceramide prevents autoimmune diabetes in non-obese diabetic mice. Nat Med. 2001;7:1052–6. doi: 10.1038/nm0901-1052. [DOI] [PubMed] [Google Scholar]
- 12.Beaudoin L, Laloux V, Novak J, Lucas B, Lehuen A. NKT cells inhibit the onset of diabetes by impairing the development of pathogenic T cells specific for pancreatic beta cells. Immunity. 2002;17:725–36. doi: 10.1016/s1074-7613(02)00473-9. [DOI] [PubMed] [Google Scholar]
- 13.Duarte N, Stenström M, Campino S, Bergman M, Lundholm M, Holmberg D, Cardell S. Prevention of diabetes in nonobese diabetic mice mediated by CD1d-restricted nonclassical NKT cells. J Immunol. 2004;173:3112–8. doi: 10.4049/jimmunol.173.5.3112. [DOI] [PubMed] [Google Scholar]
- 14.Frey A, Rao T. NKT cell cytokine imbalance in murine diabetes mellitus. Autoimmunity. 1999;29:201–14. doi: 10.3109/08916939908998535. [DOI] [PubMed] [Google Scholar]
- 15.Poulton L, Smyth M, Hawke C, Silveira P, Shepherd D, Naidenko O, Godfrey D, Baxter A. Cytometric and functional analyses of NK and NKT cell deficiencies in NOD mice. Int Immunol. 2001;13:887–96. doi: 10.1093/intimm/13.7.887. [DOI] [PubMed] [Google Scholar]
- 16.Kent S, Chen Y, Clemmings S, Viglietta V, Kenyon N, Ricordi C, Hering B, Hafler D. Loss of IL-4 secretion from human type 1a diabetic pancreatic draining lymph node NKT cells. J Immunol. 2005;175:4458–64. doi: 10.4049/jimmunol.175.7.4458. [DOI] [PubMed] [Google Scholar]
- 17.Kis J, Engelmann P, Farkas K, Richman G, Eck S, Lolley J, Jalahej H, Borowiec M, Kent S, Treszl A, Orban T. Reduced CD4+ subset and Th1 bias of the human iNKT cells in Type 1 diabetes mellitus. J Leukoc Biol. 2007;81:654–62. doi: 10.1189/jlb.1106654. [DOI] [PubMed] [Google Scholar]
- 18.Rapoport M, Mor A, Vardi P, Ramot Y, Winker R, Hindi A, Bistritzer T. Decreased secretion of Th2 cytokines precedes Up-regulated and delayed secretion of Th1 cytokines in activated peripheral blood mononuclear cells from patients with insulin-dependent diabetes mellitus. J Autoimmun. 1998;11:635–42. doi: 10.1006/jaut.1998.0240. [DOI] [PubMed] [Google Scholar]
- 19.Kallmann B, Lampeter E, HanifiMoghaddam P, Hawa M, Leslie R, Kolb H. Cytokine secretion patterns in twins discordant for Type I diabetes. Diabetologia. 1999;42:1080–5. doi: 10.1007/s001250051274. [DOI] [PubMed] [Google Scholar]
- 20.Rapoport M, Bistritzer T, Aharoni D, Weiss M, Ramot Y, Buchs A, Bloch K, Vardi P. TH1/TH2 cytokine secretion of first degree relatives of T1DM patients. Cytokine. 2005;30:219–27. doi: 10.1016/j.cyto.2005.01.012. [DOI] [PubMed] [Google Scholar]
- 21.Fox C, Danska J. IL-4 expression at the onset of islet inflammation predicts nondestructive insulitis in nonobese diabetic mice. J Immunol. 1997;158:2414–24. [PubMed] [Google Scholar]
- 22.Tominaga Y, Nagata M, Yasuda H, Okamoto N, Arisawa K, Moriyama H, Miki M, Yokono K, Kasuga M. Administration of IL-4 prevents autoimmune diabetes but enhances pancreatic insulitis in NOD mice. Clin Immunol Immunopathol. 1998;86:209–18. doi: 10.1006/clin.1997.4471. [DOI] [PubMed] [Google Scholar]
- 23.Cameron M, Strathdee C, Holmes K, Arreaza G, Dekaban G, Delovitch T. Biolistic-mediated interleukin 4 gene transfer prevents the onset of type 1 diabetes. Hum Gene Ther. 2000;11:1647–56. doi: 10.1089/10430340050111304. [DOI] [PubMed] [Google Scholar]
- 24.Lee M, Koh J, Han S, Ko K, Ki S. Prevention of autoimmune insulitis by delivery of interleukin-4 plasmid using a soluble and biodegradable polymeric carrier. Pharm Res. 2002;19:246–9. doi: 10.1023/a:1014478515005. [DOI] [PubMed] [Google Scholar]
- 25.Cameron M, Arreaza G, Waldhauser L, Gauldie J, Delovitch T. Immunotherapy of spontaneous type 1 diabetes in nonobese diabetic mice by systemic interleukin-4 treatment employing adenovirus vector-mediated gene transfer. Gene Ther. 2000;7:1840–6. doi: 10.1038/sj.gt.3301309. [DOI] [PubMed] [Google Scholar]
- 26.Yamamoto A, Chernajovsky Y, Lepault F, Podhajcer O, Feldmann M, Bach J, Chatenoud L. The activity of immunoregulatory T cells mediating active tolerance is potentiated in nonobese diabetic mice by an IL-4-based retroviral gene therapy. J Immunol. 2001;166:4973–80. doi: 10.4049/jimmunol.166.8.4973. [DOI] [PubMed] [Google Scholar]
- 27.Zipris D, Karnieli E. A single treatment with IL-4 via retrovirally transduced lymphocytes partially protects against diabetes in BioBreeding (BB) rats. JOP. 2002;3:76–82. [PubMed] [Google Scholar]
- 28.Feili-Hariri M, Falkner D, Gambotto A, Papworth G, Watkins S, Robbins P, Morel P. Dendritic cells transduced to express interleukin-4 prevent diabetes in nonobese diabetic mice with advanced insulitis. Hum Gene Ther. 2003;14:13–23. doi: 10.1089/10430340360464679. [DOI] [PubMed] [Google Scholar]
- 29.Banchereau J, Palucka A. Dendritic cells as therapeutic vaccines against cancer. Nat Rev Immunol. 2005;5:296–306. doi: 10.1038/nri1592. [DOI] [PubMed] [Google Scholar]
- 30.Lu W, Arraes L, Ferreira W, Andrieu J. Therapeutic dendritic-cell vaccine for chronic HIV-1 infection. Nat Med. 2004;10:1359–65. doi: 10.1038/nm1147. [DOI] [PubMed] [Google Scholar]
- 31.Ma L, Qian S, Liang X, Wang L, Woodward J, Giannoukakis N, Robbins P, Bertera S, Trucco M, Fung J, Lu L. Prevention of diabetes in NOD mice by administration of dendritic cells deficient in nuclear transcription factor-kappaB activity. Diabetes. 2003;52:1976–85. doi: 10.2337/diabetes.52.8.1976. [DOI] [PubMed] [Google Scholar]
- 32.Perone M, Bertera S, Tawadrous Z, Shufesky W, Piganelli J, Baum L, Trucco M, Morelli A. Dendritic cells expressing transgenic galectin-1 delay onset of autoimmune diabetes in mice. J Immunol. 2006;177:5278–89. doi: 10.4049/jimmunol.177.8.5278. [DOI] [PubMed] [Google Scholar]
- 33.Breckpot K, Dullaers M, Bonehill A, van Meirvenne S, Heirman C, de Greef C, van der Bruggen P, Thielemans K. Lentivirally transduced dendritic cells as a tool for cancer immunotherapy. J Gene Med. 2003;5:654–67. doi: 10.1002/jgm.400. [DOI] [PubMed] [Google Scholar]
- 34.Cao Y, Wagers A, Beilhack A, Dusich J, Bachmann M, Negrin R, Weissman I, Contag C. Shifting foci of hematopoiesis during reconstitution from single stem cells. Proc Natl Acad Sci U S A. 2004;101:221–6. doi: 10.1073/pnas.2637010100. [DOI] [PMC free article] [PubMed] [Google Scholar]
- 35.Feili-Hariri M, Falkner D, Morel P. Regulatory Th2 response induced following adoptive transfer of dendritic cells in prediabetic NOD mice. Eur J Immunol. 2002;32:2021–30. doi: 10.1002/1521-4141(200207)32:7<2021::AID-IMMU2021>3.0.CO;2-J. [DOI] [PubMed] [Google Scholar]
- 36.Olcott A, Tian J, Walker V, Dang H, Middleton B, Adorini L, Washburn L, Kaufman D. Antigen-based therapies using ignored determinants of beta cell antigens can more effectively inhibit late-stage autoimmune disease in diabetes-prone mice. J Immunol. 2005;175:1991–9. doi: 10.4049/jimmunol.175.3.1991. [DOI] [PubMed] [Google Scholar]
- 37.Clare-Salzler M, Brooks J, Chai A, Van Herle K, Anderson C. Prevention of diabetes in nonobese diabetic mice by dendritic cell transfer. J Clin Invest. 1992;90:741–8. doi: 10.1172/JCI115946. [DOI] [PMC free article] [PubMed] [Google Scholar]
- 38.Feili-Hariri M, Dong X, Alber S, Watkins S, Salter R, Morel P. Immunotherapy of NOD mice with bone marrow-derived dendritic cells. Diabetes. 1999;48:2300–8. doi: 10.2337/diabetes.48.12.2300. [DOI] [PubMed] [Google Scholar]
- 39.Morin J, Faideau B, Gagnerault M, Lepault F, Boitard C, Boudaly S. Passive transfer of flt-3L-derived dendritic cells delays diabetes development in NOD mice and associates with early production of interleukin (IL)-4 and IL-10 in the spleen of recipient mice. Clin Exp Immunol. 2003;134:388–95. doi: 10.1111/j.1365-2249.2003.02308.x. [DOI] [PMC free article] [PubMed] [Google Scholar]
- 40.Breckpot K, Heirman C, Neyns B, Thielemans K. Exploiting dendritic cells for cancer immunotherapy: genetic modification of dendritic cells. J Gene Med. 2004;6:1175–88. doi: 10.1002/jgm.615. [DOI] [PubMed] [Google Scholar]
- 41.Jakubzick C, Tacke F, Llodra J, van Rooijen N, Randolph G. Modulation of dendritic cell trafficking to and from the airways. J Immunol. 2006;176:3578–84. doi: 10.4049/jimmunol.176.6.3578. [DOI] [PubMed] [Google Scholar]
- 42.Vespa G, Lewis L, Kozak K, Moran M, Nguyen J, Baum L, Miceli M. Galectin-1 specifically modulates TCR signals to enhance TCR apoptosis but inhibit IL-2 production and proliferation. J Immunol. 1999;162:799–806. [PubMed] [Google Scholar]
- 43.Anderson M, Venanzi E, Klein L, Chen Z, Berzins S, Turley S, von Boehmer H, Bronson R, Dierich A, Benoist C, Mathis D. Projection of an immunological self shadow within the thymus by the aire protein. Science. 2002;298:1395–401. doi: 10.1126/science.1075958. [DOI] [PubMed] [Google Scholar]
- 44.Johnnidis J, Venanzi E, Taxman D, Ting J, Benoist C, Mathis D. Chromosomal clustering of genes controlled by the aire transcription factor. Proc Natl Acad Sci U S A. 2005;102:7233–8. doi: 10.1073/pnas.0502670102. [DOI] [PMC free article] [PubMed] [Google Scholar]
- 45.Yaghoubi S, Berger F, Gambhir S. Studying the biodistribution of positron emission tomography reporter probes in mice. Nat Protoc. 2007;2:1752–5. doi: 10.1038/nprot.2007.228. [DOI] [PubMed] [Google Scholar]