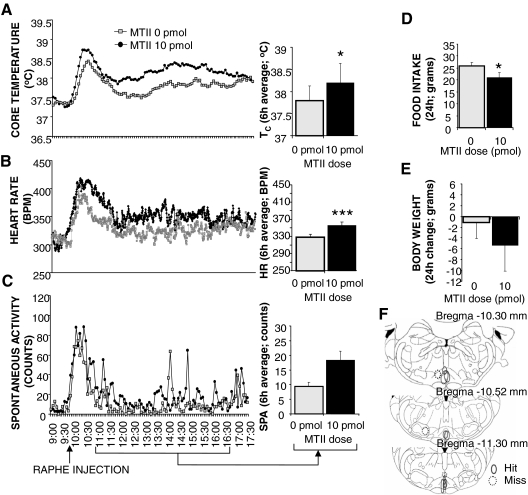
Figure 4.
Effect of 10 pmol MTII stimulation of medullary raphe MC4-Rs on TC (A), HR (B), spontaneous activity (C), 24-h food intake (D), and 24-h change in body weight (E). Line graphs represent across-rat average parameter measurements through the 8-h recording period. The bracketed time period on the line graph x-axis indicates the periods used in the histograms. Histograms in A–C represent 6-h means + sem. *, P < 0.05; ***, P < 0.0005. F, Reconstruction of injection sites based on microscopical analysis of dye injection at the same volume (100 nl) as the melanocortin agonist. Microscopical analysis revealed that nine of 12 rats had placements within the medullary raphe. Solid line ovals mark the area of the dye injection for each rat with confirmed medullary raphe placement. Dotted line circles represent injection sites that were judged to be outside of medullary raphe. Placements shown were between −10.30 and −11.30 mm from bregma (54). BPM, Beats per minute.

