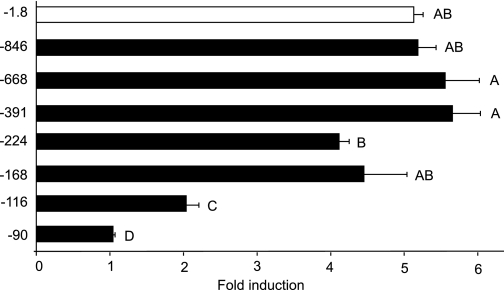
Figure 3.
Mapping the regions involved in induction of human αGSU by GR. The 1.8-kb αGSUluc, −845αGSUluc, −668αGSUluc, −391αGSUluc, −224αGSUluc, −168αGSUluc, −116αGSUluc, or −90αGSUluc reporter genes were transiently transfected into LβT2 cells along with the GR expression vector. The cells were serum starved overnight and then treated for 24 h with 100 nm Dex. Data represent the mean ± sem of at least three experiments performed in triplicate and are presented as fold induction relative to the control. The response with −1.8 kb and with the truncations −846, −668, −391, −224, and −168 bp are significantly different from the response with −116 and −90 truncations. Levels not connected by the same letter are significantly different, using one-way ANOVA followed by Tukey’s post hoc test, P < 0.05.

