

Abstract
Networks that contain only sign-consistent loops, such as positive feedforward and feedback loops, function as monotone systems. Simulated using differential equations, monotone systems display well-ordered behaviour that excludes the possibility for chaotic dynamics. Perturbations of such systems have unambiguous global effects and a predictability characteristic that confers robustness and adaptability. The authors assess whether the topology of biological regulatory networks is similar to the topology of monotone systems. For this, three intracellular regulatory networks are analysed where links are specified for the directionality and the effects of interactions. These networks were assembled from functional studies in the experimental literature. It is found that the three biological networks contain far more positive ‘sign-consistent’ feedback and feedforward loops than negative loops. Negative loops can be ‘eliminated’ from the real networks by the removal of fewer links as compared with the corresponding shuffled networks. The abundance of positive feedforward and feedback loops in real networks emerges from the presence of hubs that are enriched with either negative or positive links. These observations suggest that intracellular regulatory networks are ‘close-to-monotone’, a characteristic that could contribute to the dynamical stability observed in cellular behaviour.
1 Introduction
Three meso-scale (100–1000 nodes) intracellular regulatory networks, where the directionality of the links and the effects of interactions are specified, have been developed. These are: mammalian cell signalling network [1]; Escherichia coli gene regulatory network [2, 3] and Saccharomyces cerevisiae gene regulatory network [4, 5]. These networks were constructed manually from functional experiments in the literature where the direction of interactions (i.e. the assignments of source and target nodes) is specified. The effects of interactions, such as positive for activation and negative for repression or inhibition, are also recorded. In these intracellular regulatory systems, the nodes/vertices represent proteins, metabolites or genes, and the links/edges that connect the nodes embody their direct interactions and/or indirect effects of one node on the other. Since these interactions represent coupled reactions, they can be represented and analysed as systems of coupled ordinary differential equations (ODEs). Dynamically, directed networks with links that have specified signs and contain only ‘sign-consistent’ loops always behave as monotone systems [6, 7].
Monotone systems have been extensively studied in control theory. The dynamical behaviour of such systems is guaranteed to evolve in a predictable manner. Monotone systems generally do not exhibit chaotic behaviour [8-11]. Such dynamically stable behaviour is often observed experimentally in cells. For example, bi-stability, multistability and monotonic dynamics are typical behaviours of many cell signalling regulatory networks [11-15] and gene regulatory networks [16, 17].
In this study, we addressed the question of whether intracellular biological regulatory networks may be ‘close-to-monotone’ systems by analysing three directed, sign/effect specified networks. We assessed the ‘distance-to-monotone’ architecture/topology by analysing the level of ‘sign-consistency’ in feedback and feedforward loops in these networks. We find a relative abundance of ‘sign-consistent’ loops in all three real networks as compared with their corresponding shuffled networks. This topology can explain the stability and order of intracellular dynamics. Further, we show that the abundance in positive feedback and feedforward loops may be due to negative hubs that sequester the probability for inconsistent loops.
2 Results
2.1 Toy model
To illustrate the predictable behaviour of monotone systems, we compared two versions of a feedforward loop, one sign consistent and the other inconsistent. Using a system of ODEs, we analysed the effects of varying rates of interactions on the levels of output node as a function of time. For sign-consistent feedforward loops, irrespective of the rates, the output behaviour is always predictable. The output node D always increased monotonically (Fig. 1a). On the other hand, when the signs of the links in the loop are inconsistent, the behaviour is not predictable. Different rates can make the output node D increase or decrease monotonically depending on the actual parameters (Fig. 1b).
Figure 1. Simulation of toy models of positive and negative feedforward loop.
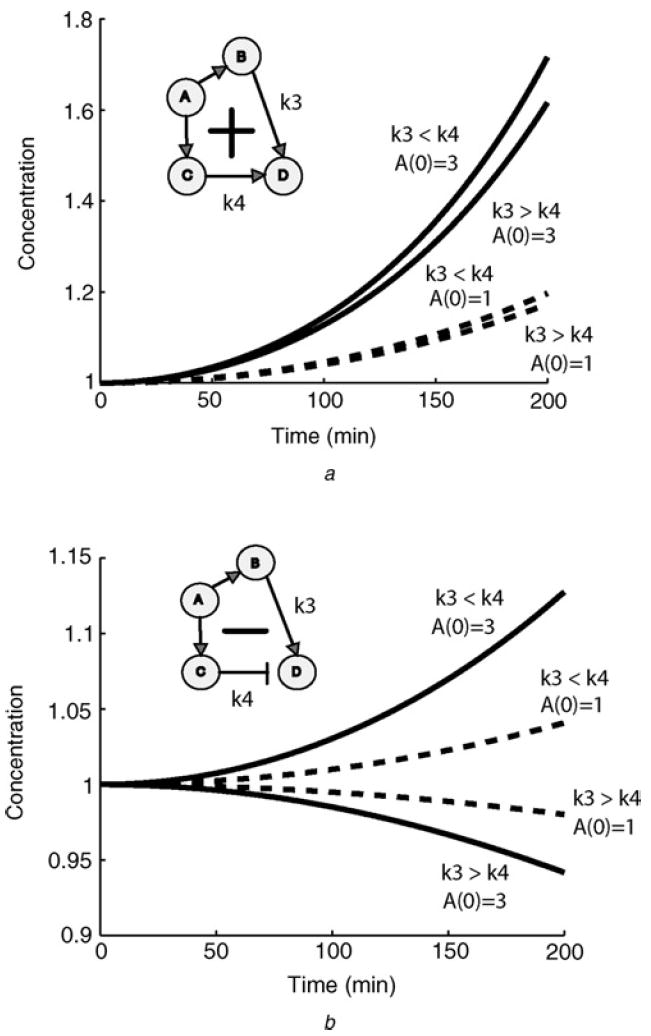
- Time evolution of the concentration of the output node D in a four-node feedforward loops with various rates in the positive configuration k3 and k4 represent the reaction rates associated with the adjacent arrows
- Time evolution of the concentration of the outputs node D in a four node feedforward loops with various rates in the negative configuration. In the positive case (a), a positive perturbation of A(0), from A(0) = 1 (dashed plots) to A(0) = 3 (solid), results in an increase in the concentrations D(t), irrespective of the numerical values of the kinetic constants
In contrast, in the negative case (b), the global effects of perturbations cannot be predicted from topology alone: the same positive perturbation of A(0) results in a smaller concentration of D(t) if the kinetic constants satisfy the inequality k3 > k4, but a larger concentration of D(t) results if, instead, k3 < k4. Details about the system of ODEs used are provided in the Methods section
2.2 Counting feedback loops
All three regulatory networks that were analysed have similar nodes to links ratio, positive to negative links ratio and display ‘small-world’ properties (high clustering coefficients and similar characteristic path lengths compared with random networks) (Table 1). All three networks have a similar connectivity distribution that best fit a power-law function (Fig. 2). This indicates that the networks are enriched in highly connected nodes (hubs) in comparison to random networks, and as such the regulatory networks contain genes and proteins that are directly regulating or are regulated by many other nodes, or both. Counting the number of positive against negative feedback and feedforward loops in the real regulatory networks against shuffled networks, we find that there are significantly more positive loops as compared with loops found in the three types of shuffled networks (Table 2). Using approximate binomial distribution analysis, we explain that these results are not due to the fact that the networks contain more positive than negative links.
Table 1.
Characteristics of the real regulatory networks
| Network | Nodes | Links | CC | CPL | Positive links | Negative links | Neutral or bidirectional links |
|---|---|---|---|---|---|---|---|
| E. coli gene regulation | 418 | 519 | 0.086 | 4.85* | 321 | 172 | 26 |
| E. coli gene regulation (updated) | 1123 | 2172 | 0.282 | 3.84** | 1313 | 826 | 33 |
| S. cerevisiae gene regulation | 690 | 1082 | 0.047 | 5.21*** | 860 | 221 | 1 |
| Mammalian cell signalling | 546 | 1259 | 0.107 | 4.22 | 690 | 306 | 263 |
Statistical measurements for the networks: number of nodes, number of links, clustering coefficients (CC) and characteristic path length (CPL) [18], positive, negative and neutral or bidirectional links
Computed for the largest island made of 328 nodes and 456 links
Computed for the largest island made of 1033 nodes and 2093 links
Computed for the largest island made of 664 nodes and 1066 links
Figure 2. Connectivity distribution plots.
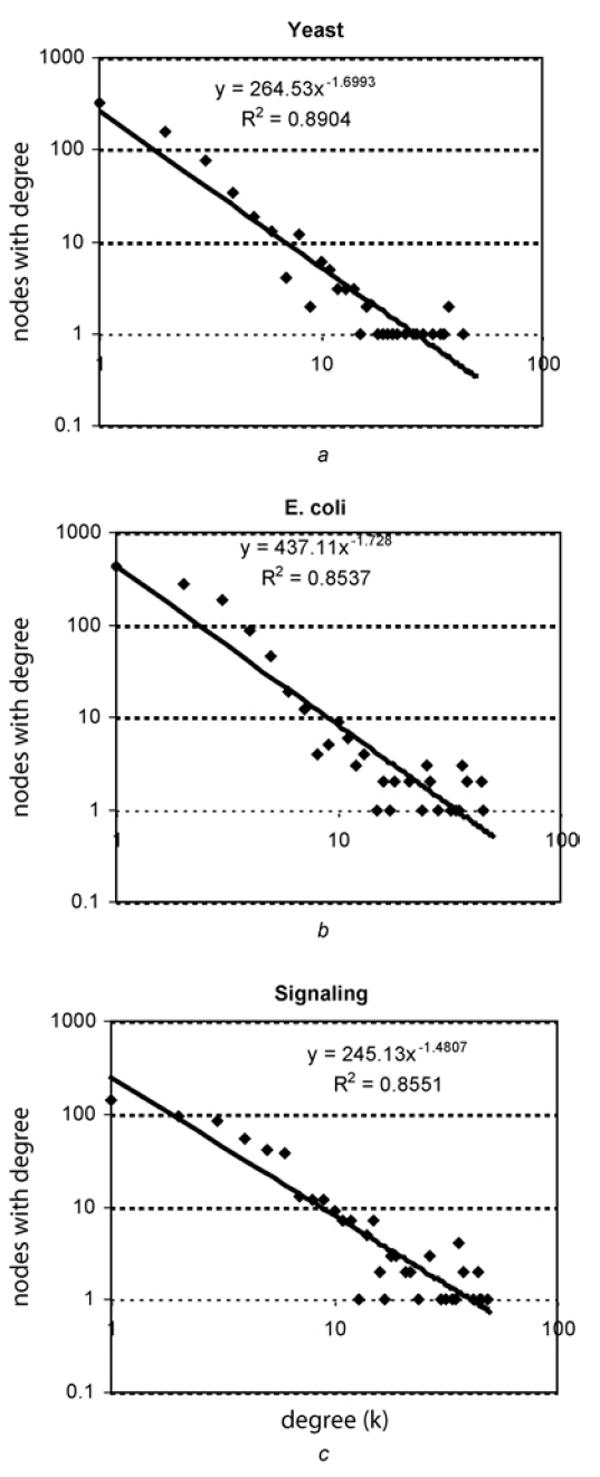
Connectivity distributions for the three real networks are plotted on a log–log scale
- E. coli
- Yeast
- Mammalian signalling
Table 2.
Comparison of loops in real and corresponding randomised networks
| Network | Positive feedback and feedforward loops in natural networks | Negative feedback and feedforward loops in natural networks | Positive loops in 20 randomly swapped signs networks | Negative loops in 20 randomly swapped signs networks | Positive loops in 20 random Erdos–Renyi networks | Negative loops in 20 random Erdos–Renyi networks | Positive loops in 20 random Maslov–Milo networks | Negative loops in 20 random Maslov–Milo networks |
|---|---|---|---|---|---|---|---|---|
| E. coli gene regulation | 35 | 6 | 20.6 ±3.0 | 19.45 ± 2.84 | 4.7 ± 2.91 | 5.4 ± 3.42 | 4.95 ± 2.6 | 4.45 ± 3.39 |
| Yeast gene regulation | 115 | 50 | 92.72 ± 11.57 | 72.75 ± 11.09 | 7.5 ± 3.41 | 7.1 ± 2.53 | 15.65 ± 6.75 | 6.75 ± 2.84 |
| Mammal. signalling | 475 | 245 | 276.35 ± 35.03 | 260.1 ± 20.46 | 12.15 ± 2.92 | 12.85 ± 6.11 | 280.2 ± 23.33 | 258 ± 19.07 |
Comparison between positive and negative feedback and feedforward loops found in the original networks and in shuffled networks created from the original networks using the algorithms described in the methods (loops size 3–5 for E. coli and yeast and 3–4 for the mammalian signalling). The numbers in the shuffled networks columns are mean ± standard deviation. The reason that the totals (positives + negatives) for the randomised signalling networks are not the same as the real networks for the randomly swapped shuffled networks is because neutral links were also shuffled. This affects the counts of feedback and feedforward loops which do not contain neutral links
If there are P positive and N negative links, and P and N are sufficiently large, the probability of picking, using a Bernoulli process, a negative link is p(−) = N/(N + P) and a positive link is p(+) = 1 − p(−).
We define ploop(k) as the probability that a feedback or feedforward loop is positive, where k is the number of links and nodes making up the loop. A positive loop is defined as a loop with either all positive links or an even number of negative links. Thus, we have the following linear first-order recursion
This recursion has the solution
Thus, for 0 < p(+) < 1, ploop(k) converges to 0.5, and for p(+) = 1 ploop(k) = 1 (all links are positive) and ploop(k) alternates between 0 and 1 if p(+) = 0 (the network is made of only negative links).
For example, for k = 5 and the E. coli transcriptional network, where we have 321 positive links, 172 negative links, and 26 neutral links (we count neutral links as positive) we have p(+) = 347/(347 + 172) = ~0.67.
Therefore using this simplified Bernoulli argument, the probability of obtaining a positive loop is ploop(5) = [1 + (0.34)5]/2 = 0.502 (for k = 4, p = 0.507, and for k = 3, p = 0.52). This analysis is similar to what was suggested for the different possible configurations of three-node feedforward loops in a prior study [19].
The real networks were compared with three types of shuffled networks used as statistical controls: the first type of shuffled networks maintains the exact connectivity as the natural topology but differ in the distribution of signs/effects associated with the links (sign-swapped). The other two types of shuffled networks are Erdos–Renyi random networks [20] which are completely randomised and Maslov–Milo method of shuffling which preserves some of the original topology [4, 21]. The Maslov–Milo shuffling method maintains the connectivity distribution of nodes but destroys the local structure of the networks by repeatedly swapping the connectivity of pairs of interactions making source nodes randomly linked to target nodes. The Maslov–Milo shuffling method does not preserve the sign distribution by blindly swapping positive and negative links.
Interestingly, the difference between the real and sign-swapped shuffled networks for the yeast transcription regulatory network is less significant than differences observed from similar comparisons for the mammalian signalling and E. coli transcriptional networks (Table 2). This difference can be explained by a single link that is found in many feedforward loops in the yeast network. The positive link between DAL80 and GLN3, when removed, caused the abolishment of 22 out of a total of 42 negative loops. Both genes encode GATA family transcription factors, where DAL80 is a repressor that functions as an outgoing hub that is regulated positively by GLN3 [22]. The GATA family of genes makes an extensive regulatory circuit which contains many members of the family regulating one another [23]. The mathematical derivation described above assumes statistical independence of link contribution to loops and as such would result in almost even number of positive against negative loops in shuffled networks. This is observed for the signed-shuffled E. coli gene regulatory and mammalian cell signalling networks. In contrast, in the yeast gene regulatory network, a single link participates in 22 negative loops. Removing this link abolishes all these loops. We term this phenomenon of shared links (and/or nodes) to form multiple loops ‘nesting’. Nesting can drastically affect the distribution of positive to negative loops ratio. In the natural topologies, as well as in the sign-swapped topologies, there are several links that contribute to the formation of many negative loops in each network (Fig. 3).
Figure 3. Links reused in feedback and feedforward loops.
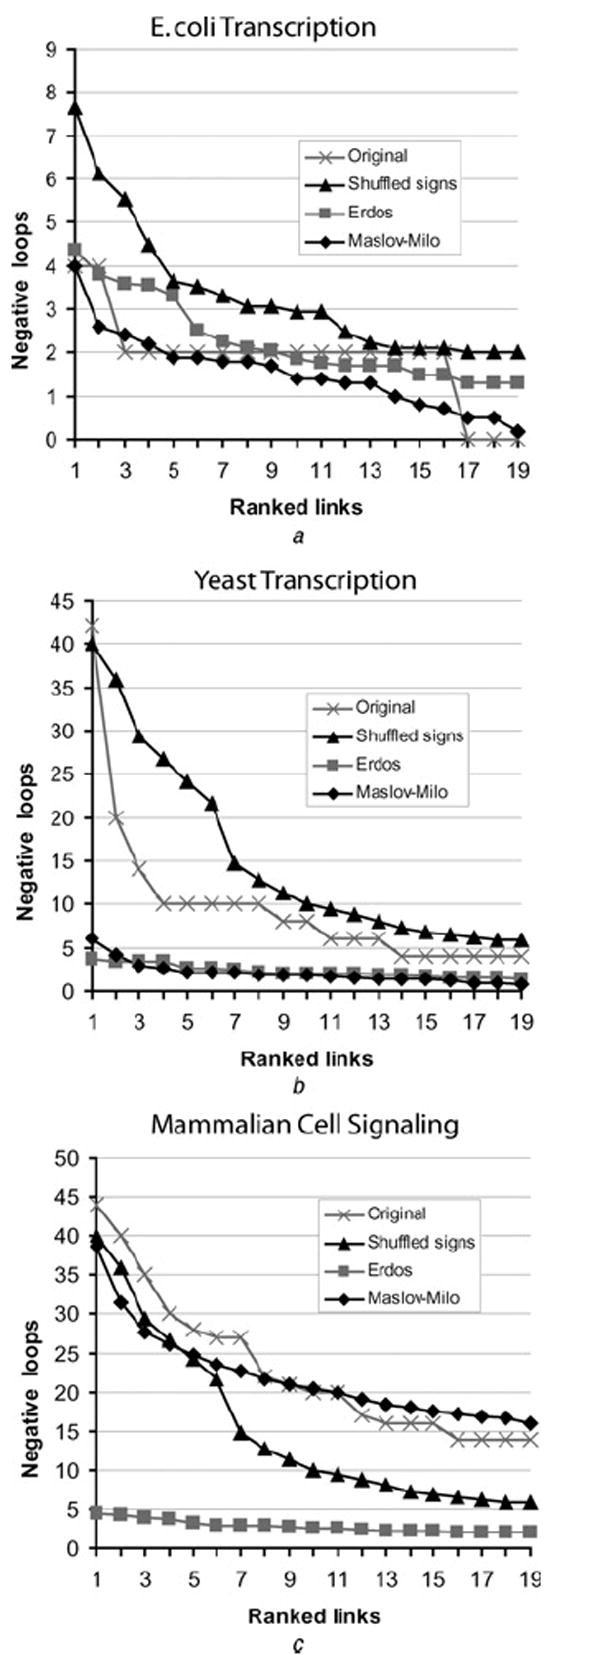
Ranked links based on the number of times links are used to form feedback and feedforward loops
- E. coli network
- Yeast network
- Mammalion Signalling network
2.3 Removing negative loops
We developed an algorithm that removes links that contribute to the formation of negative feedback and feedforward loops. The algorithm is demonstrated schematically on a toy network (Fig. 4). We sequentially remove links to gradually eliminate all small size negative loops (3–4 or 3–5 nodes per loop) from any network. We applied this algorithm to the original networks and compared the results with the results of applying the algorithm to random-swap shuffled networks. We found that we could remove ~30% less links from the E. coli transcription network, ~50% less links from the yeast transcription network or ~65% less links from the mammalian signalling network, compared with the number of links that need to be removed from the corresponding shuffled networks in order to eliminate all negative loops of size 3–5 for the yeast and E. coli networks and 3–4 for the signalling network (Fig. 5). These results indicate that it is easier to convert real network topologies to monotone ‘sign-consistent’ topologies as compared with the ‘effort’ needed to convert shuffled networks into monotone topology.
Figure 4. Toy network to illustrate negative loops removal algorithm.
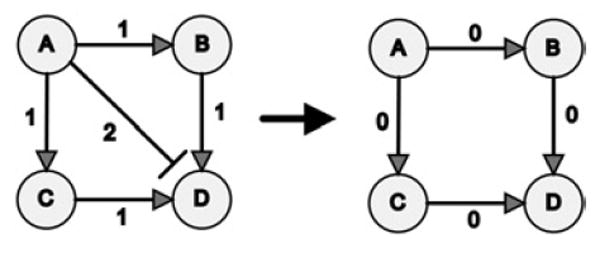
Toy network schematically illustrates the algorithm that removes links that contribute to negative feedforward loops
First, the algorithm counts the number of times a link contributes to the formation of negative feedback and feedforward loops
Then the link that contributes to the most number of negative loops is removed from the network
The link from A to D is removed because it participates in two negative feedforward loops (more than any other link)
After this link is removed there are no more negative loops left in the toy network
Links are labelled 0, 1 or 2 depending on the number of negative loops they participate in
Figure 5. Gradual removal of links that contribute to negative loops.
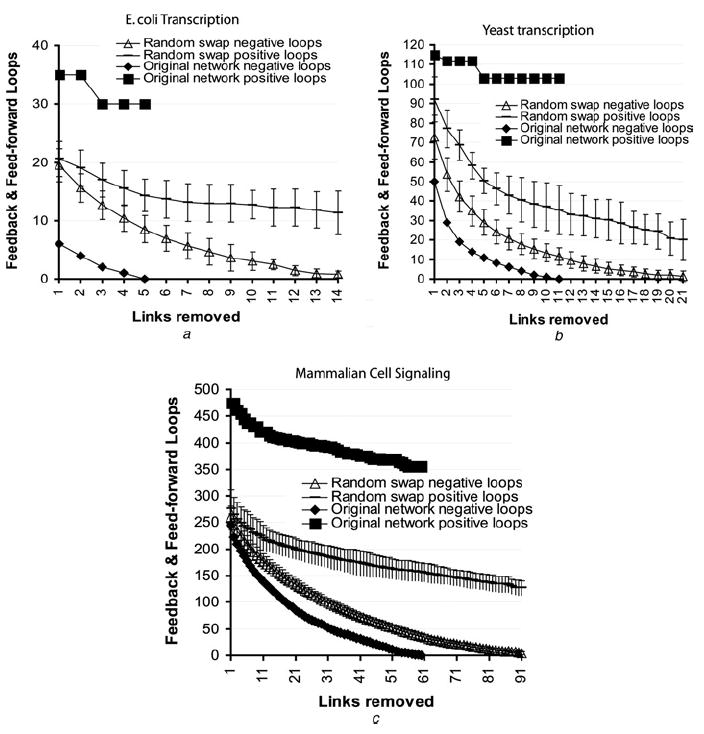
The number of positive and negative feedback and feedforward loops of size 3–5 in the yeast and E. coli networks and 3–4 in the mammalian signalling network were counted. Then, the link that contributes to the most number of negative loops was removed
The process was repeated until the networks no longer had small-size negative feedback and feedforward loops
- E. coli gene regulation network
- S. cerevisiae gene regulation network
- Mammalian signalling network
2.4 Clumping of negative links by hubs
The relative abundance of positive loops in the real networks and the relative ease in removing the negative loops could be due to few highly connected nodes that have predominantly negative links. Since hubs contribute to the formation of many feedback and feedforward loops and if a hub has all or mostly negative links, the probability that such hub would contribute two negative links to a loop is high. Since each node in a feedforward or feedback loop contributes two links to the loop, the two negative links in a loop that are connected to a ‘negative’ hub would cancel each other, because, by definition two adjacent negative links are considered positive. This feature of the network would make hubs with many negative links (negative hubs) sequester the negative links because these negative hubs would contribute pairs of negative links to loops. Pairs of negative links in loops that involve negative hubs would make these loops positive because of the double negative. This would leave only few sparsely connected nodes with negative links that can be present in negative loops.
Consider a graph G. We select one node as our ‘hub’ and divide the graph into two graphs: G1 is the hub with its edges (a star-like graph) and G2 is the rest of the graph (the hub’s neighbouring nodes appear in both graphs). There is a fraction P2 of positive links in G2 and a fraction n2 = 1 − p2 of negative links. We assume that p2 > 1/2, that is, there are more positive links than negative links in G2. This assumption holds for the networks we analysed, and if we chose a hub with relative majority of negative edges than the fraction of positive edges in G2, this makes our assumption even stronger than that of G.
We denote by σk the probability of a simple path of length k in G2 to be positive (i.e. to include even number of negative links). σ1 = p2 and .
Assuming p2 > 1/2, we obtain σ1 > 1/2 and σ2 > 1/2. We show now that σk ≥ 1/2 for any k. We have shown this for k = 1 and 2, and now we want to show that if it is true for k then it must be true for k + 1 as well.
A path of length k + 1 is a path of length k with one additional link. It can be positive in one of the two ways: either the original path (of length k) is positive, and the extra edge is also positive or both are negative. Thus, σk+1 = p2 · σk + (1 − p2) · (1 − σk). Now by simple algebra
According to our assumptions, σk ≥ 1/2 which means that 2σk − 1 ≥ 0. In addition, 1 − p2 < 1/2 and as a result: −σk+1 < (2σk − 1)/2 − σk = −1/2 or σk+1 ≥ 1/2.
Now we want to close this path into a loop, using two edges from G1. We denote the fraction of positive edges in G1 by p. The fraction of negative edges is n = 1 − p.
The probability ploop of the loop to be positive is
We showed already that σk ≥ 1/2 for any k and thus 2σ − 1 ≥ 0. Thus the second term is negative. The function f (p) = p(1 − p) obtains its maxima at p = 1/2 and is equal to zero at p = 0 and 1. Thus, ploop obtains its minima when the hub is balanced (p = 1/2) and is increasing as p approaches 0 or 1.
To determine whether real networks are enriched in negative hubs, we first plotted the in-links against out-links difference on the x-axis and positive-links against negative-links difference on the y-axis for all nodes (Fig. 6). The plots show the existence of hubs with abundance of negative links in all three real networks compared with a representative random-swap shuffled network. In particular, the yeast and the E. coli transcriptional networks have many more outgoing negative (and also positive) hubs. All three intracellular regulatory networks show preferential enrichment for hubs with either only positive or only negative links. Because negative links are concentrated around few hubs, and are not evenly spread around like in the shuffled networks, the probability of forming negative loops is reduced. Hence, the existence of hubs enriched in negative links in the topology of real networks leads to the preference for positive feedback and feedforward loops.
Figure 6. Visualisation of positive and negative and in-out hubs.
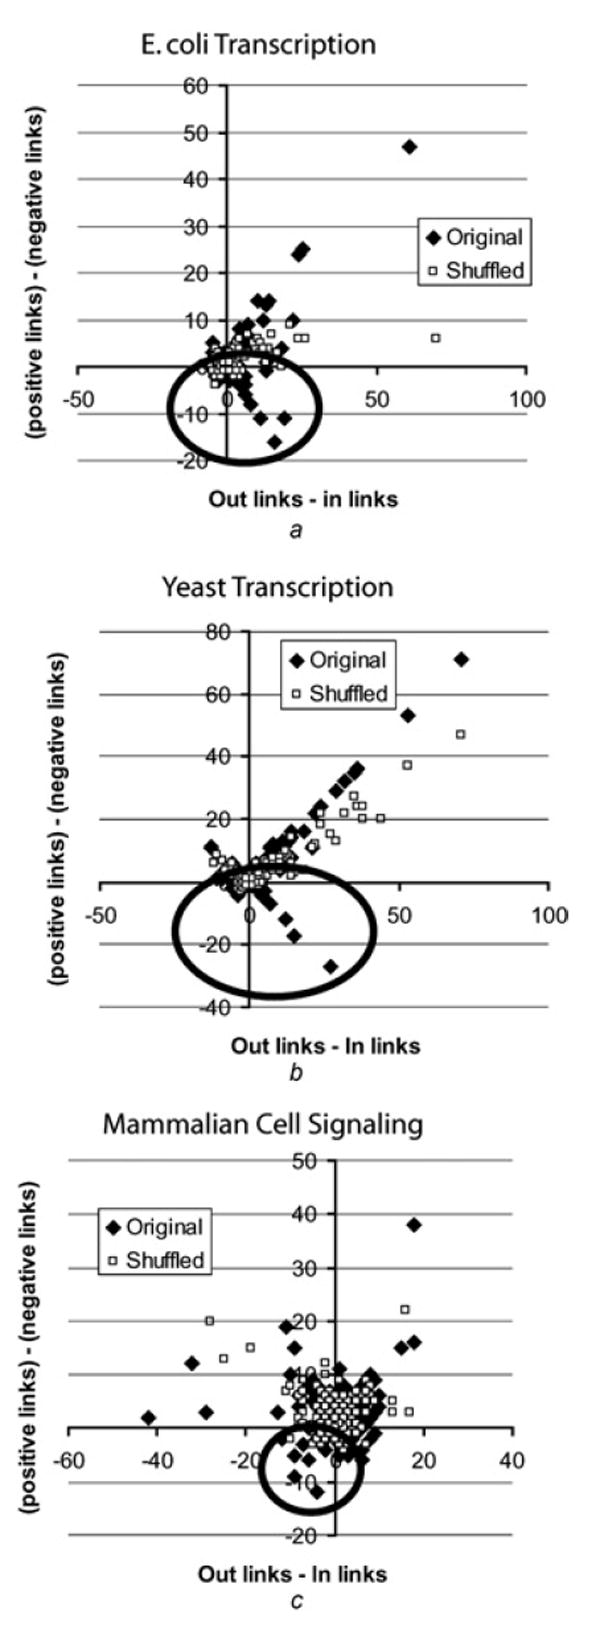
All nodes in the networks where positioned in a 2D grid based on an x-axis location as the difference between the in and out links for each node, and on y-axis location as the difference between the positive and negative links for each node (solid diamonds)
- E. coli gene regulation network
- S. cerevisiae gene regulation network
- Mammalian signalling network
3 Discussion
Cellular networks display stable behaviour in response to complex and noisy external stimuli. How do natural complex systems achieve such robust stability in dynamical complex environments? Our study suggests that intracellular biological regulatory networks may be ‘close-to-monotone’ systems because of the selection for positive feedback loops and positive feedforward loops and selection against negative feedback loops and negative feedforward loops. Negative ‘inconsistent’ feedback loops have been shown to be more prone to produce unstable dynamics such as oscillations [7, 24]. Hence, the selection against them provides a mechanism to obtain stable dynamical behaviour that is commonly observed in cells. Although, intuitively negative feedback loops may seem to be important for cellular homeostasis, whereas positive feedback loops are important to establish multi-state stability and state change, the observed topology of the real networks shows that negative feedback loops are not common, and as such, homeostasis is likely to be maintained in large part through controlled degradation and deactivation, for example, by dephosphorylation carried out through constitutive phosphatases in signalling networks that dampen incoming signals.
Besides dynamical stability, monotone system architecture is also advantageous for ordered behaviour, predictability and evolutionary modularity. For example, when we increase or decrease the concentration of a node, or if we change the reaction rates represented by links in a network containing only positive feedforward and feedback loops, the output would increase with time and then may decay because of constitutive negative regulators. In contrast, changes in the initial concentrations or rate constants in networks containing inconsistent feedback or feedforward loops can induce oscillations and lead to chaotic behaviour. Thus, monotone topology preserves input/output relationships between distal components in networks, a feature that is commonly observed in cell signalling pathways.
With the completion of sequencing the human genome, it has been found that there are 395 serine/threonine and dual-specificity protein kinases as compared with 44 serine/threonine and dual-specificity protein phosphatases, and 106 tyrosine protein kinases compared with 56 Tyrosine protein phosphatases, respectively [25]. Our current understanding of mammalian cell signalling indicates that, generally, protein kinases are activated in response to stimuli and are themselves more often activators than inhibitors [1]. In contrast, protein phosphatases are on average less regulated than the protein kinases and have broader substrate specificity, making them outgoing negative hubs. This balance may provide the genetic basis for the enrichment of sign-consistent positive feedback and feedforward loops in cell signalling networks in mammalian cells.
Mangan and Alon [19] reported the abundance of different configurations of three-node feedforward loops, in two of the networks also analysed here. Mangan and Alon suggested that some specific types of three-node feedforward loops, both positive ‘coherent’ and negative ‘incoherent’, are more abundant than others. However, Mangan and Alon did not make the case that positive feedforward loops are more abundant than negative feedforward loops. The authors explained that the AND version of the positive coherent feedforward loop is functionally advantageous because of its ability to cooperate and utilise both inputs. Here, we suggest that positive coherent loops, including feedback and feedforward of sizes 3–5, are advantageous for providing dynamical stability.
In conclusion, we have found that three intracellular regulatory networks in widely differing species are depleted in negative feedback and feedforward loops as compared with their corresponding shuffled networks. Links that contribute to negative feedback and feedforward loops can be easily removed to make these real networks sign-consistent because of over-representation of negative hubs. These results suggest that these networks may be close-to-monotone systems. The predictable dynamics established mathematically for monotone systems provide a useful basis for understanding why cells display dynamic stability.
4 Methods
4.1 Network data sets analysed
Signal transduction network representing interactions in mammalian neurons was assembled from literature [1] and downloaded from http://amp.pharm.mssm.edu/data/ 9.22.2004.sig.
E. coli transcriptional regulation data set [3] was downloaded from http://www.weizmann.ac.il/mcb/UriAlon/Network_motifs_in_coli/ColiNet-1.1/ on 4/15/2005. The updated version was downloaded from RegulonDB [2] on 9/6/2006. This network is available for download from our website at http://amp.pharm.mssm.edu/networks/ecoli.txt. Most of the analysis was applied on the older version to minimise computational load. The properties observed were verified also for the newer version.
S. cerevisiae gene regulatory data set [4] was down-loaded from http://www.weizmann.ac.il/mcb/UriAlon/Papers/networkMotifs/yeastData.mat and was created on 6/30/2006.
These networks are mostly directed graphs, but formally for the analysis we treated these as mixed graphs G = (V, A+, A−, E) with nodes/vertices (V) and three types of links/edges/arrows: activation arrows (A+), inhibition arrows (A−) and neutral (signalling) or dual regulation (gene regulation) edges (E). Neutral links in the signalling network represent interactions where the source and target relationships could not be easily determined, for example, scaffolding interactions [26]. The gene regulatory networks contain few bi-directional links, these are arrows drawn from the source to the target and from the target to the source and can have two negative, two positive signs, or both one negative and one positive [4]. All three networks are incomplete and represent only about 10% of the total number of components (genes or protein) in these systems. We use these networks since these are the most comprehensive networks available that provide signs for the links. A larger size yeast transcriptional network is available from Balaji et al. [27] but we did not use this network since the signs for the links are not specified.
4.2 Counting positive and negative cycles in the networks
In the mixed graphs G = (V, A+, A−, E) we analysed, a positive, sign-consistent feedback loop is defined as a closed path or cycle with no undirected edges (e) and where arrows (a) all point in the same orientation. Negative feedback loops contain an odd number of negative arrows (a−); otherwise, the feedback loop is considered positive. A feed forward loop is also defined as a closed path or cycle with no undirected edges (e) but here the arrows are divided into two paths with opposite orientations, such that the cycle has one ‘source’ node (a node with two outgoing arrows) and one ‘sink’ node (a node with two incoming arrows). Negative feedforward loops contain an odd number of negative arrows (a−); otherwise, the feedforward loop is considered positive. Similar formal definitions of this concept have been previously provided [1, 11, 26, 28]. A recursive algorithm that uses depth-first search was developed to count positive and negative feedback and feedforward loops [26]. The neutral links in the signalling network and bidirectional links in the gene regulatory networks have not been considered valid links when counting feedback and feedforward loops. Neutral and bidirectional links are not abundant in all three networks (Table 1) and considering these links as either negative or positive does not significantly affect our results.
4.3 Removing links that contribute to negative loops
The following algorithm was applied to eliminate negative feedback and feedforward loops of up to a certain size
Fig. 4 illustrates this concept on a toy network model. This algorithm was applied because removing all negative loops is NP-hard, although approximation algorithms for this task have been developed [29].
4.4 Creating shuffled networks
Three different types of shuffled networks were used as statistical control: random-swap, Erdos–Renyi and Maslov–Milo. Random-swap networks were created. Signs of links are randomly shuffled by picking randomly a pair of links and swapping their signs repeatedly. The random-swap networks maintain the same connectivity and the same ratio of negative to positive links as the original networks. Erdos–Renyi network contain the same number of nodes, the same number of links and the same types of links but links are randomly assigned to pairs of nodes. Maslov–Milo networks are created by repeatedly randomly picking a pair of interactions and swapping the interactions targets, such that source A points to target B and source B points to target A after the swap.
4.5 Modelling positive and negative feedforward loops
Two feedforward loops (Fig. 1) were simulated with ordinary differential equations. The same rate combinations and the same initial conditions were used for both circuits. The only difference is that the sign in one equation was changed from positive to negative to reflect the topological difference between the sign-consistent and sign-inconsistent feedforward loops. The following equations were used
Initial conditions were
The rates were:
Figure 7. Algorithm for finding feedback and feedforward loops.
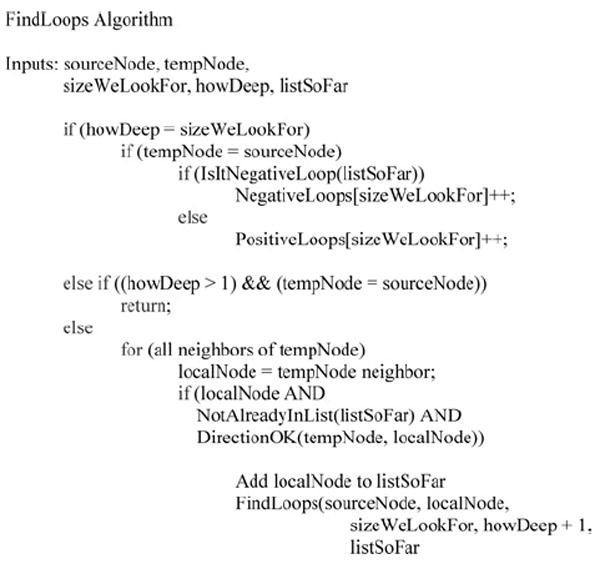
- Apply the algorithm described in Fig. 7 to find all the negative feedback and feedforward loops of a certain size.
- Sort links based on the number of times links participate in negative loops found in step 1.
- Remove the link that contributes to the most number of negative loops found in step 1.
- Repeat until there are no more negative loops of a certain size.
Acknowledgments
This research is supported by NIH grants GM-54508 to RI, and 1P50GM071558 SBCNY and NSF grant DMS-0614371 to EDS. We would like to thank Gustavo Stolovitzky and Guillermo Cecchi for useful discussions.
References
- 1.MA’AYAN A, JENKINS SL, NEVES S, et al. Formation of regulatory patterns during signal propagation in a mammalian cellular network. Science. 2005;309:1078–1083. doi: 10.1126/science.1108876. [DOI] [PMC free article] [PubMed] [Google Scholar]
- 2.SALGADO H, GAMA-CASTRO S, PERALTA-GIL M, et al. RegulonDB (version 5.0): Escherichia coli K-12 transcriptional regulatory network, operon organization, and growth conditions. Nucleic Acids Res. 2006;34:D394–397. doi: 10.1093/nar/gkj156. [DOI] [PMC free article] [PubMed] [Google Scholar]
- 3.SHEN-ORR SS, MILO R, MANGAN S, ALON U. Network motifs in the transcriptional regulation network of Escherichia coli. Nat Genet. 2002;31:64–68. doi: 10.1038/ng881. [DOI] [PubMed] [Google Scholar]
- 4.MILO R, SHEN-ORR S, ITZKOVITZ S, KASHTAN N, CHKLOVSKII D, ALON U. Network motifs: simple building blocks of complex networks. Science. 2002;298:824–827. doi: 10.1126/science.298.5594.824. [DOI] [PubMed] [Google Scholar]
- 5.COSTANZO MC, HOGAN JD, CUSICK ME, et al. The yeast proteome database (YPD) and Caenorhabditis elegans proteome database (WormPD): comprehensive resources for the organization and comparison of model organism protein information. Nucl Acids Res. 2000;28:73–76. doi: 10.1093/nar/28.1.73. [DOI] [PMC free article] [PubMed] [Google Scholar]
- 6.SONTAG ED. Monotone and near-monotone biochemical networks. Syst Syn Biol. 2007;1:59–87. doi: 10.1007/s11693-007-9005-9. [DOI] [PMC free article] [PubMed] [Google Scholar]
- 7.ANGELI D, FERRELL JE, JR, SONTAG ED. Detection of multistability, bifurcations, and hysteresis in a large class of biological positive-feedback systems. PNAS. 2004;101:1822–1827. doi: 10.1073/pnas.0308265100. [DOI] [PMC free article] [PubMed] [Google Scholar]
- 8.ANGELI D, SONTAG ED. Monotone control systems. IEEE Trans Autom Control. 2003;48:1684–1698. [Google Scholar]
- 9.HIRSCH M. Differential equations and convergence almost everywhere in strongly monotone flows. Contemp Math. 1983;17:267–285. [Google Scholar]
- 10.SMITH HL. Monotone dynamical systems: An introduction to the theory of competitive and cooperative systems. Amer Math Soc Providence. 1995 [Google Scholar]
- 11.SONTAG ED. Some new directions in control theory inspired by systems biology. Syst Biol. 2004;1:9–18. doi: 10.1049/sb:20045006. [DOI] [PubMed] [Google Scholar]
- 12.BHALLA US, RAM PT, IYENGAR R. MAP kinase phosphatase as a locus of flexibility in a mitogen-activated protein kinase signaling network. Science. 2002;297:1018–1023. doi: 10.1126/science.1068873. [DOI] [PubMed] [Google Scholar]
- 13.BHALLA US, IYENGAR R. Emergent properties of networks of biological signaling pathways. Science. 1999;283:381–387. doi: 10.1126/science.283.5400.381. [DOI] [PubMed] [Google Scholar]
- 14.MARKEVICH NI, HOEK JB, KHOLODENKO BN. Signaling switches and bistability arising from multisite phosphorylation in protein kinase cascades. J Cell Biol. 2004;164:353–359. doi: 10.1083/jcb.200308060. [DOI] [PMC free article] [PubMed] [Google Scholar]
- 15.FERRELL JE, JR, MACHLEDER EM. The Biochemical basis of an all-or-none cell fate switch in xenopus oocytes. Science. 1998;280:895–898. doi: 10.1126/science.280.5365.895. [DOI] [PubMed] [Google Scholar]
- 16.ALBERT R, OTHMER HG. The topology of the regulatory interactions predicts the expression pattern of the segment polarity genes in Drosophila melanogaster. J Theor Biol. 2003;223:1–18. doi: 10.1016/s0022-5193(03)00035-3. [DOI] [PMC free article] [PubMed] [Google Scholar]
- 17.VON DASSOW G, MEIR E, MUNRO EM, ODELL GM. The segment polarity network is a robust developmental module. Nature. 406:188–192. doi: 10.1038/35018085. [DOI] [PubMed] [Google Scholar]
- 18.WATTS DJ, STROGATZ SH. Collective dynamics of ‘small-world’ networks. Nature. 1998;393:440–442. doi: 10.1038/30918. [DOI] [PubMed] [Google Scholar]
- 19.MANGAN S, ALON U. Structure and function of the feedforward loop network motif. Proc Natl Acad Sci. 2003;100:11980–11985. doi: 10.1073/pnas.2133841100. [DOI] [PMC free article] [PubMed] [Google Scholar]
- 20.ERDOS P, RÉNYI A. On random graphs I. Publ Math Debrecen. 1959;6:290–297. [Google Scholar]
- 21.MASLOV S, SNEPPEN K. Specificity and stability in topology of protein networks. Science. 2002;296:910–913. doi: 10.1126/science.1065103. [DOI] [PubMed] [Google Scholar]
- 22.CUNNINGHAM TS, COOPER TG. Expression of the DAL80 gene, whose product is homologous to the GATA factors and is a negative regulator of multiple nitrogen catabolic genes in Saccharomyces cerevisiae, is sensitive to nitrogen catabolite repression. Mol Cell Biol. 1991;11:6205–6215. doi: 10.1128/mcb.11.12.6205. [DOI] [PMC free article] [PubMed] [Google Scholar]
- 23.CUNNINGHAM TS, RAI R, COOPER TG. The level of DAL80 expression down-regulates GATA factor-mediated transcription in Saccharomyces cerevisiae. J Bacteriol. 2000;182:6584–6591. doi: 10.1128/jb.182.23.6584-6591.2000. [DOI] [PMC free article] [PubMed] [Google Scholar]
- 24.SMITH HL. Monotone Dynamical Systems. 1995 [Google Scholar]
- 25.VENTER JC, ADAMS MD, MYERS EW, et al. The sequence of the human genome. Science. 2001;291:1304–1351. doi: 10.1126/science.1058040. [DOI] [PubMed] [Google Scholar]
- 26.MA’AYAN A, BLITZER RD, IYENGAR R. Toward predictive models of mammalian cells. Ann Rev Biophys Biomol Struct. 2005;34:319–349. doi: 10.1146/annurev.biophys.34.040204.144415. [DOI] [PMC free article] [PubMed] [Google Scholar]
- 27.BALAJI S, BABU MM, IYER LM, LUSCOMBE NM, ARAVIND L. Comprehensive analysis of combinatorial regulation using the transcriptional regulatory network of yeast. J Mol Biol. 2006;360:213–227. doi: 10.1016/j.jmb.2006.04.029. [DOI] [PubMed] [Google Scholar]
- 28.REMY E, MOSSE B, CHAOUIYA C, THIEFFRY D. A description of dynamical graphs associated to elementary regulatory circuits. Bioinformatics. 2003;19:172–178. doi: 10.1093/bioinformatics/btg1075. [DOI] [PubMed] [Google Scholar]
- 29.DASGUPTA B, ENCISO GA, SONTAG E, ZHANG Y. Algorithmic and complexity results for decompositions of biological networks into monotone subsystems. Biosystems. 2007;90:161–178. doi: 10.1016/j.biosystems.2006.08.001. [DOI] [PubMed] [Google Scholar]
- 30.GHOSH S, BALTIMORE D. Activation in vitro of NF-[kappa]B” by phosphorylation of its inhibitor I[kappa]B”. Nature. 344:678–682. doi: 10.1038/344678a0. [DOI] [PubMed] [Google Scholar]