

Abstract
Cell based microassays allow the screening of a multitude of culture conditions in parallel, which can be used for various applications from drug screening to fundamental cell biology research. Tubeless microfluidic devices based on passive pumping are a step towards accessible high throughput microassays, however they are vulnerable to evaporation. In addition to volume loss, evaporation can lead to the generation of small flows. Here, we focus on issues of convection and diffusion for cell culture in microchannels and particularly the transport of soluble factors secreted by cells. We find that even for humidity levels as high as 95%, convection in a passive pumping channel can significantly alter distributions of these factors and that appropriate system design can prevent convection.
Introduction
Increasing the density of cell experiments on a single device has been an area of active research. The promoting factors are the need for high throughput analysis for screening assays1,2 and reducing the use of sample/reagents, which are particularly rare for specific biological applications.3 Traditional methods lead the trend with multi-well plates (e.g. 96, 384 and 1536 well plates),4 however further increase in density using micro5 to picoliters6,7 of fluid can also be achieved using microfluidics. The enhanced fluid handling capabilities allow precise control of dosing, staining and washing of the cells.8 Additional features are enabled by microfluidics including the ability to tailor cell culture conditions.9–11 Long lasting concentration gradients,12,13 as well as spatial and temporal placement of cells and reagents,14,15 enable new possibilities for cell interaction study.
Different approaches have been proposed to provide microfluidic assays for cell biology that allow running all experiments and controls in parallel. Microfluidic devices have been demonstrated on glass, PDMS or PMMA substrate that integrate a high number of cell culture chambers.16,17 These devices allow single cell and time lapse imaging through high magnification microscopy.15,18
Another approach, in concept closer to traditional cell culture, as it shares most of the equipment and materials including micropipettes and polystyrene substrates, utilizes droplet dispensing for liquid handling. The culture environments exist as drops on a surface,19,20 or passive pumping can be used to flow the content of droplet in a microchannel.21,22 Both of these techniques present liquid–air interfaces that are susceptible to evaporation.
Two main effects occur as a consequence of evaporation. Volume loss, a well known problem quantified previously for droplet based assays, leads to variations of concentration and osmolarity in the liquid.23 Another consequence of evaporation is the creation of appreciable flows.24–27 Drops created by microdrop printing and electrowetting on dielectrics, with single air–liquid interfaces, present marangoni flows, causing mixing of the fluid.28–31 In microchannels bulk flow is generated, which can rival or surpass in magnitude the transport of compounds via diffusion.32
In the case of bare drops, the whole culture is encapsulated in a closed volume; therefore the accumulation of protein secreted by the cells is not prevented. Autocrine and paracrine signaling, occurring when a protein secreted in the fluid by a cell triggers a change in behavior of that cell or neighboring cells, is therefore not prevented. In channels, however, the flows can prevent accumulation of soluble factors and have impact on autocrine/paracrine effects.33,34 This has direct significance to cell signaling. Consequently, we focus here on analyzing cell microculture conditions in the case of a passive pumping device and the relationship with the macroscopic environment in which the device is placed.
First, an analytical model is used to estimate the magnitude of the flow in a passive pumping device for various humidity levels. A modified Peclet number is deduced, which allows characterization of the relative importance of convection and diffusion. Experimental and numerical simulations verify these results.
Analysis of evaporation in passive pumping
A method for autonomous generation of flow in a microchannel, requiring no external actuation, has been developed for high-throughput cell assays.22 It is based on the generation of a pressure differential created by surface tension. This is achieved in a simple channel that is open on both ends (Fig. 1).21 A large drop is placed on one end and creates lower pressure (due to the larger radius of curvature) than a small drop placed on the other end. This generates flow through the channel from the small drop to the large drop to re-equilibrate pressure, until only a small spherical cap of the same curvature radius as the large drop remains.35 Adding additional fluid to this bare port results in its flowing via passive pumping towards the larger drop. For the most common channels, this flow occurs rapidly and 5 μL typically disappears into the channel in 0.5 to 30 seconds.
Fig. 1.
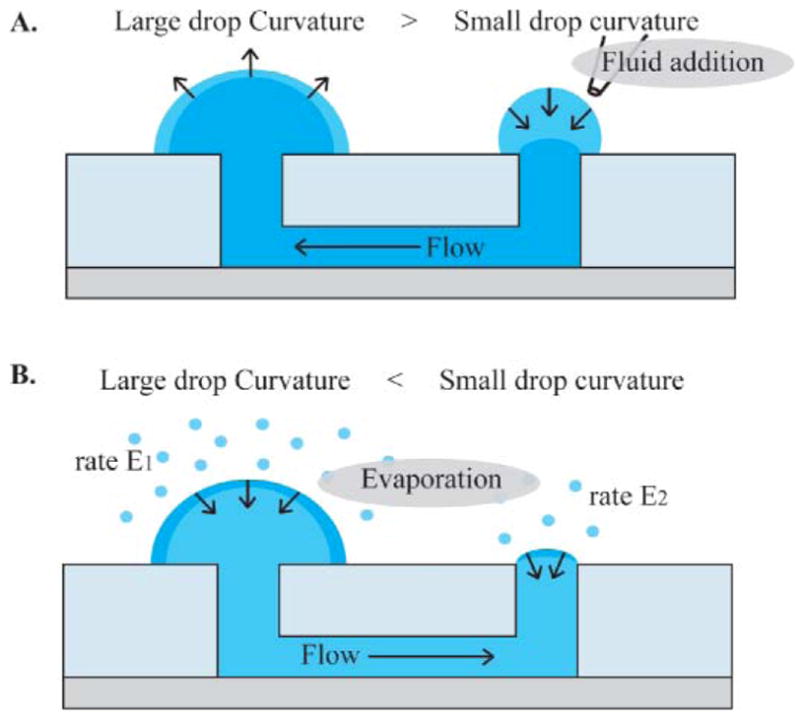
Schematic of a passive pumping device. A. Flowing fluid in the channel is effectuated by adding a drop to the port opposing the large drop. The subsequent increase of pressure due to the small curvature of the added drop provokes its flow towards the large drop until curvatures match. This happens in seconds to minutes. B. During the storage of the channel, as evaporation occurs both at the large and small drop, a decrease in volume will provoke more decrease in curvature in the small drop, and thus an unbalance of pressure in its favor. A flow will be generated from the large to the small drop, thus ensuring constant wetting of the port.
After equilibration, evaporation occurs on the large drop and bare port at rates E1 and E2, respectively (Fig. 1). This results in fluid flow, Q, from the large drop to the bare port.32 This flow is in the opposite direction to passive pumping flow used to fill the channel, and occurs over a much larger time scale. Most of the volume loss occurs at the large drop, as E1 is much larger than E2. However the evaporation at the bare port drives the flow. Hence, the volume loss and flow rate are analyzed independently.
Volume loss in a droplet based assay has been characterized previously and a dimensionless evaporation number, Ev, was determined to evaluate the magnitude of evaporation.23 Overall, in terms of amount of evaporation, the passive pumping assay behaves as an assay containing only the large drops of each channel, which can be used to calculate Ev and estimate the volume loss (E1 ≫ E2). Evaluation of the volume loss has specific interest in cell biology as it leads to changes in osmolarity, directly impacting cellular mechanisms. In the case of mouse embryonic cells for instance, an osmolarity shift of 5% can lead to modified growth and even cell death.36
Bulk flow in the channel occurs due to evaporation at the bare port. As the volume of the spherical cap on it is negligible (typically 0.2 μL compared to 10 μL for the large drop) we can assume that liquid lost by evaporation is replaced by fluid from the generated flow Q. Hence, the flow rate is equal to the evaporation rate at the bare port.
Evaporation of drops has been extensively studied.37–39 In the case of a hemispherical droplet, such as the large drop of a passive pumping channel, the evaporation rate, E1, scales with its radius and not its surface area (see ESI).‡ The interface of the bare port, however, resembles more a disk at the microfluidic port of radius Rw. In this case, the evaporation rate, E2, is described by eqn (1),37 and the evaporation rate scales with the radius of the disk. We define Dw, the diffusion coefficient of water vapor in air, ρ, the density of water and ΔCsat-i, the water vapor concentration difference between the air at the surface of the drop and the air far away from it:40
| (1) |
The calculation of E2 necessitates the knowledge of the water vapor concentration drop ΔCsat-i. The air close to liquid–air interfaces is saturated. The water vapor concentration of the air away from the drop is either directly measured or can be evaluated analytically, in the case of an inaccessible container. At equilibrium, the total evaporation rate from all drops is equal to the water vapor leak driven by diffusion out of the container. The humidity difference between the inside and outside of the container is defined as ΔCsat-e, and all drops have a radii R. As shown in a previous study, the magnitude of the leak depends on the geometry of the container which is characterized by a leakiness factor, ζ.23 For instance, a loosely sealed container will have a large value of ζ and will equilibrate at a lower humidity level. However if many drops are present more evaporation sources contribute in increasing the humidity in the container. Thus, ΔCsat-i is written 23 (ESI‡):
| (2) |
The variation of volume and the flow rate for a passive pumping channel with a 10 μL large drop and 400 μm port radii at 25 °C are plotted in Fig. 2. The variation of volume of the large drop is calculated for relative humidity (RH) levels varied from 10% to 100%. The flow rate is calculated as a function of the RH, and its validity was evaluated experimentally by placing a cap sealed with mineral oil on the large drop preventing evaporation (ESI).‡ Volume loss is only possible through flow and evaporation at the exposed port. The time for total volume loss provides an estimate of the flow rate averaged over the total duration of the experiment. Note that Fig. 2B is valid only for small variations of volume, as the evaporation rate varies as the large drop recedes. Nevertheless, this example illustrates the importance of evaporation even over short time scales and the strong flows generated. For cell biology, the consequences on the culture conditions, beyond shear stress effects,41 must be evaluated.
Fig. 2.
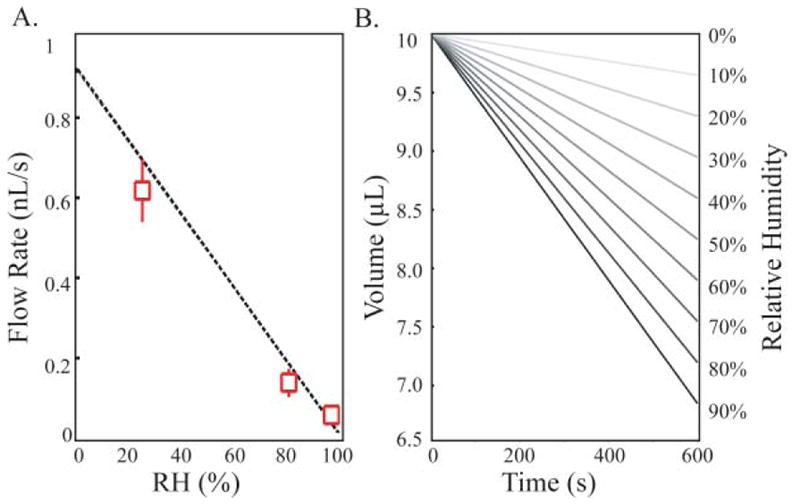
A. Flow rate in a passive pumping channel as a function of the relative humidity calculated using eqn (1) and experimental measures (crosses). B. Variation of volume of the large drop during evaporation for relative humidity (RH) varying from 10% to 100% (shades of grey). At 100% no loss of volume or flow occurs.
Competition of convection and diffusion
Presence of flow during cell culture can influence the ability of a cell to “sense” another (Fig. 3).42,43 In other words, endogenous factors secreted by the cell can trigger specific behaviors in neighboring cells via diffusion.34,44,45 A high level of convection may prevent a buildup of these proteins and change the global behavior of the cell colonies (Fig. 3).46 It is therefore important to evaluate the magnitude of this flow under different experimental conditions.
Fig. 3.
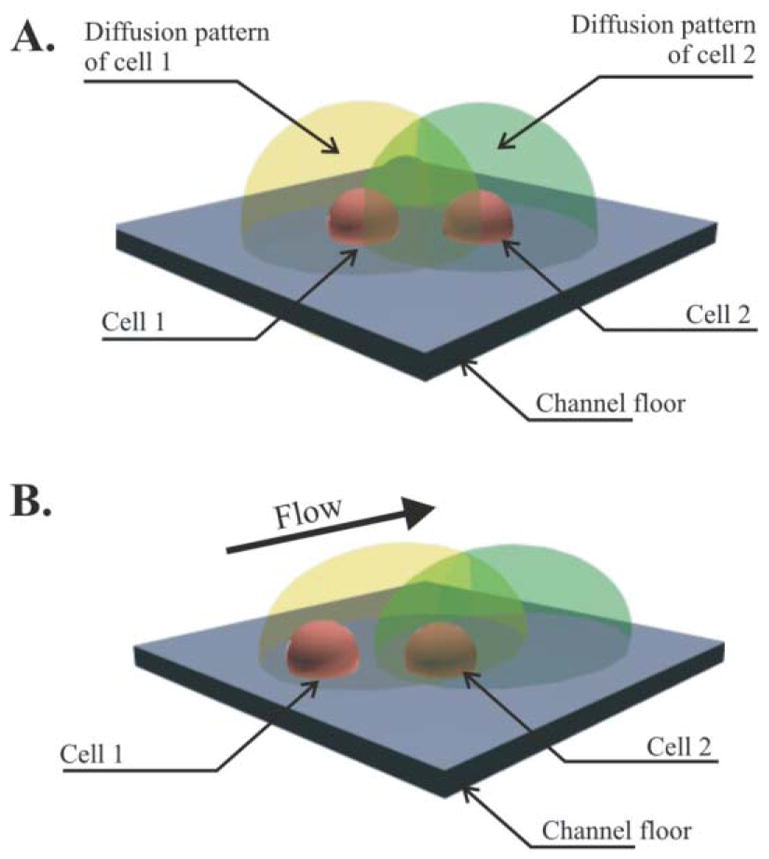
Cell culture in different situations. A: Diffusion dominates exchanges and cell 1 and 2 can interact. B: Convection is larger than diffusion and cell 1 and 2 are not in mutual interaction.
The Peclet number gives an indication of the relative importance of diffusion or convection in a channel. The expression of the flow rate given by (1) can be used to write a Peclet number for this setup, with Dp the diffusion constant of the particles of interest, L a characteristic length, Lh, the height of the channel and LD, the width of the channel:
| (3) |
One difficulty in using dimensionless numbers is the choice of characteristic parameters. In this case two approaches are possible. A characteristic length L can be chosen, such as the mean distance between signaling cells if this is known. A low Peclet number (Pe = 0.1) signifies that cell–cell signaling for that protein is relatively undisturbed at the length scale L. By choosing the characteristic length being the height of the channel, a small Peclet number signifies that the protein can mix vertically in the channel. In these conditions, a protein may not diffuse upstream along the whole length of the channel, yet is likely to accumulate downstream.
Another approach consists of setting a threshold Peclet number, 1 for instance, and determining diffusive lengths, L, of a species. This diffusive length represents the upstream distance from a cell secreting a protein over which soluble signaling is theoretically achievable (Fig. 4). Cells inside that radius can modify their behavior through paracrine signaling, while cells outside may not sense the presence of the secreting cell. In the case of a typical growth factor of molecular weight 10 kDa (Dp = 10−10 m2 s−1), for a device placed at a relative humidity (RH) of 0%, the diffusive radius L is about 25 μm, versus 50 μm when RH = 50% and 250 μm when RH = 90%. These observations are consistent with simulations performed in COMSOL, in which a 20 μm cell secreting such a particle is modeled (Fig. 5).
Fig. 4.
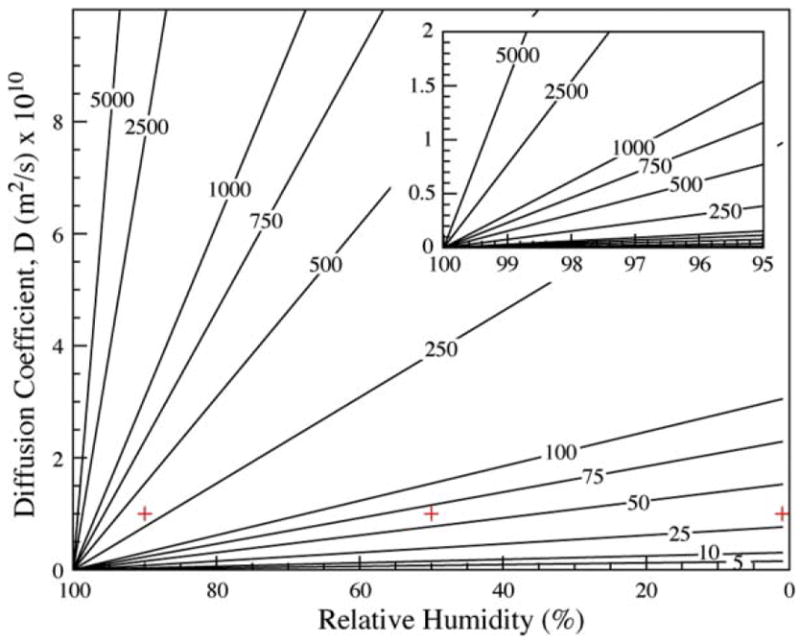
Diffusion radius, or achievable diffusion length, L, in micrometres around a cell secreting a signaling protein of diffusion constant Dp when the channel is placed in a relative humidity RH. High humidity (to the left) signifies low flow; therefore proteins diffuse far around the secreting cell. Large proteins (to the bottom) however diffuse slowly and therefore will not diffuse as far. Crosses indicate conditions simulated in Fig. 5.
Fig. 5.

Concentration of a secreted protein (Dp = 10−10 m2 s−1) in a channel viewed sideways around a 20 μm source cell. The modeling was effectuated on COMSOL for different values of the flow rate in a channel, corresponding to the different humidity conditions the device is placed in. Low humidity environment causes enhanced evaporation, thus strong flows, effectively washing secreted protein away. The channel is 150 μm tall, 750 μm wide and 5 mm long in total and only partially represented here.
The diffusive radius increases as the inverse of the humidity difference in eqn (3). For values of humidity close to saturation, a variation of few percent in the relative humidity can change the diffusive radius by millimetres (Fig. 4). This signifies that the distance for effective soluble factor signaling can vary from a fraction of the channel length to the entire channel with only a 1–5% change in RH.
Experimental observations
Experiments, detailed in the ESI,‡ have been performed to emphasize the necessity of quantifying evaporative flow. A bolus of dyes of various diffusion coefficients have been injected in the middle of a PDMS channel47,48 to observe the displacement of the fronts (Fig. 6). The ability of the dye to diffuse “upstream” provides evidence of diffusion dominating conditions, whereas little movement upstream suggests convection dominated conditions. Results are summarized in Table 1 and show good agreement with the calculated Peclet number eqn (3). Perhaps the most relevant observation is made for 10 kDa Dextran, which has a molecular weight in the range of many soluble signaling factors. Diffusion is dominant for no evaporation conditions, and convection becomes observable at 95% humidity.
Fig. 6.

Experimental setup for diffusion/convection measurements. Evaporation is controlled by leaving on or removing the lid.
Table 1.
Observation of convection or diffusion for various dyes at different humidity. Experimental result of the dominant condition is reported in the last column
| Fluorophore | RH | Dp/m2 s−1 | Pe | Observation |
|---|---|---|---|---|
| 1 μm beads | 50% | 5 × 10⁻¹² | 37 | Convection |
| 10kDa Dextran | 5 × 10⁻¹¹ | 3.7 | Convection | |
| Alexa488 | 2 × 10⁻¹⁰ | 0.9 | Both | |
| 1 μm beads | 95% | 5 × 10⁻¹² | 2.3 | Convection |
| 10kDa Dextran | 5 × 10⁻¹¹ | 0.2 | Both | |
| Alexa488 | 2 × 10⁻¹⁰ | 0.06 | Diffusion | |
| 1 μm beads | 100% | 5 × 10⁻¹² | 0 | Diffusion |
| 10kDa Dextran | 5 × 10⁻¹¹ | 0 | Diffusion | |
| Alexa488 | 2 × 10⁻¹⁰ | 0 | Diffusion |
Discussion
As we have shown, continuous evaporation will cause flows in the device. If only a single surface is present, Marangoni flows occur. However, in a device with two or more linked liquid–air interfaces, bulk fluid flow appears. For an experiment containing a particle with diffusion constant D, the criteria to assess when diffusion or convection dominates is given by the dimensionless Peclet number eqn (3).
Fig. 4 illustrates the sensitivity of biological experiments in high humidity conditions, where several percent change can have a strong impact on the diffusive radius of a particle. This point is specifically important as humidity in an incubator varies locally from 90 to 100% depending on proximity to the door or the water tray for instance. To preserve autocrine and paracrine effects the presented device (Fig. 1) should be operated at a minimum humidity of 95%. Under lower levels of humidity the critical proteins secreted by neighboring cells may be washed away by convection.
Convective flow rate scales with geometry. Velocities increase for smaller channel cross-sections at the same RH. Therefore, greater control of the atmosphere surrounding the liquid must be achieved as channel volumes decrease. Moreover, the diffusion rate of the particle of interest is important in determining the requirements for humidity control as it will be almost impossible to eliminate convective effects for large particles. Special care can be taken in designing the device, such as increasing the cross-sectional area, adding alternate paths for flow to reduce convection in the areas of interest, or reducing the evaporative surface at the port.
Finally, reducing convective flows can be simply and reliably achieved using a double container with sacrificial water to maximize the humidity around the drops of interest. Placing sacrificial water around the device allows raising humidity close to saturation. Still, leakage can cause persistent evaporation. Placing the container containing the channels and sacrificial water in a larger container containing sacrificial water reduces the effects of these leaks significantly.
Conclusion
As microfluidics enables increased throughput and functionality in cell biology studies, the necessity of evaluating the practical consequences of the technology become more important. In the case of tubeless approaches, evaporation is a particularly important parameter. Evaporation causes volume loss and consequently osmolarity changes. We have evaluated the magnitude of this phenomenon using the evaporation number Ev developed for droplet based assays containing sacrificial drops.23 For passive pumping channels, evaporation generates bulk flows. This convection competes with diffusion driven transport of soluble proteins and may cause disruption in cell–cell interactions. Analyses of evaporation allowed the evaluation of the magnitude of the flow as a function of the humidity conditions around the channel and its geometry. From this a modified Peclet number, Pe, was deduced allowing quantification of the relative dominance of convection or diffusion.
The analysis and experimental results suggest that both potential osmolarity variations and flow are not an obstacle, provided appropriate experimental precautions are taken. Proper experimental setup of the devices assures operation in an appropriate space defined by the evaporation number, Ev, and the Peclet number, Pe. Furthermore these analyses not only enable finding conditions for low volume loss and convection, but also assist in designing systems to leverage evaporative flows to advantage.
Supplementary Material
Acknowledgments
This work was supported by funding from the MacDiarmid Institute for Advanced Materials and Nanotechnology (EB), the National Library of Medicine (JW–NLM #5T15LM007359) and NIH R21 #CA122672 and K25 #CA104162. The authors thank all members of the MMB Lab for helpful insights, knowledge and contribution.
Footnotes
For Part 1 see ref. 23.
Electronic supplementary information (ESI) available: Appendices 1–5. See DOI: 10.1039/b717423c
This PDF receipt will only be used as the basis for generating PubMed Central (PMC) documents. PMC documents will be made available for review after conversion (approx. 2–3 weeks time). Any corrections that need to be made will be done at that time. No materials will be released to PMC without the approval of an author. Only the PMC documents will appear on PubMed Central -- this PDF Receipt will not appear on PubMed Central.
Notes and references
- 1.Khandurina J, Guttman A. J Chromatogr, A. 2002;943:159–183. doi: 10.1016/s0021-9673(01)01451-0. [DOI] [PubMed] [Google Scholar]
- 2.Mere L, Bennett T, Coassin P, England P, Hamman B, Rink T, Zimmerman S, Negulescu P. Drug Discov Today. 1999;4:363–369. doi: 10.1016/s1359-6446(99)01377-x. [DOI] [PubMed] [Google Scholar]
- 3.Sia SK, Linder V, Parviz BA, Siegel A, Whitesides GM. Angew Chem, Int Ed. 2004;43:498–502. doi: 10.1002/anie.200353016. [DOI] [PubMed] [Google Scholar]
- 4.Silverman L, Campbell R, Broach JR. Curr Opin Chem Biol. 1998;2:397–403. doi: 10.1016/s1367-5931(98)80015-x. [DOI] [PubMed] [Google Scholar]
- 5.Beebe DJ, Mensing GA, Walker GM. Annu Rev Biomed Eng. 2002;4:261–286. doi: 10.1146/annurev.bioeng.4.112601.125916. [DOI] [PubMed] [Google Scholar]
- 6.Haeberle S, Zengerle R. Lab Chip. 2007;7:1094–1110. doi: 10.1039/b706364b. [DOI] [PubMed] [Google Scholar]
- 7.Outlaw WH, Zhang SQ. J Exp Botany. 2001;52:605–614. [PubMed] [Google Scholar]
- 8.Warrick J, Meyvantsson I, Ju JI, Beebe DJ. Lab Chip. 2007;7:316–321. doi: 10.1039/b613350a. [DOI] [PubMed] [Google Scholar]
- 9.Sia SK, Whitesides GM. Electrophoresis. 2003;24:3563–3576. doi: 10.1002/elps.200305584. [DOI] [PubMed] [Google Scholar]
- 10.Takayama S, Ostuni E, LeDuc P, Naruse K, Ingber DE, Whitesides GM. Nature. 2001;411:1016–1016. doi: 10.1038/35082637. [DOI] [PubMed] [Google Scholar]
- 11.Breslauer DN, Lee PJ, Lee LP. Mol Biosyst. 2006;2:97–112. doi: 10.1039/b515632g. [DOI] [PubMed] [Google Scholar]
- 12.Abhyankar VV, Lokuta MA, Huttenlocher A, Beebe DJ. Lab Chip. 2006;6:389–393. doi: 10.1039/b514133h. [DOI] [PubMed] [Google Scholar]
- 13.Chung BG, Flanagan LA, Rhee SW, Schwartz PH, Lee AP, Monuki ES, Jeon NL. Lab Chip. 2005;5:401–406. doi: 10.1039/b417651k. [DOI] [PubMed] [Google Scholar]
- 14.Abhyankar VV, Beebe DJ. Anal Chem. 2007;79:4066–4073. doi: 10.1021/ac062371p. [DOI] [PubMed] [Google Scholar]
- 15.Whitesides GM. Nature. 2006;442:368–373. doi: 10.1038/nature05058. [DOI] [PubMed] [Google Scholar]
- 16.Hung PJ, Lee PJ, Sabounchi P, Lin R, Lee LP. Biotechnol Bioeng. 2005;89:1–8. doi: 10.1002/bit.20289. [DOI] [PubMed] [Google Scholar]
- 17.Zhu XY, Chu LY, Chueh BH, Shen MW, Hazarika B, Phadke N, Takayama S. Analyst. 2004;129:1026–1031. doi: 10.1039/b407623k. [DOI] [PubMed] [Google Scholar]
- 18.Yang MS, Li CW, Yang J. Anal Chem. 2002;74:3991–4001. doi: 10.1021/ac025536c. [DOI] [PubMed] [Google Scholar]
- 19.Cho SK, Moon HJ, Kim CJ. J Microelectromech Syst. 2003;12:70–80. [Google Scholar]
- 20.Su F, Chakrabarty K, Fair RB. IEEE Trans Computer-Aided Des Integr Circuits Syst. 2006;25:211–223. [Google Scholar]
- 21.Walker GM, Beebe DJ. Lab Chip. 2002;2:131–134. doi: 10.1039/b204381e. [DOI] [PubMed] [Google Scholar]
- 22.Meyvantsson I, Warrick J, Hayes S, Skoien A, Beebe DJ. Lab Chip. 2008;8 doi: 10.1039/b715375a. [DOI] [PubMed] [Google Scholar]
- 23.Berthier E, Warrick J, Yu H, Beebe DJ. Lab Chip. 2008;8 doi: 10.1039/b717422e. [DOI] [Google Scholar]
- 24.Nilson RH, Tchikanda SW, Griffiths SK, Martinez MJ. Int J Heat Mass Transfer. 2006;49:1603–1618. [Google Scholar]
- 25.Hisatake K, Tanaka S, Aizawa Y. J Appl Phys. 1993;73:7395–7401. [Google Scholar]
- 26.Effenhauser CS, Harttig H, Kramer P. Biomed Microdev. 2002;4:27–32. [Google Scholar]
- 27.Goedecke N, Eijkel J, Manz A. Lab Chip. 2002;2:219–223. doi: 10.1039/b208031c. [DOI] [PubMed] [Google Scholar]
- 28.Deegan RD, Bakajin O, Dupont TF, Huber G, Nagel SR, Witten TA. Nature. 1997;389:827–829. doi: 10.1103/physreve.62.756. [DOI] [PubMed] [Google Scholar]
- 29.Hu H, Larson RG. Langmuir. 2005;21:3963–3971. doi: 10.1021/la047528s. [DOI] [PubMed] [Google Scholar]
- 30.Hu H, Larson RG. Langmuir. 2005;21:3972–3980. doi: 10.1021/la0475270. [DOI] [PubMed] [Google Scholar]
- 31.Zhang N, Yang WJ. J Heat Transfer. 1982;104:656–662. [Google Scholar]
- 32.Walker GM, Beebe DJ. Lab Chip. 2002;2:57–61. doi: 10.1039/b202473j. [DOI] [PubMed] [Google Scholar]
- 33.Atencia J, Beebe DJ. Nature. 2005;437:648–655. doi: 10.1038/nature04163. [DOI] [PubMed] [Google Scholar]
- 34.Hui EE, Bhatia SN. Proc Natl Acad Sci U S A. 2007;104:5722–5726. doi: 10.1073/pnas.0608660104. [DOI] [PMC free article] [PubMed] [Google Scholar]
- 35.Berthier E, Beebe DJ. Lab Chip. 2007;7:1275–1478. doi: 10.1039/b707637a. [DOI] [PubMed] [Google Scholar]
- 36.Heo YS, Cabrera LM, Song JW, Futai N, Tung YC, Smith GD, Takayama S. Anal Chem. 2007;79:1126–1134. doi: 10.1021/ac061990v. [DOI] [PMC free article] [PubMed] [Google Scholar]
- 37.Poulard C, Guena G, Cazabat AM. J Phys: Condens Matter. 2005;17:S4213–S4227. [Google Scholar]
- 38.Cachile M, Benichou O, Poulard C, Cazabat AM. Langmuir. 2002;18:8070–8078. [Google Scholar]
- 39.Meric RA, Erbil HY. Langmuir. 1998;14:1915–1920. [Google Scholar]
- 40.Kuz VA. J Appl Phys. 1991;69:7034–7036. [Google Scholar]
- 41.Malek AM, Izumo S. J Cell Sci. 1996;109:713–726. doi: 10.1242/jcs.109.4.713. [DOI] [PubMed] [Google Scholar]
- 42.Yu HM, Meyvantsson I, Shkel IA, Beebe DJ. Lab Chip. 2005;5:1089–1095. doi: 10.1039/b504403k. [DOI] [PubMed] [Google Scholar]
- 43.Yu HM, Alexander CM, Beebe DJ. Lab Chip. 2007;7:726–730. doi: 10.1039/b618793e. [DOI] [PubMed] [Google Scholar]
- 44.Lauffenburger D, Cozens C. Biotechnol Bioeng. 1989;33:1365–1378. doi: 10.1002/bit.260331102. [DOI] [PubMed] [Google Scholar]
- 45.Berg HC, Purcell EM. Biophys J. 1977;20:193–219. doi: 10.1016/S0006-3495(77)85544-6. [DOI] [PMC free article] [PubMed] [Google Scholar]
- 46.Walker GM, Sai JQ, Richmond A, Stremler M, Chung CY, Wikswo JP. Lab Chip. 2005;5:611–618. doi: 10.1039/b417245k. [DOI] [PMC free article] [PubMed] [Google Scholar]
- 47.Duffy DC, McDonald JC, Schueller OJA, Whitesides GM. Anal Chem. 1998;70:4974–4984. doi: 10.1021/ac980656z. [DOI] [PubMed] [Google Scholar]
- 48.Jo BH, Van Lerberghe LM, Motsegood KM, Beebe DJ. J Microelectromech Syst. 2000;9:76–81. [Google Scholar]
Associated Data
This section collects any data citations, data availability statements, or supplementary materials included in this article.