

Abstract
Background and Objective
Evidence-based second stage translational studies are necessary and difficult to evaluate. A quasi-experimental design is used to compare the rate of fall-related health care utilization of two geographically disparate areas in Connecticut, a small state in the northeastern United States, to evaluate an intervention designed to reduce fall-related injuries among older persons. This evaluation examines the two years immediately prior to intervention.
Methods
The experimental units are postal (i.e., zip) code tabulation areas (ZCTAs) in which counts of fall-related health care utilization and demographic characteristics can be gathered from local and federal public health sources. We employ hierarchical modeling to determine whether there was a difference in fall-related health care utilization between the study arms prior to initiating the intervention. Geographic information systems are used to characterize neighboring ZCTAs and to graph model-adjusted rates of fall-related utilization.
Results
After adjustment for covariates and spatial variation, we observed no significant difference between rates or temporal trends of fall-related health care utilization in the study arms over the two year pre-intervention period.
Conclusion
The study arms of the Connecticut Collaboration for Falls Prevention have equivalent rates and temporal trends of fall-related utilization over the two year pre-intervention period.
Keywords: Hierarchical modeling, bias, second stage translational research, spatial analysis, quasi-experimental design
The Connecticut Collaboration for Fall Prevention (CCFP) is a longitudinal translational study seeking to demonstrate the feasibility of reducing the fall-related injury rate among older people through a professional behavioral change intervention based on risk factors identified in the Yale Frailty and Injuries: Cooperative Studies of Intervention Techniques and other clinical trials. [1, 2] Seven targeted risk factors included walking and transfer difficulty, balance impairment, postural hypotension, use of four or more medications, foot and vision problems and home fall hazards. Interventions known to rectify each targeted risk factor were included in dissemination and training materials. The CCFP employed professional behavior-change strategies to encourage healthcare providers and healthcare facilities throughout the intervention area to incorporate evidence-based fall assessment and management strategies into their practices were described previously. [3] Although the CCFP started to monitor injurious falls in October 1999, the professional change outreach efforts did not begin until October 2001. The intervention was not expected to be fully implemented until later on in the study. Like any large scale community health project, the design and analysis of this study entail a number of important statistical considerations.
First is that for practical reasons translational studies often do not lend themselves to randomization, the statistical cornerstone of randomized controlled trials (RCTs). Second is that protection of participant confidentiality often mandates that these interventions are not assessed on an individual basis, but rather for a community or geographical area as a whole. A geographically aggregate measure of outcome potentially biases the estimated effect in a manner referred to as ecological fallacy. [4] To satisfy these constraints on randomization and outcome measure, observational studies based on quasi-experimental designs are often used. [5] Because such designs do not have all of the statistical strengths of an RCT, the final probability statements of the analysis are sometimes labeled “plausibility” statements. [6] This terminology is an acknowledgement of the potential for bias arising from non-randomized assignment and use of an aggregate measure of outcome.
The translation of results from highly controlled RCTs to a more general setting is referred to either as second stage translational research or the T2 application phase and is a topic of great interest to the medical research community. [7–9] The first stage established the efficacy of the CCFP’s interventional components in an RCT. [1] We posit that the quasi-experimental design described here is a statistically valid approach for evaluating how well this clinically efficacious strategy translates into the setting of actual clinical practices. The hypothesis of this article is whether the pre-intervention rates of fall-related healthcare utilization of the study arms are significantly different.
The CCFP employed a quasi-experimental design which compared a treatment area that received the intervention and a “usual care” control area which did not. Although both study arms are within Connecticut, they are geographically disjoint to limit contamination bias from the dissemination of interventional knowledge. The intervention arm was in north-central Connecticut while the usual care arm was located along the I-95 corridor from Norwalk to New London. To balance requirements for participant anonymity and an adequate number of sampling units, postal (i.e., ZIP) code tabulation areas (ZCTAs) were chosen as the experimental unit. ZCTAs were created by the US Census Bureau to satisfy the demand of researchers for a bounded areal unit corresponding to the ZIP codes used by the US Postal Service.
METHODS
Study Population
The study population consists of persons seventy years and older living in ZCTAs within the intervention and usual care arms. Persons aged 70 and older were studied because epidemiological studies have shown that fall rates begin to dramatically increase at this age. [10,11] The intervention area consists of 58 ZCTAs and the usual care area of 53. Because randomization was not possible, the two areas were chosen to be as similar as possible on important socio-demographic summary measures, such as population, median income and racial makeup, as well as on descriptive statistics of hospital and emergency departments (Table 1).
Table 1.
Characteristics of the Intervention and Usual Care areas
| Population Characteristics1 | Median % (Inter-quartile Interval) | |
|---|---|---|
| Intervention area (53 zctas) | Usual care area (58 zctas) | |
| Persons aged 70 years and over | n = 95,433 | n = 109,413 |
| Female, aged 70+ | 60.7 (58.0 – 62.4) | 60.8 (58.7 – 62.5) |
| Race, aged 70+ | ||
| White | 98.0 (96.1 – 98.9) | 97.3 (88.5 – 98.5) |
| Black | 0.8 (0.3 – 1.9) | 1.6 (0.5 – 8.0) |
| Other | 1.2 (0.6 – 1.8) | 1.5 (1.0 – 3.1) |
| Hispanic or Latino, aged 70+ | 0.5 (0 – 1.4) | 0.7 (0.2 – 2.7) |
| Persons aged 65 years and over | n = 125,067 | n = 145,296 |
| Education level, aged 65+ | ||
| High school graduate or less | 66.3 (52.1 – 74.6) | 63.9 (49.3 – 72.9) |
| Some college or more | 33.7 (25.4 – 47.9) | 36.1 (27.1 – 50.7) |
| Householders, aged 65+ | n = 78,195 | n = 91,800 |
| 1999 Household income <$15,000 | 19.6 (13.9 – 25.9) | 18.6 (13.4 – 28.4) |
| 1999 Household income >$75,000 | 13.2 (10.2 –19.2) | 17.2 (10.4 – 25.1) |
| Below Poverty Level, persons aged 65+ | 5.5 (3.0 – 8.0) | 5.4 (4.0 – 8.6) |
| Living in an institution, persons aged 65+ | 4.8 (0 – 9.3) | 3.7 (0 – 8.1) |
| Non-institutionalized persons aged 65+ with physical disability, | 22.0 (19.1 – 27.0) | 22.1 (18.8 – 26.8) |
| Annualized Pre-intervention Rates of Fall-Related Healthcare Utilization per 1000 population 70+ during first pre-intervention year 2,3 (95% confidence interval) | 54.6 (48.0, 61.2) | 56.8 (50.6, 63.0) |
| Hospital and emergency department data2 | ||
| Number of hospitals (number of beds) | 7 (2303) | 7 (2505) |
| Mean number of beds/hospital | 329 | 358 |
| Total adult discharges, 2003 | 70,084 | 77,230 |
| Mean number of discharges/hospital | 10,012 | 11,033 |
| Total adult ED visits, 2000 | 351,515 | 356,847 |
| Mean number of ED visits/hospital | 50,216 | 50,978 |
Data from 2000 U.S. Census
Hospital and emergency department data and counts of fall-related healthcare utilization are from CHIME (Connecticut hospital utilization database)
Denominators of fall-related healthcare utilization rates are from the 2000 U.S. Census (www.census.gov)
Data
The data for this study consists of records yielding numerator and denominator of the rate of fall-related utilization of hospitals and emergency departments for a particular ZCTA stratified by age group and sex. The data is gathered on a fiscal year basis where fiscal year 2000 runs from October of 1999 through September of 2000. Fall-related utilization is recorded at hospitals and emergency departments and we have aggregated them over six month periods in fiscal years 2000 and 2001 using data for each ZCTA supplied by the Connecticut Hospital Association (CHA). This numerator is the number of fall-related utilizations of hospitals and emergency departments where persons’ home addresses lie within a particular ZCTA and is procured through the Connecticut Health Information Management Exchange (CHIME) database maintained by CHA. Because the analysis presented here only considers the two years of pre-intervention (fiscal years 2000 and 2001), we are using the ZCTA population estimates for persons 70 years and older provided by the US 2000 national census. These data sources represent the most temporally accurate estimates of both numerator and denominator for these two pre-intervention years of the study.
Analysis
Descriptive statistics for each study arm were estimated using medians and inter-quartile range for continuous measures and counts of hospital or emergency department characteristics.
The analysis is based on Bayesian hierarchical modeling of ZCTA rates of fall-related hospital or emergency department utilization as a function of study arm in the pre-intervention period, while controlling for the fixed covariates age, sex, year of study, interaction between year and study arm, and US 2000 national census estimates for: proportion of non-white residents >= 65 years, proportion of persons >= 65 years with a reported income =< $15,000 or >= $75,000, proportion of persons >= 65 years_institutionalized, and proportion of community-living persons >= 65 years with physical disability.
Because the outcome is a count of fall-related utilizations, the Poisson is the natural choice of distribution. The expected number of fall-related utilizations of hospital or emergency department for each ZCTA within a particular time period is modeled as the product of the population at risk and the expected rate of fall-related utilizations. The logarithm of the expected rate of fall-related utilizations of each sex-age combination within a specific period of time within each ZCTA is consequently modeled as a linear combination of fixed and random effects.
Because the ZCTAs in each study arm have one or more neighbors, they cannot be viewed as independent samples and any estimation should account for this geographical correlation. The model therefore needs to account for the geographical correlation structure pertaining to each ZCTA.
The random effects, representing geographic correlations, are nested within ZCTAs, which are themselves nested within the periods of study. The random effects representing non-spatial variability are nested within each of the 8 sex-age groupings within each ZCTA during each time period. This nesting of the components of variability from spatial and non-spatial considerations enables reduced-bias estimates of the fixed effects. [12, 13] Our nesting of random terms for non-spatial variability corresponding to specific sex and age subpopulations within each ZCTA is a modification of the approach of Waller et al (1997). [13]
Description of Fixed Effects in the Model
The outcome of the model is the log of the expected rate of fall-related utilization for a specific sex and age grouping within each ZCTA for a specific six-month period of time. Age is an ordinal variable that takes on values from 1 through 4 corresponding to the four age ranges of 70–74, 75–79, 80–84, and 85 years and older. The linearity of this relationship was confirmed with graphs of the log-transform of the mean number of falls for each age grouping. The covariates sex and year of study are binary variables, and the proportion of non-white residents >= 65 years, proportion of persons >= 65 years with a reported income =< $15,000 or >= $75,000, proportion of persons >= 65 years institutionalized, and proportion of community-living persons > 65 years with physical disability are continuous. Within each ZCTA in any specific time period there are eight different sex-age groups being considered. The variable representing study arm in the pre-intervention period is a binary variable with 0 and 1 respectively representing the areas which will be the “usual care” and intervention arms. The interaction of study arm and year is needed to evaluate whether the temporal trends of the fall rates in the two study arms are equivalent over the two year pre-intervention period.
We include these fixed covariates in the hierarchical model because we are interested in seeing whether the rate of fall-related utilization is the same in the two study arms after adjusting for the geographically induced correlation structure of our experimental units, i.e., the ZCTAs, and important covariates.
Description of Random Effects in the Model
As stated earlier, the random effects are necessary to adjust for the dependency of each ZCTA’s rate of fall-related utilization on those of its geographic neighbors. [12, 13] In contrast with the fixed effects, the random effects are not directly measurable. In each study arm, the spatial variability effects are separately modeled with conditionally autoregressive models that quantify how the rate of fall-related utilization in any particular ZCTA is related to those of its neighbors. The second random component represents other non-spatial sources of variability and is unique for each of the sex-age groupings of each ZCTA within each time period. As recommended in the literature, a Bayesian approach was employed for purposes of estimation. [12–15]
We used ArcGIS software to create maps and weighting of neighboring ZCTAs and implemented the model using the WinBUGS programming package (http://www.mrc-bsu.cam.ac.uk/bugs/welcome.shtml). We interpret a parameter as statistically significant when its 95% credible interval does not include zero.
Methods to test spatial variability
In order to demonstrate the need for the spatial variability term, we first model the rate of fall-related utilization using all the fixed effects terms and only the random effect for non-spatial variability. We then repeat the same model with inclusion of the spatial variability terms. For both spatial and non-spatial models we ran our Markov Chain Monte Carlo simulation for a post-convergence sample of 5000 after an initial burn in period of 5000 iterations across the five chains. Convergence was verified with graphical analysis and the Gelman-Rubin statistic as modified by Brooks. [16]
RESULTS
The demographic characteristics of the study arms are in Table 1 where for each characteristic listed the median proportion of the ZCTAs within each study arm is provided along with its interquartile interval. The interquartile interval is centered around the median and accounts for 50% of the distribution. The measures of central tendency closely agree for the study arms with a few exceptions. Although there is a great deal of overlap in their distributions, the proportion of older black residents in the usual care arm is roughly double that in the intervention arm. Note that the annualized pre-intervention rates of fall-related healthcare utilization between the two study arms are very close and that because their 95% confidence intervals overlap substantially, they are not statistically different. Because these rates are unadjusted for important covariates, a model-based comparison is needed to verify that the adjusted rates are not significantly different.
For models with and without spatial variability, in Table 2 we provide the coefficient of each explanatory variable’s rate ratio and its 95% credible interval, i.e., the Bayesian counterpart to the classical confidence interval. Note that the 95% credible intervals of the estimated study arm effect in both models include the null value. This indicates that after adjustment for the covariates in Table 1, there is no significant difference in the rates between the study arms. A secondary aim of this analysis is to demonstrate that there is no significant difference between the temporal trends of the rate of fall-related health utilization in the study arms over the pre-intervention period. This is accomplished by comparing the interaction between year and study arm in the models with and without the spatial variability terms. The non-significance of the interaction term in Table 2 for both models indicates that the temporal trends of the rates of fall-related utilization of the study arms are not different throughout the pre-intervention period.
Table 2.
Model Results for Rate of Fall-Related Utilization Over Two Pre-intervention Years (October 1999 – September 2001)
| Coefficient of Rate Ratio (95% Credible Interval a) | ||
|---|---|---|
| Predictor | No Spatial Term | With Spatial Term |
| Study Arm | 0.0258 (−0.029, 0.078) | 0.0041 (−0.047, 0.056) |
| Year | 0.0639 (0.011, 0.116) | 0.0692 (0.021, 0.120) |
| Study Arm by Year | 0.0223 (−0.052, 0.096) | 0.0356 (−0.038, 0.105) |
| Sex | 0.2965 (0.254, 0.338) | 0.3004 (0.262, 0.337) |
| Age | 0.4724 (0.451, 0.495) | 0.4737 (0.450, 0.496) |
| Proportion of Older Patients b With annual income <= 15k | 0.3095 (0.140, 0.483) | 0.1933 (−0.028, 0.385) |
| Proportion of Older Patients b With annual income >= 75k | 0.0275 (−0.153, 0.209) | 0.0435 (−0.179, 0.282) |
| Proportion of Older Patients b Institutionalized | 0.6027 (0.364, 0.831) | 0.2733 (−0.003, 0.533) |
| Proportion of Older Patients b Non-institutionalized with physical disability | 0.1227 (−0.136, 0.389) | 0.0626 (−0.195, 0.327) |
| Proportion of Nonwhite Older Patients b | −0.1002 (−0.244, 0.043) | −0.0192 (−0.200, 0.160) |
A credible interval is the Bayesian analog of the classical confidence interval.
A credible interval exclusive of 0 for Study Arm would be interpreted as significant.
Older patients are >= 65 years of age, data taken from 2000 U.S. census (www.census.gov)
For model comparison Table 3 provides the Dbar (posterior mean of the −2 log-likelihoods), Dhat (−2 log-likelihood of the posterior means) and the deviance information criterion (DIC). [17] Because lower values for these statistics indicate better fit, the model with spatial variability is favored by its lower values of Dbar, Dhat and DIC. Nesting random terms for non-spatial variability corresponding to specific sex and age subpopulations within each ZCTA resulted in substantially lower DIC values than use of either random effect without the other.
Table 3.
Model Fitting Statistics for Models With and Without Spatial Terms
| Model Fitting Statistics (lower is better) | Model With No Spatial Term | Model With Spatial Term |
|---|---|---|
| Dbar (posterior mean of −2logL) | 14313.9 | 14132.7 |
| Dhat (−2logL of posterior means) | 13034.7 | 12997.6 |
| DIC (Deviance Information Criterion) | 15593.2 | 15267.7 |
The significantly positive associations between rate of fall-related utilization and the socio-demographic variables sex and age are strongly corroborated in the literature. [11, 18]. It is interesting to note that the other covariates are geographically based metrics of income and health status. For each of these ZCTA-based covariates, the inclusion of the spatial variability terms in each case either reduces the effect size and or widens the credible interval. Specifically, for proportion of older persons with annual income =< $15,000 and proportion of older persons institutionalized, the credible intervals are modified to include the null value. This indicates that the spatial variability terms are accounting for much of what these geographically fixed effects account for in the non-spatial model. Figure 1 depicts the model adjusted rates of each ZCTA in the study averaged over the two pre-intervention years.
Figure 1.
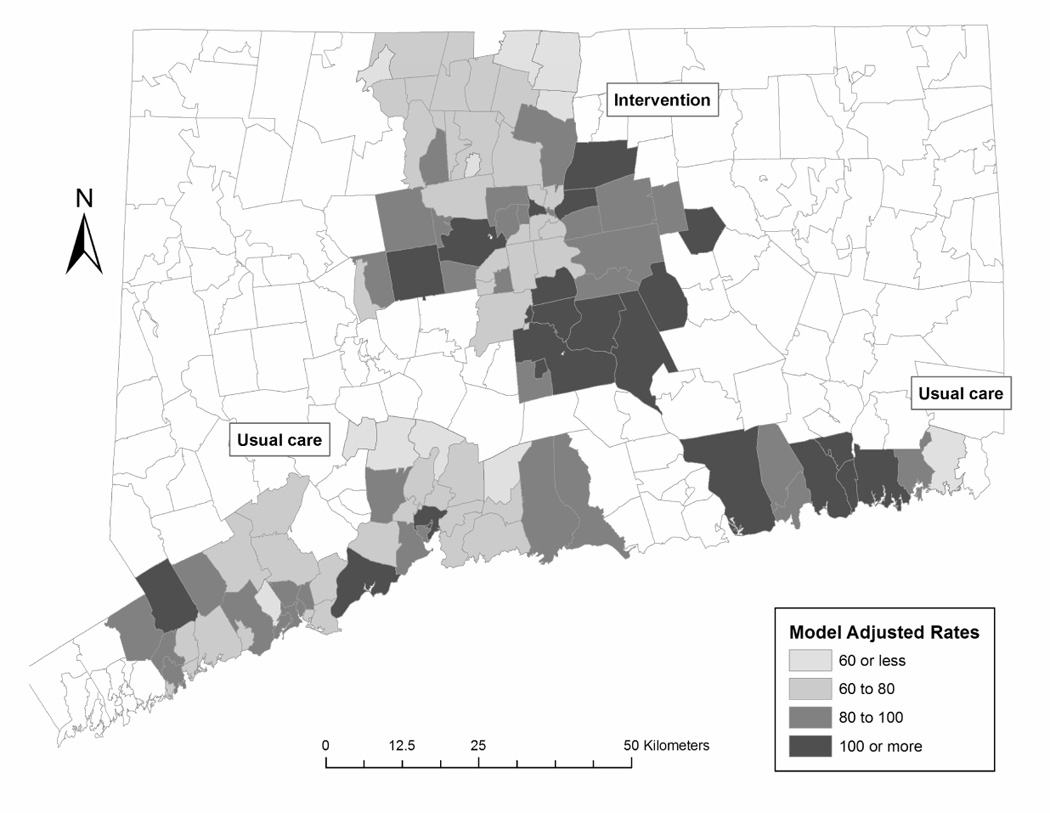
Annualized Number of Fall-Related Healthcare Utilizations per 1000 Persons Aged 70 and Older CT Zip Code Tabulation Areas During Pre-Intervention Period (October 1999 – September 2001)
DISCUSSION
Summary
We have described the underlying analytic methods that will be applied to the final analysis of the CCFP. With adjustment for important covariates, the pre-intervention rates of fall-related healthcare utilization do not differ significantly between the study arms. The addition of random effects terms accounting for spatial variability are recommended in the literature and achieve improved model fit. This demonstrates that in this specific case the non-random selection of one region as intervention arm and the other as usual care arm does not result in obvious pre-intervention imbalances.
Strengths
A major strength of this study is the breadth and high quality of the data drawn from both state and federal public sources in the US. Regarding numerator data, over 99% of patients at participating hospitals are reported by the Connecticut Hospital Association including all patients ≥ 70 years with Managed Medicare or fee-for-service coverage. The denominator data comes from the 2000 census estimates for the specific ZCTA populations 70 years and older, stratified by sex and five year age-groupings. Overall, this design is cost effective because it uses information from readily accessible public sources.
A second strength is its timeliness. The National Center for Health Statistics (NCHS) [10] reports that in 2003 over 1.8 million older adults visited emergency departments for treatment of fall injuries and over 421,000 were subsequently hospitalized. They suggest that their cross-sectional analysis results “will help target prevention strategies and identify health care utilization needs for older adults who may be at higher risk for fall injuries”. The second stage translational research proposed in CCFP is designed to do just that.
A third strength is our use of Bayesian hierarchical modeling. Through the advent of inexpensive, high speed computing, what was previously a prohibitively expensive computational method has now arguably become the most convenient and statistically appropriate way of analyzing hierarchical data. [19] Its flexible structure allows for the clustering of random effects terms representing spatial variability and non-spatial variability within the time periods of this study. This enables the reduction of potential bias from the fixed effect estimates for study arm, its interaction with year and the other covariates. Combined with our quasi-experimental design, this is a comprehensive analytic approach to evaluating a second stage translational study.
Finally, the data and modeling are used to evaluate the plausibility of a clinical practice strategy throughout a geographic area for fall-related injuries requiring hospital or emergency department utilization within the older population. In 1994 the total cost of all fall injuries for people 65 and older was $27.3 billion and the same costs are expected to reach $43.8 billion by the year 2020. [20] While the effect estimation of geographically defined clinical practice strategies is difficult by nature, the analysis of a high quality dataset from a well-designed experiment with hierarchical techniques can account for sources of variability not easily quantified otherwise. [21, 22]
Limitations
We acknowledge that a quasi-experimental study, such as the CCFP, does not allow for individual randomization and therefore cannot rigorously establish causality between the future intervention and reduction in fall-related utilization measured at the ZCTA-level. However, the previous RCTs upon which this second stage translational study is based upon have established that the elements of the intervention have reduced fall rates [1,2]. In second stage translational research, i.e., the implementation of an RCT-proven intervention in a real world setting, randomization is not feasible because of the logistical and confidentiality concerns previously mentioned.
Since the design is not an RCT, statistically insignificant imbalances in unmeasured covariates could produce bias when not controlled for in the analysis. [23] Nonetheless, the modeling approach chosen accounts for the geographic and temporal variation in the data and includes covariates strongly associated with the outcome and has produced results corroborated in the literature. [11, 18] However, the modeling cannot eliminate the bias introduced by the imperfect balancing of covariates across the arms in this quasi-experimental study nor the level of inaccuracy extant in the sources of data for the numerators and denominators of the rates of fall-related utilization.
Whereas the quality of this data is high, it is not perfect. ZCTAs do not align perfectly with the postal ZIP codes that link individual patients to a geographical area. Until the intervention is completed and analyzed, it is unknown whether the intervention based on behavioral change of health care professionals will be associated with a change in the rate of fall-related injuries. Although the intervention will hopefully result in health care providers with increased knowledge, skills, and practice concerning fall risk assessment and management, a causal linkage to a reduction in fall-related health care utilization measured at the ZCTA-level is elusive.
Lastly, the intervention targets only non-institutionalized persons 70 years and older. A later dissemination of the intervention is planned to provide its benefits to older persons who are institutionalized and therefore also vulnerable to fall-related injury.
Concluding Remarks
The CCFP is a second stage translational study intended to evaluate the potential reduction in fall-related injuries in the older population through an intervention based on change in professional behavior. In its assessment of a large scale community health project, the CCFP combines many attractive design features including a quasi-experimental design, high integrity data, hierarchical modeling and interventional content of proven efficacy. While the analytic approach described here may not eliminate bias totally, this use of existing data resources offers efficiency and a means of analytical control for potential confounders and important sources of variability. Its eventual results may successfully demonstrate the translation of proven clinical results to the broader public.
Acknowledgments
This project would not have been possible without the data coordination activities of Denise Acampora and field work of Margaret Gottschalk, Dorothy Baker, Mary King, and Luann Bianco. Analysis of the breadth and depth of the professional change strategy was performed by Richard Fortinsky, M.D. Data structuring was done by John O’Leary and Peter Charpentier.
Acknowledgement of Funding Sources The CCFP is supported by the Donoghue Medical Research Foundation (DF#00-206) and the Claude D. Pepper OAIC at Yale University School of Medicine (#P30AG21342).
Footnotes
Publisher's Disclaimer: This is a PDF file of an unedited manuscript that has been accepted for publication. As a service to our customers we are providing this early version of the manuscript. The manuscript will undergo copyediting, typesetting, and review of the resulting proof before it is published in its final citable form. Please note that during the production process errors may be discovered which could affect the content, and all legal disclaimers that apply to the journal pertain.
REFERENCES
- 1.Tinetti ME, Baker DI, McAvay G, et al. A multifactorial intervention to reduce the risk of falling among elderly people living in the community. N Engl J Med. 1994;331:821–827. doi: 10.1056/NEJM199409293311301. [DOI] [PubMed] [Google Scholar]
- 2.Tinetti ME, Baker DI, Garrett PA, Gottschalk M, Koch ML, Horwitz RI. Yale FICSIT: Risk Factor abatement strategy for fall prevention. J Am Geriatr Soc. 1993;41:315–320. doi: 10.1111/j.1532-5415.1993.tb06710.x. [DOI] [PubMed] [Google Scholar]
- 3.Baker D, King MB, Fortinsky RH, et al. Dissemination of an evidence-based multicomponent fall risk-assessment and management strategy throughout a geographic area. J Am Geriatr Soc. 2005;53:675–680. doi: 10.1111/j.1532-5415.2005.53218.x. [DOI] [PubMed] [Google Scholar]
- 4.Greenland S. A review of multi-level theory for ecological analyses. Statistics in Medicine. 2002;21:389–395. doi: 10.1002/sim.1024. [DOI] [PubMed] [Google Scholar]
- 5.Cook T, Campbell DT. Quasi-Experimentation: Design and Analysis Issues. Boston: Houghton Mifflin; 1979. [Google Scholar]
- 6.Habicht J, Victora CG, Vaughan JP. Evaluation designs for adequacy, plausbility and probability on public health programme performance and impact. Int J Epidemiol. 1999;28:10–18. doi: 10.1093/ije/28.1.10. [DOI] [PubMed] [Google Scholar]
- 7.Farquhar C, Stryer D, Slutsky J. Translating research into practice: the future ahead. International Journal for Quality in Health Care. 2002;14:232–249. doi: 10.1093/oxfordjournals.intqhc.a002615. [DOI] [PubMed] [Google Scholar]
- 8.Hait W. Translating research into clinical practice: deliberations from the American Association for Cancer Research. Clinical Cancer Research. 2005;11:4275–4277. doi: 10.1158/1078-0432.CCR-05-0321. [DOI] [PubMed] [Google Scholar]
- 9.Sung N, Crowley WF, Jr, Genel M, Salber P, Sandy L, Sherwood LM, et al. Central challenges facing the national clinical research enterprise. JAMA. 2003;289:1278–1287. doi: 10.1001/jama.289.10.1278. [DOI] [PubMed] [Google Scholar]
- 10.Schiller J, Kamarov EA, Dey AN. Fall injury episodes among non-institutionalized older adults: United States, 2001–2003. National Center for Health Statistics. 2007;392 (Advance Data from Vital and Health Statistics). [Google Scholar]
- 11.Tinetti ME, Speechley M, Ginter SF. Risk factors for falls among elderly persons living in the community. N Engl J Medicine. 1988;319:1701–1707. doi: 10.1056/NEJM198812293192604. [DOI] [PubMed] [Google Scholar]
- 12.Bernardinelli L, Clayton DG, Pascutto C, Montomoli C, Ghislandi M, Songini M. Bayesian analysis of space-time variation in disease risk. Statistics in Medicine. 1995;14:2433–2443. doi: 10.1002/sim.4780142112. [DOI] [PubMed] [Google Scholar]
- 13.Waller L, Carlin BP, Xia H, Gelfand AE. Hierarchical spatio-temporal mapping of disease rates. JASA. 1997;92(438):607–617. [Google Scholar]
- 14.Besag J, York J, Mollie A. Bayesian image restoration with two applications in spatial statistics. Annals of the Institute of Statistical Mathematics. 1991;43:1–59. [Google Scholar]
- 15.Clayton D, Kaldor J. Empirical Bayes estimates of age-standardised relative risks for use in disease mapping. Biometrics. 1987;43:671–691. [PubMed] [Google Scholar]
- 16.Brooks S, Gelman A. Alternative methods for monitoring convergence of iterative simulations. Journal of Computational and Graphical Statistics. 1998;7:434–455. [Google Scholar]
- 17.Spiegelhalter D, Best NJ, Carlin BP, van der Linde A. Bayesian measures of model complexity and fit (with discussion) J Roy Statist Soc B. 2002;64:583–640. [Google Scholar]
- 18.Tinetti ME, Williams CS. Falls, injuries due to falls, and the risk of admission to a nursing home. N Engl J Med. 1997;337:1279–1284. doi: 10.1056/NEJM199710303371806. [DOI] [PubMed] [Google Scholar]
- 19.Banerjee S, Carlin BP, Gelfand AE. Hierarchical Modeling and Analysis for Spatial Data, Preface. Boca Raton: Chapman & Hall/CRC; 2004. [Google Scholar]
- 20.Englander F, Hodson TJ, Terregrossa RA. Economic dimensions of slip and fall injuries. J Forensic Sci. 1996;41(5):733–746. [PubMed] [Google Scholar]
- 21.Victora C, Habicht JP, Bryce J. Evidence-based public health: moving beyond randomized trials. American Journal of Public Health. 2004;94(3):400–405. doi: 10.2105/ajph.94.3.400. [DOI] [PMC free article] [PubMed] [Google Scholar]
- 22.Wiegersma P, Hofman A, Zielhuis GA. Evaluation of community-wide interventions: the ecologic case-referent study design. European Journal of Epidemiology. 2001;17:551–557. doi: 10.1023/a:1014568930992. [DOI] [PubMed] [Google Scholar]
- 23.Breslow N, Lyon DN. Statistical Methods in Cancer Research. International Agency for Research on Cancer; 1980. [Google Scholar]