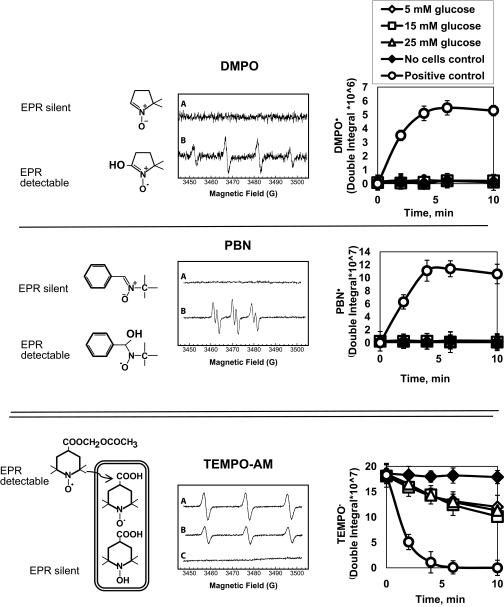
FIG. 3.
Measurements of oxidative stress in high glucose–treated HRECs using spin trap EPR do not show production of oxidative radicals. Spin-trap EPR was used to confirm the failure of high glucose to increase endogenous ROS production by HRECs. HRECs were cultured in matrix-coated Teflon tubes. In each experiment, the cells were incubated for 1–72 h in 5 (⋄), 15 (□), or 25 (▵) mmol/l glucose, and production of radicals was measured. Twenty-four–hour time point is shown; DMPO (top), PBN (middle) or TEMPO-AM (bottom) was used. The principle of detection is shown on the left, representative EPR traces in the middle, and quantitated data on the right. Cells stimulated with 0.5 mmol/l H2O2 in the presence of iron to induce Fenton's reaction served as positive controls (○). Teflon tubes without cells were used as negative controls (♦). Top and middle: Traces A for DMPO and PBN are from 25 mmol/l glucose-stimulated cells. No cells control and 5 and 15 mmol/l glucose traces looked similar to 25 mmol/l glucose trace. Traces B for DMPO and PBN are from the positive control. In DMPO and PBN experiments, exposure to 15 and 25 mmol/l glucose did not cause detectable radical production; no cells control (♦), 5 (⋄), 15 (□), or 25 (▵) mmol/l glucose graphs are super-imposable in the top and middle panels. Only when the cells were stimulated with H2O2 was radical production observed (○). Bottom: TEMPO-AM is more sensitive than DMPO and PBN and is hydrolyzed inside the cell, retained in the cytoplasm, and then reduced to the corresponding hydroxylamine, leading to the loss of paramagnetism. Loss of EPR signal corresponds to the amount of intracellular free radicals. HRECs were incubated for 1–96 h in the varying glucose concentrations, and then TEMPO-AM was added. HRECs exposed to 5 (⋄), 15 (□), or 25 (▵) mmol/l glucose for 24 h all demonstrated a low level of radicals, and there was no difference in radical production between different glucose concentrations. Trace A for TEMPO-AM is from no cell control with no loss of paramagnetism; trace B is from 25 mmol/l glucose; 5 and 15 mmol/l glucose traces looked similar to 25 mmol/l glucose; trace C is from positive control with radical production being detected as a loss of paramagnetism. Results of five independent experiments (mean ± SD) are shown in the graphs.

