Abstract
OBJECTIVE—Measurement of plasma C2 glucose enrichment is cumbersome. Therefore, the plasma C5 glucose–to–2H2O rather than the plasma C5-to-C2 glucose ratio commonly has been used to measure gluconeogenesis and glycogenolysis during hyperinsulinemic-euglycemic clamps. The validity of this approach is unknown.
RESEARCH DESIGN AND METHODS—Ten nondiabetic and 10 diabetic subjects ingested 2H2O the evening before study. The following morning, insulin was infused at a rate of 0.6 mU · kg−1 · min−1 and glucose was clamped at ∼5.3 mmol/l for 5 h. Plasma C5 glucose, C2 glucose, and 2H2O enrichments were measured hourly from 2 h onward.
RESULTS—Plasma C2 glucose and plasma 2H2O enrichment were equal in both groups before the clamp, resulting in equivalent estimates of gluconeogenesis and glycogenolysis. In contrast, plasma C2 glucose and plasma C5 glucose enrichments fell throughout the clamp, whereas plasma 2H2O enrichment remained unchanged. Since the C5 glucose concentration and, hence, the C5 glucose–to–2H2O ratio is influenced by both gluconeogenesis and glucose clearance, whereas the C5-to-C2 glucose ratio is only influenced by gluconeogenesis, the C5 glucose–to–2H2O ratio overestimated (P < 0.01) gluconeogenesis during the clamp. This resulted in biologically implausible negative (i.e., calculated rates of gluconeogenesis exceeding total endogenous glucose production) rates of glycogenolysis in both the nondiabetic and diabetic subjects.
CONCLUSIONS—Plasma C5 glucose–to–2H2O ratio does not provide an accurate assessment of gluconeogenesis in nondiabetic or diabetic subjects during a traditional (i.e., 2–3 h) hyperinsulinemic-euglycemic clamp. The conclusions of studies that have used this approach need to be reevaluated.
Measurement of gluconeogenesis in humans is difficult. The deuterated water method is widely used for this purpose (1–17). This method relies on the fact that the fifth carbon of glucose is labeled during gluconeogenesis, whereas the second carbon of glucose is labeled with deuterium during equilibration of glucose-6-phosphate and fructose-6-phoshate (1,2). Therefore, at steady state, the ratio of plasma glucose with deuterium on the fifth carbon (C5 glucose) to plasma glucose labeled on the second carbon (C2 glucose) equals the percentage of plasma glucose derived from gluconeogenesis (1,2). Measurement of C2 glucose enrichment is cumbersome. Since 2H2O and C2 glucose enrichments are equal at steady state, many investigators have used the plasma C5 glucose–to–2H2O ratio to calculate gluconeogenesis after an overnight fast (4–7,9–12,18). The C5 glucose–to–2H2O ratio has also been used to measure gluconeogenesis during glucose clamps (4,6,7,11,12,18). However, the validity of this approach is uncertain. We have reported that the rate of gluconeogenesis measured during the final hour of a 3-h hyperinsulinemic-euglycemic clamp in lean nondiabetic subjects using the C5-to-C2 glucose ratio correlated with that measured in the same subjects using the C5 glucose–to–2H2O ratio (7). However, in those as well as other glucose clamp experiments (4,6,7,11,12,18), gluconeogenesis calculated using the C5 glucose–to–2H2O ratio commonly exceeded total endogenous glucose production. Since endogenous glucose production equals the sum of glucose derived via gluconeogenesis and glycogenolysis, this result was biologically implausible.
Plasma C5 glucose concentrations are determined both by the rate of appearance of C5 glucose into and the rate of disappearance of C5 glucose from the plasma pool. Therefore, the use of the C5 glucose–to–2H2O ratio during a clamp is only accurate when C5 glucose has achieved a new steady state. Since hyperinsulinemic clamps typically are relatively short (e.g., 2–3 h) and the glucose pool large, we became concerned that plasma C5 glucose concentration was artificially elevated because the clearance was not sufficiently rapid for C5 glucose concentration to have reachieved a steady state at a lower concentration. If so, this would be particularly problematic when the C5 glucose–to–plasma 2H2O ratio was used to assess gluconeogenesis in groups in whom insulin action, and therefore glucose clearance, differed. The present experiments addressed this question by measuring both plasma C5-to-C2 glucose and the C5 glucose–to–2H2O ratios in diabetic and nondiabetic subjects before and every hour from 2 h onward during a 5-h hyperinsulinemic-euglycemic clamp.
RESEARCH DESIGN AND METHODS
Results for this report are derived from 10 nondiabetic subjects and 10 subjects with type 2 diabetes in whom sufficient plasma was available to permit measurement of C5 glucose, C2 glucose, and 2H2O enrichment at hourly intervals during a prolonged hyperinsulinemic-euglycemic clamp. Subject characteristics are given in supplemental Table 1 (available in an online appendix at http://dx.doi.org/10.2337/db08-0195).
Details of the experimental design have been described in detail elsewhere (19). Subjects were admitted to the Mayo Clinical Research Unit on the evening before study and given a standard meal at 1700 h and 1.67 g 2H2O/kg body water in divided doses at 1800, 2000, and 2200 h. Insulin was infused in the diabetic subjects during the night to maintain glucose at ∼5.5 mmol/l. A primed (fasting glucose divided by 5.5 mmol/l times 12 μCi), continuous (0.12 μCi/min) infusion of [3-3H] glucose was started at 0700 h; infusions of insulin (0.6 mU · kg−1 · min−1), somatostatin (60 ng · kg−1 · min−1), growth hormone (3 ng · kg−1 · min−1), and glucagon (0.65 ng · kg−1 · min−1) were started at 1000 h (time 0 min). Glucose containing [3-3H] glucose was infused in amounts sufficient to maintain euglycemia, as previously described (20). Plasma glucose, insulin, [3-3H] glucose specific activity, and enrichment of deuterium on the 2nd and 5th carbons of plasma glucose were measured as previously described (1,2,21).
Calculations.
Rates are expressed in the figures and text as micromoles per kilogram lean body mass per min. Rates of glucose appearance and disappearance and endogenous glucose production were calculated using the steady-state equations of Steele et al. (22) as previously described (19). Rates of gluconeogenesis were calculated either by multiplying the plasma C5-to-C2 glucose ratio by endogenous glucose production or plasma C5 glucose–to–2H2O ratio by the total rate of glucose appearance (2). Glycogenolysis was calculated by subtracting the rate of gluconeogenesis from endogenous glucose production. The results from the diabetic subjects have previously been published, in part, elsewhere (19).
Statistical analysis.
Data in the text and figures are expressed as means ± SEM. Student's paired t test was used to determine whether rates calculated using the plasma C5-to-C2 glucose ratio differed from those calculated using the plasma C5 glucose/2H2O ratio. A P value <0.05 was considered statistically significant.
RESULTS
Plasma glucose and insulin concentrations.
Plasma glucose concentrations (supplemental Fig. 1 in the nondiabetic and diabetic subjects averaged 5.31 ± 0.16 and 5.41 ± 0.10 mmol/l, respectively, before the clamp and did not change during the clamp. Plasma insulin concentrations in the nondiabetic and diabetic subjects averaged 31 ± 4 and 178 ± 41 pmol/l, respectively, before the clamp and increased to 177 ± 11 and 203 ± 14 pmol/l during the clamp.
Glucose infusion rate required to maintain euglycemia and [3-3H] glucose specific activity.
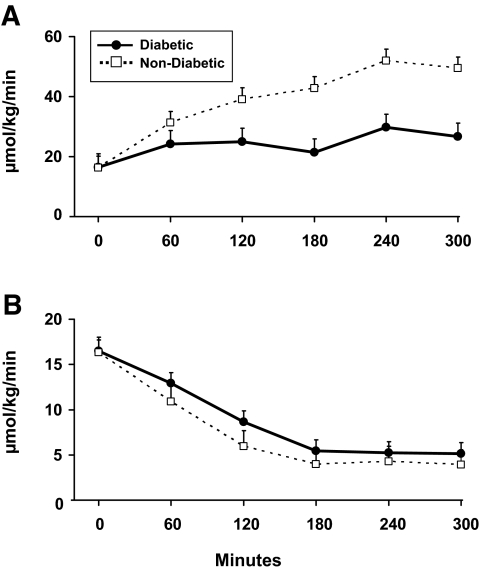
The glucose infusion rate required to maintain euglycemia increased in both groups during the first 4 h of the clamp and plateaued thereafter. The glucose infusion rate required to maintain euglycemia during the final hour of study was higher (P < 0.01) in the nondiabetic than in the diabetic subjects (45.9 ± 3.6 vs. 21.9 ± 5.6 μmol · kg−1 · min−1, respectively). Plasma [3-3H] glucose specific activity remained constant in both groups during the clamp, enabling accurate measurement of glucose turnover (supplemental Fig. 2).
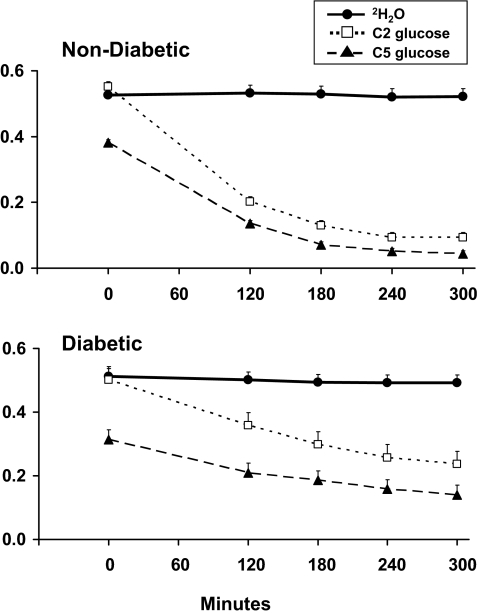
FIG. 2.
Plasma enrichment of 2H2O, C2 glucose, and C5 glucose observed in the nondiabetic and diabetic subjects. An insulin infusion was started at time zero.
Glucose disappearance and endogenous glucose production.
Glucose disappearance increased in both groups during the first 4 h of the clamp and remained unchanged thereafter. In contrast, endogenous glucose production was maximally suppressed in both groups within 3 hours. Glucose disappearance during the final hour of study was higher (P < 0.01) in the nondiabetic than diabetic subjects, whereas endogenous glucose production did not differ between groups (Fig. 1).
FIG. 1.
Glucose disappearance (A) and endogenous glucose production (B). An insulin infusion was started at time zero.
Plasma 2H2O, C2 glucose, and C5 glucose enrichment.
Plasma 2H2O and C2 glucose enrichment did not differ in either the nondiabetic or diabetic subjects before the clamp. Plasma 2H2O enrichment remained unchanged in both groups during the clamp. In contrast, plasma C2 glucose and C5 glucose enrichment decreased (P < 0.01) in both groups during the clamp (Fig. 2).
Rates of gluconeogenesis and glycogenolysis calculated using the plasma C5 glucose–to–2H2O and plasma C5-to-C2 glucose ratios.
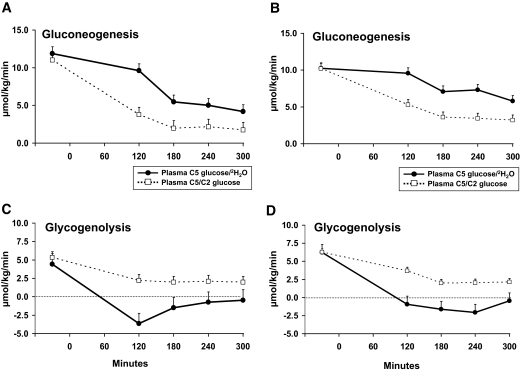
Rates of gluconeogenesis and glycogenolysis measured before the clamp using the plasma C5 glucose–to–2H2O ratio did not differ from those measured using the plasma C5-to-C2 glucose ratio in either group. In contrast, rates of gluconeogenesis measured during the clamp using the plasma C5 glucose–to–2H2O ratio were consistently greater (P < 0.01) and glycogenolysis consistently lower (P < 0.01) than those measured using the plasma C5-to-C2 glucose ratio in both the nondiabetic and diabetic subjects, with the difference most evident during the first 2 h of the clamp (Fig. 3).
FIG. 3.
Rates of gluconeogenesis and glycogenolysis measured in the nondiabetic (A and C) and diabetic (B and D) subjects using the plasma C5-to-C2 glucose or plasma C5 glucose–to–2H2O ratios. An insulin infusion was started at time zero.
Of note, rates of glycogenolysis calculated using the plasma C5 glucose–to–2H2O ratio were lower (P < 0.05) than zero at 120 min in the nondiabetic subjects, indicating that calculated rates of gluconeogenesis exceeded endogenous glucose production. Rates of glycogenolysis calculated using the plasma C5 glucose–to–2H2O ratio converged toward zero thereafter. A similar pattern was observed in the diabetic subjects, with rates of glycogenolysis calculated using the C5 glucose–to–2H2O ratio decreasing to less than zero at 120, 180, and 240 min and converging toward zero thereafter.
Correlations.
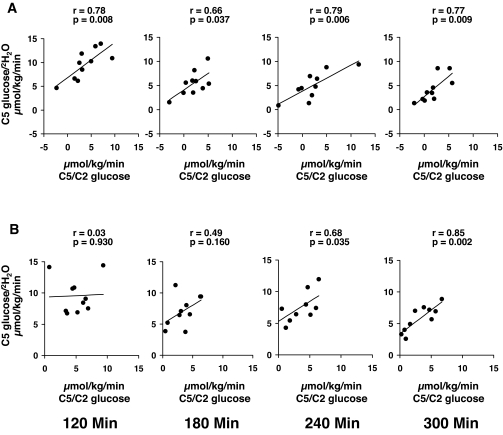
Rates of gluconeogenesis measured in the nondiabetic subjects using the C5 glucose–to–2H2O ratio correlated (P < 0.05) with rates measured using the C5-to-C2 glucose ratio at all time points (Fig. 4). However, the slopes did not equal one, and the y intercepts did not equal zero. Rates of gluconeogenesis measured in the diabetic subjects using the C5 glucose–to–2H2O ratio were not significantly correlated with those measured using the C5-to-C2 glucose ratio until 240 min, implying that the contribution of gluconeogenesis relative to the contribution of glucose clearance to C5 glucose concentration increased with time.
FIG. 4.
Correlation between the rates of gluconeogenesis in nondiabetic (A) and diabetic (B) subjects, measured using the C5 glucose–to–2H2O ratio and the C5-to-C2 glucose ratio.
DISCUSSION
The present studies confirm that the C5 glucose–to–2H2O and the C5-to-C2 glucose ratios provide equivalent estimates of gluconeogenesis and glycogenolysis following an overnight fast in both nondiabetic and diabetic subjects. In contrast, use of the C5 glucose–to–2H2O ratio during an euglycemic-hyperinsulinemic clamp systematically overestimates gluconeogenesis and underestimates glycogenolysis.
In the presence of 2H2O, the fifth carbon of glucose is labeled with deuterium during gluconeogenesis (1,2). The second carbon of glucose is labeled with deuterium during equilibration of glucose-6-phosphate and fructose-6 phosphate (1,2). At equilibrium, the enrichment of deuterium on the second carbon of glucose equals that of plasma water. Since plasma glucose derived from either gluconeogenesis or glycogenolysis passes though the glucose-6-phosphate pool, at steady state either the C5 glucose–to–2H2O or the C5-to-C2 glucose ratio equals the proportion of plasma glucose derived from gluconeogenesis (1,2). The situation changes during a hyperinsulinemic-euglycemic clamp, when the rate of release of C5 glucose decreases as a result of suppression of glucose production and the rate of clearance of C5 glucose increases as a result of stimulation of glucose uptake. As is evident from Fig. 2, C5 glucose enrichment fell throughout the 5 h of the study in the diabetic subjects, indicating that equilibrium was never reached. While C5 glucose enrichment also fell during the clamp in the nondiabetic subjects, it appeared to approach steady state during the final hour of the study. Therefore, plasma C5 glucose concentrations during the first portion of the clamp were higher than those that would be present when a new steady state was eventually achieved. In contrast, since C5 glucose and C2 glucose are cleared in parallel, the C5-to-C2 glucose ratio is only influenced by the rates of release of C5 glucose and C2 glucose, enabling assessment of gluconeogenesis.
Since plasma C5 glucose enrichment is diluted by both endogenously produced and exogenously infused glucose, gluconeogenesis is calculated by multiplying the C5 glucose–to–2H2O ratio by total rate of glucose appearance. Use of this approach resulted in rates of gluconeogenesis that were not only greater than those calculated using the C5-toC2 glucose ratio but that were also greater than endogenous glucose production. This yielded biologically implausible (i.e., negative) rates of glycogenolysis. A similar pattern has been observed in previous studies that have used the C5 glucose–to–2H2O ratio to calculate gluconeogenesis during a hyperinsulinemic clamp (4,6,7,11,12,18).
The present study suffers from several limitations. Uptake and re-release of glucose (i.e., plasma glucose to hepatic glucose-6-phosphate to plasma glucose) will cause labeling of second carbon of glucose (1,2). This will reduce the C5-to-C2 glucose ratio and will cause an underestimation of gluconeogenesis. Although limited hepatic glucose uptake occurs in the presence of euglycemia (23,24), the impact of such cycling on the C5-to-C2 glucose ratio during a hyperinsulinemic-euglycemic clamp is not known. There is no gold standard with which in vivo measurements of gluconeogenesis can be compared. The present data merely indicate that since both gluconeogenesis and glucose clearance rates influence the C5 glucose concentration, clamps must be conducted for a sufficient duration for plasma C5 glucose enrichment to reachieve a steady state; otherwise, use of the C5 glucose–to–2H2O ratio yields erroneous estimates of both gluconeogenesis and glycogenolysis.
In summary, the present studies indicate that while use of the C5 glucose–to–2H2O and C5-to-C2 glucose ratios provide a comparable estimate of gluconeogenesis after an overnight fast, they do not do so during a traditional 2-h hyperinsulinemic-euglycemic clamp. Use of the C5–to–glucose/2H2O ratio during a glucose clamp overestimates gluconeogenesis and underestimates glycogenolysis. In contrast, since the C5-to-C2 glucose ratio only is influenced by gluconeogenesis, estimates obtained using this ratio will not be altered by changes in glucose clearance. We therefore recommend using the C5-to-C2 glucose ratio to assess gluconeogenesis during a hyperinsulinemic clamp. We also recommend performing the clamp for a sufficient duration (e.g., at least 3 h) so that the effects of insulin on gluconeogenesis have time to become readily evident.
Supplementary Material
Acknowledgments
This study was supported by U.S. Public Health Service grants DK29953, DK14507, RR-00585, and U 54RR 24150-1 and by a Merck research infrastructure grant.
We thank G. DeFoster, P. Reich, and P. Helwig for technical assistance; M. Davis and C. Nordyke for assistance with preparation of the manuscript; and the staff of the Mayo Clinical Research Unit and Center for Clinical and Translation Science Activities for assistance with the studies.
Published ahead of print at http://diabetes.diabetesjournals.org on 16 April 2008.
The costs of publication of this article were defrayed in part by the payment of page charges. This article must therefore be hereby marked “advertisement” in accordance with 18 U.S.C. Section 1734 solely to indicate this fact.
REFERENCES
- 1.Landau BR, Wahren J, Chandramouli V, Schumann WC, Ekberg K: Use of 2H2O for estimating rates of gluconeogenesis: application to the fasted state. J Clin Invest 95 :172 –178,1995 [DOI] [PMC free article] [PubMed] [Google Scholar]
- 2.Landau BR, Wahren J, Chandramouli V, Schumann WC, Ekberg K, Kalhan SC: Contributions of gluconeogenesis to glucose production in the fasted state. J Clin Invest 98 :378 –385,1996 [DOI] [PMC free article] [PubMed] [Google Scholar]
- 3.Boden G, Chen X, Capulong E, Mozzoli M: Effects of free fatty acids on gluconeogenesis and autoregulation of glucose production in type 2 diabetes. Diabetes 50 :810 –816,2001 [DOI] [PubMed] [Google Scholar]
- 4.Gastaldelli A, Toschi E, Pettiti M, Frascerra S, Quiñones-Galvan A, Sironi AM, Natali A, Ferrannini E: Effect of physiological hyperinsulinemia on gluconeogenesis in nondiabetic subjects and in type 2 diabetic patients. Diabetes 50 :1807 –1812,2001 [DOI] [PubMed] [Google Scholar]
- 5.Boden G, Chen X, Stein TP: Gluconeogenesis in moderately and severely hyperglycemic patients with type 2 diabetes mellitus. Am J Physiol Endocrinol Metab 280 :E23 –E30,2001 [DOI] [PubMed] [Google Scholar]
- 6.Boden G, Cheung P, Stein TP, Kresge K, Mozzoli M: FFA cause hepatic insulin resistance by inhibiting insulin suppression of glycogenolysis. Am J Physiol Endocrinol Metab 283 :E12 –E19,2002 [DOI] [PubMed] [Google Scholar]
- 7.Adkins A, Basu R, Persson M, Dicke B, Shah P, Vella A, Schwenk WF, Rizza R: Higher insulin concentrations are required to suppress gluconeogenesis than glycogenolysis in non-diabetic humans. Diabetes 52 :2213 –2220,2003 [DOI] [PubMed] [Google Scholar]
- 8.Wajngot A, Chandramouli V, Schumann WC, Ekberg K, Jones PK, Efendic S, Landau BR: Quantitative contributions of gluconeogenesis to glucose production during fasting in type 2 diabetes mellitus. Metab Clin Exp 50 :47 –52,2001 [DOI] [PubMed] [Google Scholar]
- 9.Gastadelli A, Miyazaki Y, Pettiti M, Matsuda M, Mahankali S, Santini E, DeFronzo RA, Ferrannini E: Metabolic effects of visceral fat accumulation in type 2 diabetes. J Clin Endocrinol Metab 87 :5098 –5103,2002 [DOI] [PubMed] [Google Scholar]
- 10.Gastaldelli A, Miyazaki Y, Pettiti M, Buzzigoli E, Mahankali S, Ferrannini E, DeFronzo RA: Separate contribution of diabetes, total fat mass, and fat topography to glucose production, gluconeogenesis, and glycogenolysis. J Clin Endocrinol Metab 89 :3914 –3921,2004 [DOI] [PubMed] [Google Scholar]
- 11.Basu R, Schwenk F, Rizza RA: Both fasting glucose production and disappearance are abnormal in people with “mild” and “severe” type 2 diabetes. Am J Physiol Endocrinol Metab 287 :E55 –E62,2004 [DOI] [PubMed] [Google Scholar]
- 12.Gastaldelli A, Miyazaki Y, Pettiti M, Santini E, Ciociaro D, DeFronzo RA, Ferrannini E: The effect of rosiglitazone on the liver: decreased gluconeogenesis in patients with type 2 diabetes. J Clin Endocrinol Metab 91 :806 –812,2006 [DOI] [PubMed] [Google Scholar]
- 13.Boden G: Role of fatty acids in the pathogenesis of insulin resistance and NIDDM. Diabetes 46 :3 –10,1997 [PubMed] [Google Scholar]
- 14.Allick G, van der Crabben SN, Ackermans MT, Endert E, Sauerwein HP: Measurement of gluconeogenesis by deuterated water: the effect of equilibration time and fasting period. Am J Physiol Endocrinol Metab 290 :E1212 –E1217,2006 [DOI] [PubMed] [Google Scholar]
- 15.Jones JG, Fagulha A, Barosa C, Bastos M, Baptista C, Caldeira MM, Carvalheiro M: Noninasive analysis of hepatic glycogen kinetics before and after breakfast with deuterated water and acetaminophen. Diabetes 55 :2294 –2300,2006 [DOI] [PubMed] [Google Scholar]
- 16.Krebs M, Brehm A, Krssak M, Anderwald C, Bernroider E, Nowotny P, Roth E, Chandramouli V, Landau BR, Waldhausl W, Roden M: Direct and indirect effects of amino acids on hepatic glucose metabolism in humans. Diabetologia 46 :917 –925,2003 [DOI] [PubMed] [Google Scholar]
- 17.Kalhan S, Rossi K, Gruca L, Burkett E, O'Brien A: Glucose turnover and gluconeogenesis in human pregnancy. J Clin Invest 100 :1775 –1781,1997 [DOI] [PMC free article] [PubMed] [Google Scholar]
- 18.Gastaldelli A, Miyazaki Y, Mahankali A, Berria R, Pettiti M, Buzzigoli E, Ferrannini E, DeFronzo RA: The effect of pioglitazone on the liver: role of adiponectin. Diabetes Care 29 :2275 –2281,2006 [DOI] [PubMed] [Google Scholar]
- 19.Basu R, Shah P, Basu A, Norby B, Dicke B, Chandramouli V, Cohen O, Landau BR, Rizza RA: Comparison of the effects of pioglitazone and metformin on hepatic and extra-hepatic insulin action in people with type 2 diabetes. Diabetes 57 :24 –31,2007 [DOI] [PubMed] [Google Scholar]
- 20.Basu A, Caumo A, Bettini F, Gelisio A, Alzaid A, Cobelli C: Impaired basal glucose effectiveness in NIDDM: contribution of defects in glucose disappearance and production, measured using an optimized minimal model independent protocol. Diabetes 46 :421 –432,1997 [DOI] [PubMed] [Google Scholar]
- 21.Schumann WC, Gastaldelli A, Chandramouli V, Previs SF, Pettiti M, Ferrannini E, Landau BR: Determination of the enrichment of the hydrogen bound to carbon 5 of glucose on 2H2O administration. Anal Biochem 297 :195 –197,2001 [DOI] [PubMed] [Google Scholar]
- 22.Steele R, Wall J, DeBodo R, Altszuler N: Measurement of size and turnover rate of body glucose pool by the isotope dilution method. Am J Physiol 187 :15 –24,1956 [DOI] [PubMed] [Google Scholar]
- 23.Cherrington AD, Williams PE, Harris MS: Relationship between the plasma glucose level and glucose uptake in the conscious dog. Metabolism 27 :787 –791,1978 [DOI] [PubMed] [Google Scholar]
- 24.DeFronzo RA, Ferrannini E, Hendler R, Felig P, Wahren J: Regulation of splanchnic and peripheral glucose uptake by insulin and hyperglycemia in man. Diabetes 32 :35 –45,1983 [DOI] [PubMed] [Google Scholar]
Associated Data
This section collects any data citations, data availability statements, or supplementary materials included in this article.


