Abstract
The basis for agonist-selective signaling was investigated by using the μ-opioid receptor (MOR) as a model. In the absence of agonist, MOR located within the lipid raft domains, whereas etorphine, but not morphine, induced the translocation of MOR from lipid raft to nonraft domains, similar to the action of methyl-β-cyclodextrin. The etorphine-induced MOR translocation required the dissociation of the receptor from Gαi2 first and then the binding of β-arrestin. In contrast, the low affinity of the morphine–MOR complex for β-arrestin and the rebinding of Gαi2 after GTP hydrolysis retained the complex within the lipid raft domains. Disruption of the MOR–Gαi2 interaction, either by deleting the 276RRITR280 sequence of MOR or knocking down the level of Gαi2, resulted in the translocation of MOR to the nonraft domains. In addition, lipid raft location of MOR was critical for G protein-dependent signaling, such as etorphine- and morphine-mediated inhibition of adenylyl cyclase activity and morphine-induced ERK phosphorylation, whereas β-arrestin-dependent, etorphine-induced ERK phosphorylation required MOR to translocate into the nonraft domains. Thus, agonist-selective signaling is regulated by the location of MOR, which is determined by interactions of MOR with G proteins and β-arrestin.
Keywords: lipid raft, opioid
Agonists possess different efficacies on different signaling pathways of particular receptors (1, 2). Understanding agonist-selective signaling will accelerate the development of pathway-selective drugs, which have higher efficacy and potency, but fewer side effects (2). Among the various observations of agonist-selective signaling, selectivity between G protein-dependent and β-arrestin-dependent pathways of G protein-coupled receptor (GPCR) agonists has been well studied (2). For example, angiotensin II (angiotensin II receptor type 1A receptor agonist) uses both the G protein-dependent and β-arrestin-dependent pathways to induce ERK phosphorylation, whereas ICI118551 (β2-adrenergic receptor agonist) and CCL19 (chemokine receptor CCR7 agonist) induce ERK phosphorylation completely via one of the two pathways (3–5). Classically, receptor-mediated activation of the G protein releases free Gβγ subunits and induces GPCR kinase (GRK)-mediated receptor phosphorylation, which in turn increases the affinity of the receptor for β-arrestin (6). The binding of β-arrestin terminates the G protein-dependent pathway by uncoupling the G protein from the complex and activates signaling mediated by itself. Thus the activation of the β-arrestin-dependent pathway requires G protein activation. However, the existence of G protein-independent β-arrestin signaling was observed with the GPCR mutants that were incapable of interacting with G proteins (7, 8). How agonists select between the two pathways remains unclear.
One probable mechanism is that the GPCR location within different membrane domains, such as lipid raft and nonraft domains, determines the agonist-selective signaling. The lipid raft domain is characterized as a dynamic plasma membrane domain containing high levels of cholesterol and sphingolipids (9, 10) and is enriched with a variety of signaling factors, such as G protein-coupled receptors (GPCRs), G protein, and adenylyl cyclase (AC) (11–15). The lipid raft location is essential for the normal functioning of several GPCRs, such as gonadotropin-releasing hormone receptor-mediated ERK phosphorylation, neurokinin 1 receptor-mediated PKC activation, and δ-opioid receptor-mediated AC inhibition (12, 13, 16). In addition, after agonist treatment, the β2-adrenergic receptor translocates out of the lipid raft, whereas sphingosine EDG-1, muscarinic M2, and thyrotrophin TRH translocate into the lipid raft (17). Therefore, it is reasonable to propose that signal pathway selectivity of agonists is based on the location of the receptor within various membrane domains.
Our recent studies with the μ-opioid receptor (MOR) demonstrated that etorphine induced ERK phosphorylation only via the β-arrestin-dependent pathway, whereas morphine activated ERK only via the G protein-dependent pathway (18). In addition, some MOR-mediated signals, such as agonist- induced receptor internalization and increased AC activity after prolonged agonist treatment, were attenuated by methyl-β-cyclodextrin (MβCD), a disruptor of lipid rafts (19). Hence, MOR-induced ERK phosphorylation represents an excellent model for examining the relationships between receptor translocation among membrane domains and agonist-selectivity for the G protein-dependent and β-arrestin-dependent pathways.
Results
Etorphine, but Not Morphine, Induced MOR Translocation both in Vitro and in Vivo.
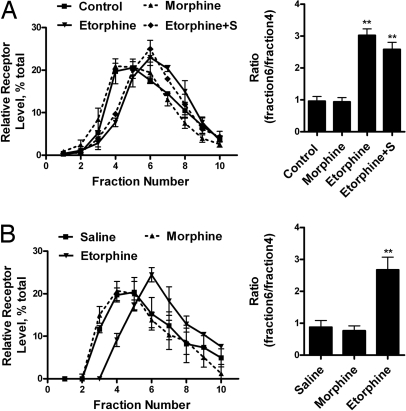
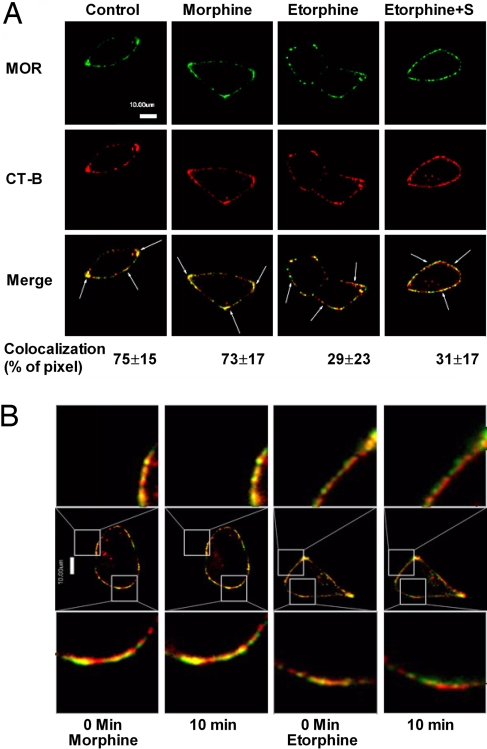
The observed difference in pathways selected by morphine and etorphine to activate ERK could be caused by the influence of the two agonists on MOR distribution among cell surface domains. Lipid raft and nonraft domains were separated. The successful separation was confirmed by using antibodies against Gαq (a lipid raft marker) and transferrin receptor (TR; a nonraft marker). Because the immunoreactivities of Gαq and TR peaked at the fourth and sixth fraction of a continuous sucrose gradient [supporting information (SI) Fig. S1A], the ratio of MOR amounts in these two fractions was calculated and represented the distribution of MOR in membrane domains. In addition, the MOR level in each fraction was calculated as the percentage of the total MOR in the first 10 fractions of the gradient to reflect the relative amount of MOR. Consistent with a previous report (19), MOR was shown to locate within the lipid raft in the absence of agonists. However, when the cells were treated with etorphine for 10 min, MOR translocated to the nonraft fractions (Fig. 1A and Fig. S1A). This translocation was not observed with morphine treatment nor was it the result of receptor endocytosis because etorphine still induced MOR translocation when 0.4M sucrose was used to block receptor internalization (20) (Fig. 1A and Fig. S1A). Moreover, confocal microscope imaging also indicated the colocalization of MOR with the cholera toxin subunit B (CT-B), a lipid raft marker (21). In the absence of an agonist, 75 ± 15% (n = 4) of MOR colocalized with CT-B (Fig. 2A). Ten-minute exposure to 1 μM morphine did not alter this percentage (73 ± 17%; n = 5). However, 10 min after 10 nM etorphine treatment, MOR and CT-B colocalization decreased significantly to 29 ± 23% (n = 6) in the absence or 31 ± 17% (n = 4) in the presence of 0.4 M sucrose. Colocalization of MOR with CTB was demonstrated also with live images of morphine- and etorphine-treated cells captured before and 10 min after agonist challenge. Again, only etorphine-treated cells showed a decrease in MOR and CT-B colocalization (Fig. 2B).
Fig. 1.
MOR located in lipid raft both in vivo and in vitro. (A) Sucrose gradient fractionation of the cell homogenates. HEK293 cells were treated with 1 μM morphine, 10 nM etorphine, or 10 nM etorphine with 0.4 M sucrose pretreatment for 10 min (Etorphine+S). Then MOR location on the cell membrane was determined, as described in Materials and Methods. The amount of MOR in each fraction was adjusted to the percentage of total MOR in first 10 fractions. In addition, the ratio between fractions 6 and 4 was calculated to provide additional information on the distribution of MOR between lipid raft and nonraft domains, as summarized by the bar graphs. (B) Distribution of MOR from hippocampus in sucrose gradient fractions. Samples from mice injected with morphine or etorphine and the hippocampus homogenates were prepared and fractionated as described in Materials and Methods.
Fig. 2.
MOR located in lipid raft indicated by confocal microscopy. (A) Confocal images of MOR and CTX-B colocalization. Immunofluorescence procedures were described as in Materials and Methods. Treatments were same as in Fig. 1. The numbers below the merge panels represent the pixels colocalization ratios that were calculated by IPLab 4.0. (B) Live cell confocal images of MOR and CTX-B. Live images were taken before and 10 min after 1 μM morphine and 10 nM etorphine treatments. Only etorphine induced significant decrease of the colocalization between MOR and CT-B.
To demonstrate etorphine-dependent translocation in vivo, mice were injected with 10 mg/kg morphine or 5 μg/kg etorphine (10-fold ED50) s.c. After maximum analgesia effects were reached (15 min for etorphine and 30 min for morphine), the mice were euthanized and their hippocampi were dissected to monitor the location of MOR on the cell membrane (22, 23). Similarly, etorphine, but not morphine, induced MOR translocation, as indicated by sucrose gradient fractionation (Fig. 1B).
Translocation of MOR to Nonraft Attenuated G Protein-Dependent Signaling.
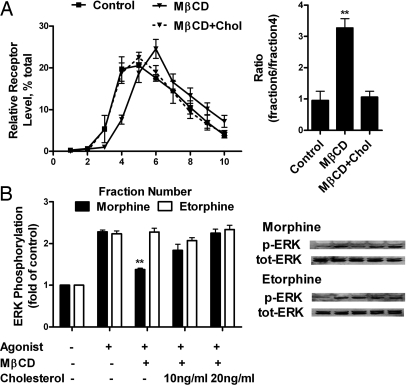
To verify that the translocation of MOR could affect MOR signaling, MβCD, which removes cholesterol from cells, was used to disrupt the lipid raft domains (24, 25). After MβCD treatment, translocation of Gαq and Gαi2 from lipid raft to nonraft fractions, as indicated by TR immunoreactivities, was observed. At the same time, there was a parallel MOR translocation into the nonraft fractions, which could be reversed by the addition of cholesterol (Fig. 3A and Fig. S1B). When agonist-induced AC inhibition and ERK phosphorylation were monitored, MβCD pretreatment decreased both the potencies and efficacies of morphine and etorphine to inhibit forskolin-stimulated AC activity. These attenuations were rescued by the addition of cholesterol (Table 1). In addition, MβCD treatment inhibited morphine-induced, but not etorphine-induced, ERK phosphorylation (Fig. 3B). Thus, the location of MOR in lipid raft is essential for G protein-dependent signaling.
Fig. 3.
MβCD treatment affected MOR location and signaling. (A) Distribution of MOR after MβCD and cholesterol treatment. HEK293 were treated with 1 mM MβCD for 1 h (MβCD) or 1 mM MβCD for 1 h and then 10 μg/ml cholesterol for 3 h (MβCD+Chol). Immunoreactivities of Gαi2, Gαq, and TR were also detected. (B) Effect of MβCD and cholesterol treatment on agonist-induced ERK1/2 phosphorylation. Morphine (1 μM) or 10 nM etorphine was used to treat HEK293 for 10 min after MβCD or cholesterol treatment. The amount of ERK1/2 being phosphorylated was then determined as described in Materials and Methods.
Table 1.
Potencies and maximal activities of morphine and etorphine to inhibit the forskolin-stimulated AC
| Cells | Morphine |
Etorphine |
||
|---|---|---|---|---|
| Ki, nM | Maximum inhibition, % | Ki, nM | Maximum inhibition, % | |
| HEK293-MOR | 11 ± 2.3 | 85 ± 2.9 | 0.11 ± 0.02 | 84 ± 1.0 |
| HEK293-MOR with MβCD | 23 ± 5.3** | 46 ± 2.2** | 0.27 ± 0.05** | 47 ± 1.9** |
| HEK293-MOR with MβCD and cholesterol | 10 ± 1.6 | 82 ± 7.6 | 0.10 ± 0.04 | 82 ± 2.2 |
| HEK293-MOR with control vector | 11 ± 1.9 | 80 ± 1.2 | 0.13 ± 0.03 | 79 ± 0.8 |
| HEK293-MOR with sense Gαi2 | 17 ± 4.1* | 67 ± 3.1* | 0.13 ± 0.05 | 76 ± 3.0 |
| HEK293-MOR with antisense Gαi2 | 12 ± 2.7 | 80 ± 2.6 | 0.069 ± 0.03* | 90 ± 2.0 |
| HEK293-MOR with PTX | >10,000 | >10,000 | ||
| HEK293-I35 | >10,000 | >10,000 | ||
| WT-MEF | 12 ± 3.9 | 36 ± 3.3 | 0.11 ± 0.03 | 40 ± 3.4 |
| BKO-MEF | 14 ± 3.1 | 35 ± 3.1 | 0.071 ± 2.0* | 55 ± 3.9* |
The abilities of morphine or etorphine to inhibit 10 μM forskolin-stimulated intracellular cAMP production in cells with various treatments were determined. Ki represents the concentration of agonist that produced 50% of the maximal inhibition. Intracellular cAMP level were done as described in previous studies (18, 19). *, P ≤ 0.05 and **, P ≤ 0.005 in two-tail t test.
MOR Interaction with Gαi2 Determines the Location of the Receptor.
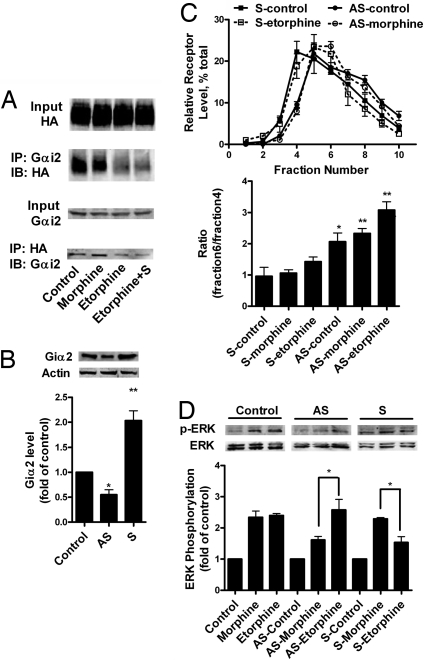
Accumulating data suggest that the α-subunits of G proteins are located within the lipid raft domains (26). Therefore, we examined whether Gα is responsible for the lipid raft location of MOR. Adenovirus constructs were used to deliver pertussis toxin (PTX)-resistant Gαo, Gαi2, and Gαi3 to murine neuroblastoma neuro2A (N2A) cells, as reported (16, 27). Overnight treatment of these cells with 0.1 μg/ml PTX attenuated ERK phosphorylation induced by both morphine and etorphine, whereas only PTX-resistant Gαi2 was able to rescue the PTX blockade (Fig. S2). The interaction of MOR with Gαi2 could be demonstrated by the coimmunoprecipitation of the receptor-Gαi2 complex (Fig. 4A). The Gαi2 pulled down by MOR or vice versa could be observed in control cells and 1 μM morphine-treated cells. In contrast, the amount of either MOR or Gαi2 proteins that were pulled down was reduced 10 min after 1 μM etorphine treatment with or without sucrose (Fig. 4A).
Fig. 4.
The interaction with Gαi2 was essential for MOR to locate in lipid raft. (A) Coimmunoprecipitation of Gαi2 with MOR-HA. HEK293 cells were treated with 1 μM morphine, 10 nM etorphine, or 10 nM etorphine and 0.4 M sucrose pretreatment (Etorphine+S) for 10 min. Then Gαi2 and HA antibodies were used for immunopreciptation experiment, as described in Materials and Methods. (B) Control of Gαi2 level in HEK293 cells with sense and antisense constructs. Sense (S) and antisense (AS) Gαi2 were transfected into HEK293 cells. After 24 h, the amount of Gαi2 was determined by Gαi2 antibody and β-actin was used as the loading control. (C) MOR location in membrane domains after alteration in Gαi2 level. Morphine (1 μM) and 10 nM etorphine were used to treat HEK293 cells for 10 min after sense and antisense Gαi2 transfection. MOR location was determined with sucrose gradient fractionation. (D) Agonist-induced ERK1/2 phosphorylation after Gαi2 sense and antisense treatment. After modulating the expression level of Gαi2, ERK1/2 phosphorylation was monitored after 10 min of 1 μM morphine and 10 nM etorphine treatment.
The location of MOR within various membrane domains was affected by the level of Gαi2. The expression level of Gαi2 was manipulated by transfecting with sense and antisense Gαi2 constructs (Fig. 4B). When the Gαi2 level was increased by overexpressing the sense construct, etorphine-induced MOR translocation was attenuated significantly (Fig. 4C). When Gαi2 was down-regulated by the expression of the antisense construct, MOR was observed within the nonraft domains in the absence of etorphine (Fig. 4C). Moreover, changes in MOR signaling were observed in parallel to MOR translocation. Morphine-induced ERK phosphorylation and AC inhibition were decreased after the Gαi2 level was down-regulated. However, etorphine-induced ERK phosphorylation decreased, whereas AC inhibition increased, after the overexpression of Gαi2 (Table 1 and Fig. 4D).
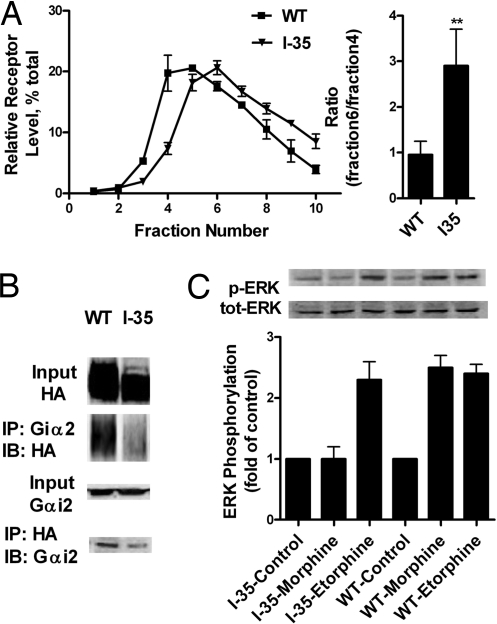
The interaction of MOR with Gαi2 in determining the lipid raft location of MOR was demonstrated further with a MOR mutant that lacks the BBXXB motif required for G protein interaction. The deletion of the 276RRITR280 sequence from MOR (I35) resulted in decreased interaction with Gα and the inability to mediate AC inhibition (28). The weaker interaction between I35 and Gαi2 was confirmed by the lesser amount of MOR or Gαi2 coimmunoprecipitated by each other (Fig. 5B). The reduction in MOR-Gαi2 interaction resulted in I35 being located within nonlipid raft domains in the absence of agonist (Fig. 5A), but did not influence the locations of Gαq and Gαi2, as in the case of MβCD treatment (Fig. 3A). As expected, I35 lost the ability to mediate morphine-induced AC inhibition and ERK phosphorylation. However, even with the inhibition of AC by etorphine was completely abolished, I35 still mediated the etorphine-induced ERK phosphorylation (Table 1 and Fig. 5C). Again, the I35 mutant demonstrated the importance of lipid raft location of MOR for G protein-dependent signaling.
Fig. 5.
MOR deletion mutant I35 is located in the nonraft domains. (A) Relative receptor level in the sucrose gradient fractions. HEK293 cells stably expressing MORI35 was processed, as described in Materials and Methods. The sucrose gradient distribution of I35 was compared with that of WT MOR. (B) Coimmunoprecipitation of I35 and Gαi2. HA and Gαi2 antibodies were used to coimmunoprecipitate Gαi2 and I35. The amount of MOR mutant and Gαi2 coimmunoprecipitated was compared with that of WT MOR. (C) Ability of I35 to mediate ERK1/2 phosphorylation. HEK293 cells with I35 were exposed to 1 μM morphine and 10 nM etorphine for 10 min. The amount of ERK1/2 phosphorylated was determined, as described in Materials and Methods.
The Translocation of MOR from Lipid Raft to Nonraft Required β-Arrestin2.
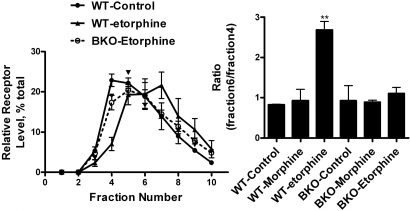
β-Arrestin-mediated receptor internalization was not the reason for MOR translocation (Fig. 1). The involvement of β-arrestin in the translocation process has not been established or eliminated. Therefore we used mouse embryonic fibroblast (MEF) cells from WT and β-arrestin2 knockout (BKO) mice to examine the role of β-arrestin on agonist-induced membrane domains translocation. BKO MEF cells were used because MOR interacts more tightly with β-arrestin2 than β-arrestin1 and β-arrestin2 mediates etorphine-induced ERK phosphorylation (18, 29). The titer of adenovirus construct with HA-MOR used to infect the MEF cells was controlled to produce similar expression of MOR in these cells (data not shown). Similar to observations with HEK293 cells, etorphine, but not morphine, induced MOR translocation in WT MEF cells. However, etorphine could not induce MOR translocation in the BKO MEF cells (Fig. 6A). Similar results were observed with MEF cells from β-arrestin1/2 double knockout mice (data not shown). In addition, MOR signaling in the presence of etorphine was altered in MEF cells from BKO mice. Etorphine-induced ERK phosphorylation was blocked in β-arrestin-deficient MEF cells (18), whereas etorphine-induced inhibition of forskolin-stimulated AC activity was increased (Table 1).
Fig. 6.
Etorphine-induced MOR translocation requires β-arrestin2. WT MEF cells and MEF cells from BKO mice were infected with adenovirus containing MOR-HA to reach an expression level of 0.5 ± 0.1 pmol/mg protein. Morphine (1 μM) and 10 nM etorphine were used to treat these cells 48 h after viral infection. The locations of MOR in sucrose gradients were then determined.
The fact that MOR interaction with β-arrestin is critical for etorphine-induced receptor translocation was demonstrated with a MOR mutant, MOR363D, which was truncated after Ser-363 and could not be phosphorylated by GRK in the presence of a MOR agonist (30, 31). As predicted, after 10 min of etorphine treatment, MOR363D remained within the lipid raft domains (Fig. S3). However, if the cells were treated with etorphine for 3 h, MOR363D was observed to translocate to the nonraft domains (Fig. S3). This observation was consistent with the previous study in which etorphine was observed to induce MOR363D internalization at a slower rate but to a similar extent (30).
The Dissociation of Gαi2 from MOR Was Necessary for β-Arrestin2 Binding.
PTX treatment blocked etorphine-induced ERK phosphorylation and MOR translocation (Fig. S1 and Fig. S4A). In addition, even prolonged etorphine treatment (3 h) was unable to induce receptor translocation after PTX pretreatment (Fig. S4A), in contrast to the 363D, which has a low affinity for β-arrestin but translocates after prolonged etorphine treatment (Fig. S3). Thus, PTX treatment prevented the binding of β-arrestin. Moreover, PTX uncoupled Gαi2 from MOR only functionally [indicated by attenuated AC inhibition (Table 1)] but not structurally [indicated by a similar amount of Gαi2 coimmunoprecipitated with MOR or vice versa, regardless of whether the cells were exposed to morphine or etorphine (Fig. S4B)]. Considering the ability of I35 to mediate etorphine-induced ERK phosphorylation (Fig. 5C), the dissociation of Gαi2 from MOR preceded the β-arrestin binding and MOR translocation.
Discussion
Previous reports have demonstrated the critical roles of lipid raft domains in GPCR signaling (12, 13, 17). Normally, the α-subunits of G proteins are recognized to be markers for lipid raft and can form complexes with GPCRs (32–34). In addition, Gαi2 forms a stable complex with MOR in the absence of agonist (26, 32, 35). Therefore, it is reasonable to suggest that Gαi2 mediates MOR location within the lipid raft. When this interaction was interrupted, the receptor translocated to the nonraft domains, as shown in the case of I35 (Fig. 5). This translocation appears to interrupt G protein-mediated receptor signaling, such as AC inhibition. Interestingly, deletion of the BBXXB motif in I35 was more efficient than MβCD in attenuating AC inhibition and morphine-induced ERK activation (Figs. 3 and 5), because when cells were treated with MβCD, Gαi2 and MOR translocated to nonraft domains together (Fig. S1), whereas the Gαi2 lipid raft location was not affected by the MOR mutant I35. The expression level of Gαi2 is also important (Fig. 4). It is clear that when Gαi2 is down-regulated and not sufficient to anchor all of the MOR to lipid raft domains the percentage of MOR within the nonraft domains increases. MOR translocation induced by etorphine was attenuated when Gαi2 was overexpressed, thus promoting the continued interaction between Gαi2 and MOR (Fig. 4). In contrast, PTX pretreatment did not alter MOR location among the membrane domains (Fig. S4). This observation is not surprising, considering that PTX pretreatment could not eliminate the G protein–receptor interaction, as reflected in the high-affinity state binding of the β2-adrenergic receptor and the δ-opioid receptor (36, 37) and the ability to coimmunoprecipitate Gαi2 with the receptor and vice versa (Fig. S4).
Both the translocation of GPCRs from lipid raft to nonraft domains and from nonraft to lipid raft domains after agonist treatment have been reported (17). For MOR, etorphine, but not morphine, could induce the translocation from lipid raft to nonraft domains. Furthermore, this translocation requires the participation of β-arrestin2 as illustrated by our studies with MEF cells from BKO mice (Fig. 6). Normally, β-arrestin uncouples GPCR from G proteins depending on the receptor's affinity for G proteins, β-arrestin, and GRK2. However, in addition to the cellular levels of these proteins, the dissociation of Gαi2 was critical for the binding of β-arrestin to MOR, as suggested by the I35 and Gαi2 experiments (Figs. 4 and 5). Hence, we hypothesize that a new wrinkle in the receptor “uncoupling” exists in MOR signaling. After MOR activation, Gαi2 dissociates from MOR to interact with various effectors. The agonist–MOR complex translocates to nonraft domains, as in the case of I35. If the complex has an affinity for β-arrestin, it will bind β-arrestin and cannot interact with Gαi2 again after GTP is hydrolyzed. Thus, it will stay in nonraft domains. If the complex has a low affinity for β-arrestin, such as the morphine–MOR complex, it will translocate back to the lipid raft domain by interacting with Gαi2 again. Thus β-arrestin is required for MOR translocation because it prevents MOR from diffusing back into lipid raft domains. Our PTX experiments clearly indicate that, without initial G protein activation, agonist-induced translocation does not occur. Thus, β-arrestin influences the eventual membrane domain location of MOR, but does not initiate the translocation process. In addition, the functional, but not structural, attenuation of G protein–receptor interaction by PTX treatment retains the G protein with MOR and prevents β-arrestin binding, which addresses the observation that PTX treatment blocks signaling mediated by both G protein and β-arrestin.
β-Arrestin has been viewed to be essential for GPCR endocytosis (2). However, the actions of β-arrestin that trigger MOR translocation and receptor endocytosis are distinct. MOR was observed within nonraft domains in the presence of 0.4 M sucrose (Fig. 1), a condition in which clathrin-coated pits formation can be blocked (20). With the I35 mutant that does not internalize after agonist treatment (28), β-arrestin-dependent, etorphine-induced ERK1/2 phosphorylation was observed (Fig. 5). However, the recruitment of AP2 and EPS15 from cytoplasm to nonraft domains during etorphine treatment was observed in our studies (data not shown). Therefore, whether such recruitments enhanced β-arrestin-dependent MOR translocation could not be determined at present.
Redistribution of MOR from the lipid rafts blunts AC inhibition and morphine-induced ERK1/2 phosphorylation, which are G protein-dependent. However, it does not alter β-arrestin-dependent signaling, as in the case of etorphine-induced ERK1/2 phosphorylation. Hence, agonists influence the actual MOR location within membrane domains and then determine which signaling pathway will be activated. Our recent report (18) indicated that pathway selectivity influenced the eventual cellular locations of activated ERK1/2 and hence the transcription factors to be activated. Thus, by regulating the membrane distribution of MOR, the opioid agonists could select for specific signaling pathways, resulting in differential transcriptional activities that might contribute to the previously observed differential tolerance induced by various opioids (23). The localization of MOR within lipid rafts in rodent brains has been reported (38) and agonist-induced translocation was observed (Fig. 1). If such agonist-dependent translocation of MOR has similar consequences on MOR signaling in synaptic plasma membrane as in cell models, by manipulating the cholesterol content, the location of the receptor can be altered, which will influence the in vivo activities of the opioid receptor. Therefore, in future drug development, the location of the receptor within the membrane domains needs to be considered carefully.
Materials and Methods
Cells and Chemicals.
HEK293 cells stably expressing HA-tagged MOR (HA-MOR) were cultured in MEM with 10% FBS and 200 ng/ml G418. N2A cells with HA-MOR and MEF cells were cultured in DMEM with 10% FBS with or without 200 ng/ml G418. MOR mutants, with 276RRITR280 sequence in the third intracellular loop (I35) or the carboxyl tail sequence after Ser-363 deleted (363D), were generated, as described (28, 30). Sense and antisense Gαi2 in pCDNA3 were transfected to HEK293 cells by using Effectene (Qiagen). Adenovirus system was used to deliver HA-MOR to MEF cells and PTX-resistant Gα (27) to the N2A cells. MβCD and PTX were purchased from Sigma and Listlabs, respectively.
Determination of MOR Location on Cell Surface.
After cells were lyzed in 700 μl of 500 mM sodium carbonate, they were homogenized by passing through needles (20 and 22 gauge) 10 times, followed by three 10-s bursts at setting four of the sonicator equipped with a microprobe (Heat Systems–Ultrasonics). The sonication did not affect the distribution of receptor, as compared with the samples prepared by using digitonin to solubilize the proteins within the lipid raft (data not shown). The homogenates with equal volumes of 80% sucrose [in modified Barth's solution (MBS), pH 6.8] were placed at the bottom of ultracentrifugation tubes that contained continuous sucrose gradients from 5% to 30% (in MBS containing 250 mM sodium carbonate), formed by the Gradient Station (BioComp). The gradient was centrifuged at 32,000 rpm for 16 h in a SW41 rotor. A total of 12 fractions (1 ml each) were collected, using the Gradient Station. The amounts of MOR and marker proteins in each fraction were detected by immunoblotting.
Localization of MOR in Mouse Hippocampus.
Three-month-old male mice (C57/B6) were used. Two were injected s.c. with 10 mg/kg morphine and killed 30 min after injection. Others were injected s.c. with 5 μg/kg etorphine or saline (two per treatment) and killed 15 min later. Hippocampi of the mice were dissected and subjected to sucrose gradient and immunoblotting, as described above.
Confocal Imaging.
Cells were cultured on polylysine (Sigma)-coated coverslip in six-well plates. After various treatments, cells were washed twice with PBS at 4°C twice and fixed with 2% formaldehyde for 30 min. Then the cells were washed with PBS three times and blocked in blocking buffer (PBS with 5% normal donkey serum). MOR was visualized by staining with mouse monoclonal anti-HA (Convance; 1:1,000) and Alexa 488-conjugated goat-anti-mouse antibody (1:1,000) (Molecular Probes). Lipid rafts were identified by using lipid raft labeling kits (Molecular Probes). The confocal images were captured with a BD CARV II Confocal Imager and a Leica DMIRE2 fluorescence microscope. Colocalization of the fluorescence pixels was calculated with IPlab 4.0 software (BD Biosciences-Bioimage). For live cell imaging, cells were labeled with the same antibodies, but without fixation. After removing the excess antibodies with repeated washings, live cell images were captured with same setup, except that the microscope stage was heated to 37°C and enclosed with a chamber to control the CO2 level at 5%. Images of these cells before and 10 min after drug treatment were captured and analyzed accordingly.
Immunoprecipitation.
Cells were homogenized as described for the sucrose gradients. Gαi2 (1:500) or HA (1:1,000) antibodies were added to the homogenate and rotated at 4°C for 3 h. Then protein G agarose (Invitrogen) was added (1:50) and rotated overnight at 4°C.
Statistic Analysis.
All of the experiments were repeated at least three time (except twice for the in vivo animal study). P ≤ 0.05 (*) and P ≤ 0.005 (**) in two-tail t test.
Supplementary Material
Acknowledgments.
Dr. Robert Lefkowitz (Duke University, Durham, NC) generously provided the WT, β-arrestin2−/−, and β-arrestin1/2−/− MEF, and Dr. L. Y. Liu-Chen (Temple University, Philadelphia) provided the affinity-purified rabbit polyclonal antibodies to MOR used in our Western blot analyses. This research was supported by National Institutes of Health Grants DA007339, DA016674, DA000564, and DA011806. H.H.L. was supported by National Institutes of Health Grant K05-DA70544, and P.-Y.L. was supported by National Institutes of Health Grant K05-DA00513.
Footnotes
The authors declare no conflict of interest.
This article is a PNAS Direct Submission.
This article contains supporting information online at www.pnas.org/cgi/content/full/0802253105/DCSupplemental.
References
- 1.Urban JD, et al. Functional selectivity and classical concepts of quantitative pharmacology. J Pharmacol Exp Ther. 2007;320:1–13. doi: 10.1124/jpet.106.104463. [DOI] [PubMed] [Google Scholar]
- 2.Violin JD, Lefkowitz RJ. β-Arrestin-biased ligands at seven-transmembrane receptors. Trends Pharmacol Sci. 2007;28:416–422. doi: 10.1016/j.tips.2007.06.006. [DOI] [PubMed] [Google Scholar]
- 3.Kohout TA, et al. Differential desensitization, receptor phosphorylation, beta-arrestin recruitment, and ERK1/2 activation by the two endogenous ligands for the CC chemokine receptor 7. J Biol Chem. 2004;279:23214–23222. doi: 10.1074/jbc.M402125200. [DOI] [PubMed] [Google Scholar]
- 4.Azzi M, et al. β-Arrestin-mediated activation of MAPK by inverse agonists reveals distinct active conformations for G protein-coupled receptors. Proc Natl Acad Sci USA. 2003;100:11406–11411. doi: 10.1073/pnas.1936664100. [DOI] [PMC free article] [PubMed] [Google Scholar]
- 5.Ahn S, Shenoy SK, Wei H, Lefkowitz RJ. Differential kinetic and spatial patterns of β-arrestin and G protein-mediated ERK activation by the angiotensin II receptor. J Biol Chem. 2004;279:35518–35525. doi: 10.1074/jbc.M405878200. [DOI] [PubMed] [Google Scholar]
- 6.Zhang J, et al. Role for G protein-coupled receptor kinase in agonist-specific regulation of mu-opioid receptor responsiveness. Proc Natl Acad Sci USA. 1998;95:7157–7162. doi: 10.1073/pnas.95.12.7157. [DOI] [PMC free article] [PubMed] [Google Scholar]
- 7.Zhai P, et al. Cardiac-specific overexpression of AT1 receptor mutant lacking Gαq/Gαi coupling causes hypertrophy and bradycardia in transgenic mice. J Clin Invest. 2005;115:3045–3056. doi: 10.1172/JCI25330. [DOI] [PMC free article] [PubMed] [Google Scholar]
- 8.Wei H, et al. Independent β-arrestin 2 and G protein-mediated pathways for angiotensin II activation of extracellular signal-regulated kinases 1 and 2. Proc Natl Acad Sci USA. 2003;100:10782–10787. doi: 10.1073/pnas.1834556100. [DOI] [PMC free article] [PubMed] [Google Scholar]
- 9.Mayo S, Rao M. Rafts: Scale-dependent, active lipid organization at the cell surface. Traffic. 2004;5:231–240. doi: 10.1111/j.1600-0854.2004.00172.x. [DOI] [PubMed] [Google Scholar]
- 10.Helms JB, Zurzolo C. Lipids as targeting signals: Lipid rafts and intracellular trafficking. Traffic. 2004;5:247–254. doi: 10.1111/j.1600-0854.2004.0181.x. [DOI] [PubMed] [Google Scholar]
- 11.Ostrom RS, et al. Receptor number and caveolar colocalization determine receptor coupling efficiency to adenylyl cyclase. J Biol Chem. 2001;276:42063–42069. doi: 10.1074/jbc.M105348200. [DOI] [PubMed] [Google Scholar]
- 12.Navratil AM, et al. Constitutive localization of the gonadotropin-releasing hormone (GnRH) receptor to low-density membrane microdomains is necessary for GnRH signaling to ERK. J Biol Chem. 2003;278:31593–31602. doi: 10.1074/jbc.M304273200. [DOI] [PubMed] [Google Scholar]
- 13.Monastyrskaya K, Hostettler A, Buergi S, Draeger A. The NK1 receptor localizes to the plasma membrane microdomains, and its activation is dependent on lipid raft integrity. J Biol Chem. 2005;280:7135–7146. doi: 10.1074/jbc.M405806200. [DOI] [PubMed] [Google Scholar]
- 14.Sargiacomo M, Sudol M, Tang Z, Lisanti MP. Signal transducing molecules and glycosyl-phosphatidylinositol-linked proteins form a caveolin-rich insoluble complex in MDCK cells. J Cell Biol. 1993;122:789–807. doi: 10.1083/jcb.122.4.789. [DOI] [PMC free article] [PubMed] [Google Scholar]
- 15.Li S, Couet J, Lisanti MP. Src tyrosine kinases, Gα subunits, and H-Ras share a common membrane-anchored scaffolding protein, caveolin: Caveolin binding negatively regulates the auto-activation of Src tyrosine kinases. J Biol Chem. 1996;271:29182–29190. doi: 10.1074/jbc.271.46.29182. [DOI] [PMC free article] [PubMed] [Google Scholar]
- 16.Zhang L, Tetrault J, Wang W, Loh HH, Law PY. Short- and long-term regulation of adenylyl cyclase activity by delta-opioid receptor are mediated by Gα2 in neuroblastoma N2A cells. Mol Pharmacol. 2006;69:1810–1819. doi: 10.1124/mol.105.021352. [DOI] [PubMed] [Google Scholar]
- 17.Chini B, Parenti M. G proteincoupled receptors in lipid rafts and caveolae: How, when, and why do they go there? J Mol Endocrinol. 2004;32:325–338. doi: 10.1677/jme.0.0320325. [DOI] [PubMed] [Google Scholar]
- 18.Zheng H, Loh HH, Law PY. β-Arrestin-dependent μ-opioid receptor-activated extracellular signal-regulated kinases (ERKs) translocate to nucleus in contrast to G protein-dependent ERK activation. Mol Pharmacol. 2008;73:178–190. doi: 10.1124/mol.107.039842. [DOI] [PMC free article] [PubMed] [Google Scholar]
- 19.Zhao H, Loh HH, Law PY. Adenylyl cyclase superactivation induced by long-term treatment with opioid agonist is dependent on receptor localized within lipid rafts and is independent of receptor internalization. Mol Pharmacol. 2006;69:1421–1432. doi: 10.1124/mol.105.020024. [DOI] [PubMed] [Google Scholar]
- 20.Heuser JE, Anderson RG. Hypertonic media inhibit receptor-mediated endocytosis by blocking clathrin-coated pit formation. J Cell Biol. 1989;108:389–400. doi: 10.1083/jcb.108.2.389. [DOI] [PMC free article] [PubMed] [Google Scholar]
- 21.Janes PW, Ley SC, Magee AI. Aggregation of lipid rafts accompanies signaling via the T cell antigen receptor. J Cell Biol. 1999;147:447–461. doi: 10.1083/jcb.147.2.447. [DOI] [PMC free article] [PubMed] [Google Scholar]
- 22.Arvidsson U, et al. Distribution and targeting of a mu-opioid receptor (MOR1) in brain and spinal cord. J Neurosci. 1995;15:3328–3341. doi: 10.1523/JNEUROSCI.15-05-03328.1995. [DOI] [PMC free article] [PubMed] [Google Scholar]
- 23.Duttaroy A, Yoburn BC. The effect of intrinsic efficacy on opioid tolerance. Anesthesiology. 1995;82:1226–1236. doi: 10.1097/00000542-199505000-00018. [DOI] [PubMed] [Google Scholar]
- 24.Rodal SK, et al. Extraction of cholesterol with methyl-β-cyclodextrin perturbs formation of clathrin-coated endocytic vesicles. Mol Biol Cell. 1999;10:961–974. doi: 10.1091/mbc.10.4.961. [DOI] [PMC free article] [PubMed] [Google Scholar]
- 25.Besenicar MP, Bavdek A, Kladnik A, Macek P, Anderluh G. Kinetics of cholesterol extraction from lipid membranes by methyl-β-cyclodextrin: A surface plasmon resonance approach. Biochim Biophys Acta. 2007;1778:175–184. doi: 10.1016/j.bbamem.2007.09.022. [DOI] [PubMed] [Google Scholar]
- 26.Nebl T, et al. Proteomic analysis of a detergent-resistant membrane skeleton from neutrophil plasma membranes. J Biol Chem. 2002;277:43399–43409. doi: 10.1074/jbc.M205386200. [DOI] [PubMed] [Google Scholar]
- 27.Massotte D, Brillet K, Kieffer B, Milligan G. Agonists activate Gi1α or Gi2α fused to the human mu opioid receptor differently. J Neurochem. 2002;81:1372–1382. doi: 10.1046/j.1471-4159.2002.00946.x. [DOI] [PubMed] [Google Scholar]
- 28.Chaipatikul V, Loh HH, Law PY. Ligand-selective activation of mu-oid receptor: Demonstrated with deletion and single amino acid mutations of third intracellular loop domain. J Pharmacol Exp Ther. 2003;305:909–918. doi: 10.1124/jpet.102.046219. [DOI] [PubMed] [Google Scholar]
- 29.Oakley RH, Laporte SA, Holt JA, Caron MG, Barak LS. Differential affinities of visual arrestin, βarrestin1, and βarrestin2 for G protein-coupled receptors delineate two major classes of receptors. J Biol Chem. 2000;275:17201–17210. doi: 10.1074/jbc.M910348199. [DOI] [PubMed] [Google Scholar]
- 30.Qiu Y, Law PY, Loh HH. Mu-opioid receptor desensitization: Role of receptor phosphorylation, internalization, and representation. J Biol Chem. 2003;278:36733–36739. doi: 10.1074/jbc.M305857200. [DOI] [PubMed] [Google Scholar]
- 31.El Kouhen R, et al. Phosphorylation of Ser-363, Thr-370, and Ser-375 residues within the carboxyl tail differentially regulates mu-opioid receptor internalization. J Biol Chem. 2001;276:12774–12780. doi: 10.1074/jbc.M009571200. [DOI] [PubMed] [Google Scholar]
- 32.Gilman AG. G proteins: Transducers of receptor-generated signals. Annu Rev Biochem. 1987;56:615–649. doi: 10.1146/annurev.bi.56.070187.003151. [DOI] [PubMed] [Google Scholar]
- 33.Ross EM. Protein modification: Palmitoylation in G proteinsignaling pathways. Curr Biol. 1995;5:107–109. doi: 10.1016/s0960-9822(95)00026-1. [DOI] [PubMed] [Google Scholar]
- 34.Macdonald JL, Pike LJ. A simplified method for the preparation of detergent-free lipid rafts. J Lipid Res. 2005;46:1061–1067. doi: 10.1194/jlr.D400041-JLR200. [DOI] [PubMed] [Google Scholar]
- 35.Chakrabarti S, Prather PL, Yu L, Law PY, Loh HH. Expression of the mu-opioid receptor in CHO cells: Ability of mu-opioid ligands to promote α-azidoanilido[32P]GTP labeling of multiple G protein α subunits. J Neurochem. 1995;64:2534–2543. doi: 10.1046/j.1471-4159.1995.64062534.x. [DOI] [PubMed] [Google Scholar]
- 36.Law PY, Hom DS, Loh HH. Effect of chronic d-Ala,2 d-Leu5-enkephalin or pertussis toxin treatment on the high-affinity state of delta opioid receptor in neuroblastoma × glioma NG108–15 hybrid cells. J Pharmacol Exp Ther. 1991;256:710–716. [PubMed] [Google Scholar]
- 37.De Lean A, Stadel JM, Lefkowitz RJ. A ternary complex model explains the agonist-specific binding properties of the adenylate cyclase-coupled β-adrenergic receptor. J Biol Chem. 1980;255:7108–7117. [PubMed] [Google Scholar]
- 38.Huang P, et al. Agonist treatment did not affect association of mu opioid receptors with lipid rafts and cholesterol reduction had opposite effects on the receptor-mediated signaling in rat brain and CHO cells. Brain Res. 2007;1184:46–56. doi: 10.1016/j.brainres.2007.09.096. [DOI] [PMC free article] [PubMed] [Google Scholar]
Associated Data
This section collects any data citations, data availability statements, or supplementary materials included in this article.


