

Abstract
Rationale and Objectives
The hyperpolarized 3He long-range diffusion coefficient (LRDC) in lungs is sensitive to changes in lung structure due to emphysema, reflecting the increase in collateral paths resulting from tissue destruction. However, no clear understanding of LRDC in healthy lungs has emerged. Here we compare LRDC measured in healthy lungs with computer simulations of diffusion along the airway tree with no collateral connections.
Materials and Methods
Computer simulations of diffusion of spatially modulated spin magnetization were performed in computer generated, symmetric-branching models of lungs and compared with existing LRDC measurements in canine and human lungs.
Results
The simulations predict LRDC values of order 0.001 cm2/s, approximately 20 times smaller than the measured LRDC. We consider and rule out possible mechanisms for LRDC not included in the simulations: incomplete breath hold, cardiac motion, and passage of dissolved 3He through airway walls. However, a very low density of small (micron) holes in the airways is shown to account for the observed LRDC.
Conclusion
It is proposed that LRDC in healthy lungs is determined by small collateral pathways.
Keywords: Lung, diffusion MRI, gas MRI, restricted diffusion, long range diffusion, helium
Introduction
The advent of technology for the production of ~liter quantities of hyperpolarized 3He gas allows imaging of the air spaces of lungs. The first use of the technology was to produce ventilation images (1,2,3) which display the distribution of a single bolus of inhaled 3He at breath hold. Subsequently, dynamic 3He MRI was used to show the time evolution of gas distribution, with sub-second time resolution (4,5). A quantitative method for measurement of the local fractional ventilation (the fraction of gas replaced with each breath) has also appeared (6). The local oxygen concentration and its decrease during breath hold have been determined (7,8) from the 3He T1, allowing the local ventilation – perfusion ratio to be calculated (9).
The microstructure of the lung (the acinar airways and alveolar walls) restricts the diffusion of 3He. In emphysema, expansion of the acinar airways and tissue destruction result in less restriction and larger apparent diffusion coefficient (ADC). Measurements of the ADC are commonly performed (10–13) with two b-values, one of which is zero, with bipolar diffusion-sensitizing gradient pulses of 2–5 ms duration (here b is the weighting of the diffusion-sensitizing gradient pulses). For these times, the 3He free diffusivity D0 (in N2 or air) of about 0.88 cm2/s corresponds to rms displacements of about 0.7 mm, large enough to thoroughly explore the interior of a typical acinar airway. Measured ADC values in normal human lungs are approximately 0.2 cm2/s and increase in emphysema; in severely diseased lungs, 0.6 cm2/s is common (11). Likewise, increases of ADC in rats are observed in emphysema (12,14). 3He ADC measurements have yet to enter common clinical practice, though they are regarded as the emerging new gold-standard for characterizing the emphysema-component of COPD. Interest is high in using 3He ADC for early detection of the disease and for following disease progression in drug treatment trials.
Based on existing knowledge of lung acinar structure, the acinar airways have been modeled (15) as long cylinders covered by a sleeve of alveoli. In these structures, diffusion is anisotropic with a large longitudinal value (DL) and a smaller transverse value (DT). The success of the model depends on (i) the major radius of all the acinar airways being nearly constant over the many airway-levels, and (ii) the diffusion time of the pulse sequence (~2ms) being short enough that most gas atoms remain in the same acinar airway throughout this time. This model has been used to analyze data to determine the mean acinar major radius in a normal volunteer, in excellent agreement (5%) with the value accepted from post-mortem measurements. Recent work (16) aims to obtain (primarily from DL) the ratio of minor to major radii, which is a measure of the extent that alveoli enter into the acinar airways. The non-exponential signal decay can also be treated (17) in terms of a power-law expansion of the log of the signal in powers of b. The b2 term (the curvature) can be expressed as the dimensionless kurtosis. The connection between the value of kurtosis and the lung microstructure is not clear, however.
The probability distribution of displacements, P( Δx), can be obtained as the Fourier transform of the signal amplitude with respect to the gradient amplitude. In lung, P(Δx) has been reported (18) to be approximately the sum of two Gaussians, one narrow and one wide. This is equivalent to writing the signal amplitude S(b) as the sum of two decaying exponentials (19).
Long-Range Diffusion
The ADC measurements discussed above use short diffusion times (milliseconds) and so allow the 3He to explore individual acinar airways. Longer diffusion times (seconds) are required for the 3He to explore longer distances, to reveal the connectivity of the airways and acini. Measurements of the long-range diffusion coefficient (LRDC) have appeared, using sinusoidal spatial modulation (20) of the 3He spin magnetization, with modulation wavelengths λ of typically 2–3 cm (21–23). Diffusion occurring after the initial modulation (or tagging, or striping) reduces the amplitude of the modulation; small-angle (FLASH) imaging can follow the decaying amplitude and allow a LRDC value to be determined. By using the longitudinal spin magnetization, the decay due to diffusion can be followed to times of order T1, the longest relaxation time in the spin system. Specifically, the modulated magnetization amplitude S will decay exponentially as (22)
| [1] |
| [2] |
and k = 2π/λ. The relevant diffusion distance is of order λ/2. The LRDC can also be measured with stimulated echo methods (24). The underlying physics is the same as the spatially modulated magnetization method, with the initial spin position encoded in the longitudinal magnetization. The primary difference between the methods is whether the modulation is done in the imaging plane or perpendicular to it. The stimulated echo method allows a wide range of modulation wavelengths and diffusion times to be explored (25).
The LRDC in healthy human volunteers (24,25) and healthy canines (22) has been measured to be about 0.02 cm2/s using λ = 2 cm, approximately 10 times smaller than the 2 ms measurements of ADC. Similar values have been obtained (23) in explanted normal donor lungs (Figure 1). In emphysematous lungs, the LRDC increases substantially, by as much as a factor of 20 (Figure 2). There is evidence (23,26) that the ratiometric increase in LRDC (that is, the measured value divided by the normal value in health) is greater than the ratiometric increase of ADC (ms time scale). A very simplistic view is that restricted diffusivities cannot exceed the free diffusivity, Do; as the normal LRDC is about Do/50 and the normal ADC is about Do/5, the LRDC has substantially “more room to grow”, compared to the ADC.
Figure 1.
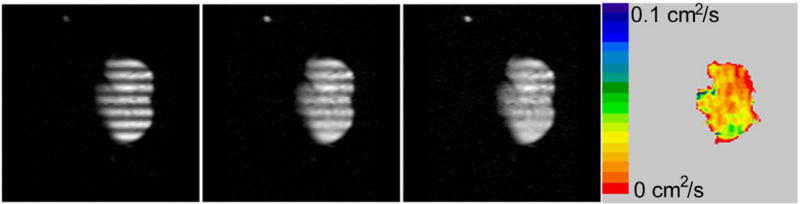
Modulated magnetization images in an explanted normal donor lung at times of 0, 2, and 4 s (frames 1–3) after modulation. The long-range diffusivity LRDC appears in color. The striping wavelength λ is 2 cm in this axial, 30 mm slice with 450 mm field of view and 128 × 128 in-plane matrix.
Figure 2.
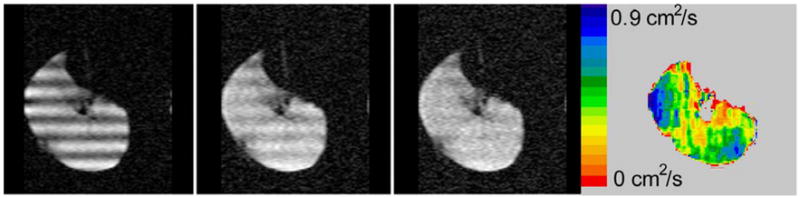
Modulated magnetization images of an explanted lung with COPD stage GOLD-IV. Frames 1–3 are at times of 0, 0.6, and 1.2 s. Note the much larger color scale here for LRDC than in Figure 1. Here λ is 3 cm in this approximately axial slice of 30 mm thickness, field of view of 350 mm and 128 × 128 in-plane matrix.
In emphysema, the diffusion DL along the acinar airways is likely to increase, because the interior of the expanded airways becomes smoother in relative terms (15); the alveolar walls no longer extend so far into the acinar airways. But this increase in DL is limited to a factor of 2, since DL in healthy lungs is approximately D0/2 (15). So only a small part of the very large measured increases in LRDC can arise from the increased diffusivity along the airways. The diffusion transverse to the airways is completely unimportant as the acinar airway radii are much smaller than the relevant distance of λ/2. Thus, it is believed (22,23) that the measured increases in LRDC are due to increased collateral paths. Here, collateral paths are defined as all paths other than the canonical airway tree (27,28). The tissue destruction in emphysema increases the size and number of holes in the airway walls. These collateral paths represent short-circuits, allowing gas to diffuse between points which are nearby in space but are nevertheless quite distant along the airway tree (29). Thus, our current understanding is that LRDC is small in health because to travel between two points 1 cm apart (at least to another acinus), the gas must traverse the tortuous network of airways, finding the node on the airway tree which is common to the two points. With tissue destruction, this condition is greatly relaxed; there are many new, collateral routes between the two points.
But is it so? Is the LRDC in healthy lungs determined by gas diffusing only along the airway tree? Here, we report the results of computer simulations that indicate that LRDC in healthy lungs should be much smaller, if only paths along the airways proper are considered.
Computer Simulations
Healthy lungs were simulated according to the symmetric branching model of Weibel (29, 27); this model has 23 bifurcating levels of airways. In the model, airways are singly-connected, meaning any two points in the airway tree are linked by an unique path. The lengths and radii of the airways were taken from Table 1 of reference 29. Each parent airway gave birth to two daughters, at branching half-angle 40°. At each branch point, the plane of the daughters was rotated by a randomly chosen angle about the axis of the parent airway. The diffusion equation (30) in discrete form (not continuous) was solved for 32 random realizations of the structure, with randomly selected direction and phase of magnetization modulation. The modulation time-decay was fitted to the exponential decay of eqn. [1] and the decay rate constant R was used to determine the LRDC using eqn. [2]. The wavelength λ was set to 2 cm, in agreement with most existing experimental data; this is larger than the mean acinar linear dimension of 6 mm.
Details of the simulation are described elsewhere (31). Here we focus on the implications of the results.
Results
The simulated modulated magnetization decays (31) to nearly zero over a time interval of several hundred seconds. The decay is only approximately exponential; if one fits the time where the modulation has decayed by 1/e, one obtains a decay time constant (1/R) of about 115 s for λ = 2 cm. Using eqn [2], the LRDC in the simulation is thus about 0.001 cm2/s. The 32 random versions of the simulated lung have similar time constants, with a 7% standard deviation. Variation of the branching half-angle from 35 to 45 degrees caused only ± 12% variation in the LRDC.
Discussion
The discrepancy between the simulated and measured LRDC values is extreme, with the measured LRDC 20 times larger. After the earliest measurements of LRDC, the question seemed to be “why is the LRDC so small compared to the ADC measured over milliseconds?” Now the question is “why is the measured LRDC so large?” We note that any routes additional to the airways proper, and so not taken into account in the simulations, could cause the observed discrepancy. We consider several possibilities below.
Lack of breath hold and cardiogenic mixing
Random (diffusive) rms displacements increase roughly as √t while constant velocity motion results in displacement proportional to the diffusion time t (30). Thus, constant velocity motion, compared to diffusive motion, plays a relatively larger role at long diffusion times and long diffusion distances. Hence, motion of the heart and incomplete breath holds must be considered as potential sources of error for LRDC measurements. However, these sources cannot be present in the explanted lungs; we recall that LRDC measured ex vivo is also much larger than the simulation predictions (23). It is possible, of course, that these artifacts are weakly present in vivo.
Permeation through airway walls
What rate of overall, long-range diffusion results from the small permeability of 3He through the airway walls? To estimate the diffusivity due to permeation, we model the lung in Figure 3 as a set of thin parallel membranes of thickness x and spaced by L-x; we assume L ≫ x. The membrane is primarily water (saline or blood), so the solubility of helium in water is used in the form of the Ostwald partition coefficient, s. That is, s is the ratio of 3He concentration in the liquid to that in the gas at equilibrium. Using the same units for the two concentrations, the solubility s is dimensionless. For helium in water, the solubility s (32) is approximately 0.96 ×10⁻². The 3He residing in the membrane diffuses more slowly than in the gas; its diffusivity DW in water may be estimated (33) as several times larger than the self-diffusion of water, thus no larger than 10−4 cm2/s. The overall diffusivity LRDC can be derived by using Fick’s law of diffusive flux,
Figure 3.
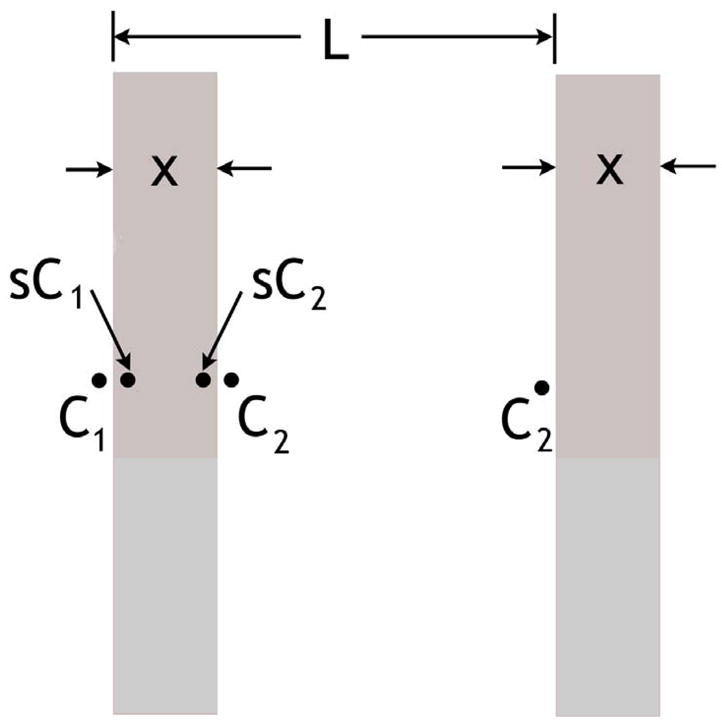
Periodic structure of length L of thin walls used to model effect of diffusion through lung airway walls. The concentrations C are shown at the relevant locations, spanning one unit of the periodic structure. The dimensionless solubility is s. The walls extend indefinitely in the vertical direction and perpendicular to the page.
| [3] |
Here the flux is measured in particles (or spins) per time per area and C is in particles (or spins) per volume.
We consider the concentrations C at the specified points in Figure 3, over the length L of one period. The simple geometry of Figure 3 does not capture the details of the airway tree; this is of no concern, as the diffusion along the airways has already been considered in the simulations and found to result in much smaller LRDC than the measured values. We assume that concentration equilibrium occurs along each gas-membrane interface and that the gas phase diffusion is infinitely rapid (more precisely, the diffusive bottleneck occurs in the membranes). Thus, the concentration variation across each gas-phase region is negligible. At steady-state, the flux from left to right in Figure 3 is the same across each membrane and airspace. Examining just the membrane, we write eqn. [3] above as
| [4] |
In terms of the structure of length L, we express the overall diffusivity LRDC using eqn. [3] in the same way,
| [5] |
Equating the two expression for the flux J, we obtain
| [6] |
This result is correct when the LRDC so determined is much smaller than the gas free diffusion, D0. Using the above values of DW and s and setting L = 600 μm and x = 6 μm, reasonable estimates for acinar airways (27), we obtain LRDC = 10−4 cm2/s. This is much smaller than the observed values of LRDC and even much smaller than the computer simulated results. We note that the gas-phase diffusivity is not infinite, which will make the overall diffusivity LRDC only (slightly) smaller. In the same way, lack of equilibrium of the concentration at the gas-liquid surfaces will also reduce LRDC. Overall, the diffusion through the structure of Figure 3 can be regarded as several processes in series, so the overall diffusivity is no larger than the result of eqn. [6]. We conclude that this mechanism is negligible, as a result of the low solubility of 3He in water and its slow diffusion in water. We note that eqn. [6] was derived using a linear concentration (or spin magnetization) variation along x, but the result is fully general for length scales longer than L.
The above mechanism can be enhanced by the flow of blood in the capillary bed. Thus, 3He can dissolve through the airway walls and into the blood and then be swept to distant locations. The process is completed by 3He returning to the air space. In any event, this mechanism is certainly not applicable to the results for ex vivo lungs and so it can not explain the discrepancy of measured and simulated LRDC.
Diffusion through holes
Next we consider diffusion through isolated small holes in the walls of Figure 3. Again, we approach the problem by calculating the diffusive flux with Fick’s law, eqn. [3]. As in Figure 4, consider each wall of area A to have a single hole of radius r; the concentrations on the two sides of the wall are C1 and C2, far from the hole. The concentration in each region will be essentially constant, except within a distance of about r from the hole. Thus, the concentration is expected to vary from C1 to C2 along the dashed line path of length 2r passing through the center of the hole in Figure 4. The diffusive flux J from eqn. [3] times the area πr2 is the diffusive current I,
Figure 4.
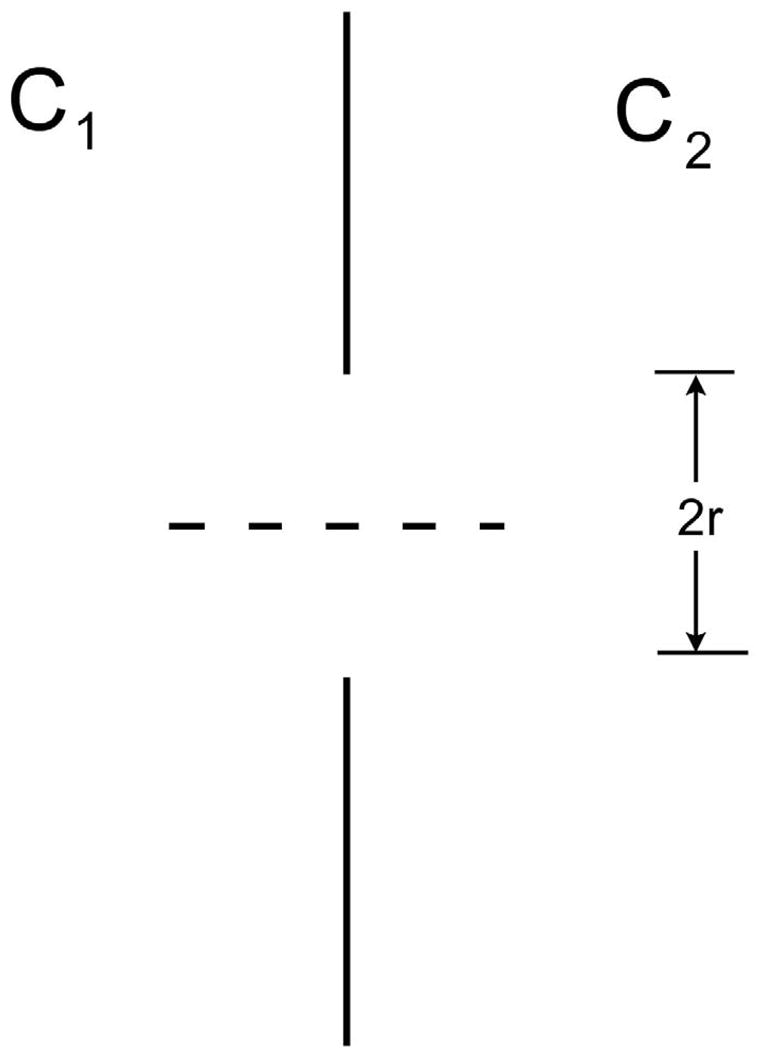
Wall of area A with a single hole of radius r. Along the path of the dashed line, the concentration changes by approximately C1 – C2 in distance 2r.
| [7] |
here, D0 is the free diffusivity of the gas. This result, aside from the numerical factor (which is only approximate), can be obtained by dimensional analysis.
A proper treatment of the problem involves the steady-state solution of the diffusion equation, ∇2c = 0 where c is concentration (spin magnetization). It turns out that this is exactly analogous to the problem of finding the electrical conductance of the single short throat of radius r connecting two large regions, all with conductivity σ. This result is current
| [8] |
This result is obtainable from the electrostatic capacitance CA of a conducting disk relative to a (grounded) surrounding conductor at infinity. The result is given by Smythe (34) as CA = 8ε0r, where ε0 is the permittivity of free space. Thus, the capacitance to top or bottom alone is 4ε0r; the electrostatic and electrical conduction equations are analogous upon substituting the electrostatic ε0 for the electrical conductivity σ. We note that the two electrical conductances of 4σr in series form a single, net conductance of 2σr. In terms of diffusion, the diffusive conductance of the hole is therefore correctly given by
| [9] |
which differs numerically only slightly from the simple estimate of eqn. [7]. This result has been confirmed by numerical solution of ∇2c = 0. The result also appears in Berg (35).
Considering a wall with N well-separated holes per area A, the overall flux J, averaged over the area of the wall, will be
| [10] |
Viewed overall, J can be expressed in terms of the overall diffusivity LRDC and the overall concentration gradient (C2-C1)/L,
| [11] |
giving
| [12] |
where n is the number density of holes, n=N/A.
We note that a remarkably small density of small holes can account for the measured values of LRDC. For example, for holes of radius r = 5 μm = 5 × 10⁻³ mm (consistent with what is known of pores of Kohn (28,36)) and wall spacing L=600 μm, the hole density must be n=330 holes/cm2 to account for the observed LRDC/D0 ≅ 1/50. For a regular square pattern of holes, this is a hole spacing of 0.55 mm, of order one hole in each alveolar wall. If each hole is larger, then an even smaller density of holes is required. The fraction F of wall that must be hole to explain the observed LRDC is surprisingly small. In the above example, the fraction is F=nπr2=2.6×10⁻⁴. We note that, because of the linear (not quadratic) dependence of LRDC upon r, the fraction F will depend on the hole radius r, for given values of LRDC/D0 and L.
The calculated LRDC of such a small density of very small holes suggests that these collateral paths may explain the factor of 20 discrepancy between the simulated and measured long-range diffusivities. However, we do not intend the above numerical values of hole density and radius to be taken as measurements or facts, but only as estimates that are certainly in accord with what is known about collateral paths. That is, such a density and radius of holes is plausible. We note that other passages, those of Lambert and Martin, have been discussed (28).
It is a well known result that the collateral airflow resistance (37–42) is much larger than the airway resistance in normal human lungs. Thus, it is at first surprising that the long-range diffusion through collateral paths appears to be more important than the diffusion along the airway tree itself. However, we note two important differences. First, the collateral airflow resistances have been measured using the wedged catheter technique, typically at the level of individual lobes, segments, or sub-segments (28,38,42) (certainly in the conductive zone). The diffusive paths discussed above are presumably at a level to connect one acinus to its neighbor, so the relevant collateral paths are at a much lower level in the lung (in the diffusive zone). Second, the measured resistances involve hydrodynamic flow; we recall that laminar flow in a tube of radius r varies as r4, for a fixed pressure differential and length (43). By comparison, the diffusive transport is proportional to r2 (note the difference here with the case of a hole of no length, eqn. [7]).
Thus, a set of very small holes may offer a high resistance to transport by flow yet serve as an important path for diffusion. The fundamental distinction is that hydrodynamic flow resistance occurs at the cylinder wall while diffusion encounters resistance across the entire cross-section.
A recent calculation of diffusion within single acini has appeared (44), suggesting that the results explain the LRDC in healthy lungs. We note that the length scale is not specified, but can be no larger than the linear size of acini, about 6 mm. Because this is smaller than the striping wavelength, complete diffusion randomization within each acinus can only slightly reduce the stripe amplitude, from unity to approximately 0.75 for λ = 2 cm (31). Thus, intra-acinar diffusion can not explain the decay of stripes with λ = 2 cm and longer.
Conclusions
Long range diffusion (LRDC) measurements involve modulation of 3He longitudinal spin magnetization with wavelengths of 2 or 3 cm. Values near 0.02 cm2/s have been determined previously in vivo in normal dogs (22) and human volunteers (21) as well as ex vivo in normal human donor lungs (23). These values are similar to those measured using the stimulated echo method (24,25). Computer simulations of the diffusive decay of modulated magnetization have been performed in symmetric-branching model lungs. The simulations predict LRDC values approximately 20 times smaller than the measured values. Several possible sources of the large discrepancy are examined and ruled out: cardiac motion, incomplete breath hold, and diffusion of 3He through the airway walls by dissolving into the membranes. However, consideration of the diffusion through a single hole shows it is proportional to the radius (not radius-squared). We calculate that a remarkably small density of small holes in the airway walls can account for the observed LRDC. For the numerical values used, n = 330 hole/cm2 and r = 5 μm, the fraction of each wall that must be hole is less than 0.03%. We conclude that collateral paths may determine the LRDC in healthy lungs, just as they are believed to be responsible for the greatly enhanced LRDC values found in emphysematous lungs.
Acknowledgments
The authors appreciate helpful discussions with J.D. Cooper, J.C. Hogg, S.S. Lefrak, P.T. Macklem, and A.L. Sukstanskii concerning collateral ventilation. We thank M.H. Israel for suggesting Smythe’s text for the electrostatic solution and thank A.E. Carlsson for pointing out Berg’s book. Research support is gratefully acknowledged from NIH grants R01 HL70037, R01 HL72369 and P50-HL084922. The generous loan of a 3He polarizer from the General Electric Company is appreciated.
Footnotes
Publisher's Disclaimer: This is a PDF file of an unedited manuscript that has been accepted for publication. As a service to our customers we are providing this early version of the manuscript. The manuscript will undergo copyediting, typesetting, and review of the resulting proof before it is published in its final citable form. Please note that during the production process errors may be discovered which could affect the content, and all legal disclaimers that apply to the journal pertain.
References
- 1.Möller HE, Chen XJ, Saam B, Hagspiel KD, Johnson GA, Altes TA, de Lange EE, Kauczor H-U. MRI of the lungs using hyperpolarized noble gases. Magn Reson Med. 2002;47:1029–1051. doi: 10.1002/mrm.10173. [DOI] [PubMed] [Google Scholar]
- 2.Leawoods JC, Yablonskiy DA, Saam BT, Gierada DS, Conradi MS. Hyperpolarized 3He gas MR imaging. Concepts Magn Reson. 2001;13:277–293. [Google Scholar]
- 3.Hoffman EA, van Beek E. Hyperpolarized media MR imaging – Expanding the boundaries? Acad Rad. 2006;13:929–931. doi: 10.1016/j.acra.2006.06.002. [DOI] [PubMed] [Google Scholar]
- 4.Saam BT, Yablonskiy DA, Gierada DS, Conradi MS. Rapid imaging of hyperpolarized gas using EPI. Magn Reson Med. 1999;42:507–514. doi: 10.1002/(sici)1522-2594(199909)42:3<507::aid-mrm13>3.0.co;2-u. [DOI] [PubMed] [Google Scholar]
- 5.Salerno M, Altes TA, Brookeman JR, de Lange EE, Mugler JP., III Dynamic spiral MRI of pulmonary gas flow using hyperpolarized 3He: preliminary studies in healthy and diseased lungs. Magn Reson Med. 2001;46:667–677. doi: 10.1002/mrm.1244. [DOI] [PubMed] [Google Scholar]
- 6.Deninger AJ, Mansson S, Petersson JS, et al. Quantitative measurement of regional lung ventilation using 3He MRI. Magn Reson Med. 2002;48:223–232. doi: 10.1002/mrm.10206. [DOI] [PubMed] [Google Scholar]
- 7.Deninger AJ, Eberle B, Ebert M, et al. Quantification of regional intrapulmonary oxygen partial pressure evolution during apnea by 3He MRI. J Magn Reson. 1999;141:207–216. doi: 10.1006/jmre.1999.1902. [DOI] [PubMed] [Google Scholar]
- 8.Fischer MC, Kadlecek S, Yu JS, Ishii M, Emami K, Vahdat V, Lipson DA, Rizi RR. Measurements of regional alveolar oxygen pressure using hyperpolarized He-3 MRI. Acad Rad. 2005;12:1430–1439. doi: 10.1016/j.acra.2005.07.007. [DOI] [PubMed] [Google Scholar]
- 9.Rizi RR, Baumgardner JE, Ishii M, et al. Determination of regional VA/Q by hyperpolarized 3He MRI. Magn Reson Med. 2004;52:65–72. doi: 10.1002/mrm.20136. [DOI] [PubMed] [Google Scholar]
- 10.Salerno M, de Lange EE, Altes TA, Truwit JD, Brookeman JR, Mugler JP. Emphysema: hyperpolarized helium 3 diffusion MR imaging of the lungs compared with spirometric indexes – initial experience. Radiology. 2002;222:252–260. doi: 10.1148/radiol.2221001834. [DOI] [PubMed] [Google Scholar]
- 11.Saam BT, Yablonskiy DA, Kodibagkar VD, Leawoods JC, Gierada DS, Cooper JD, Lefrak SS, Conradi MS. MR imaging of diffusion of He-3 gas in healthy and diseased lungs. Magn Reson Medicine. 2000;44:174–179. doi: 10.1002/1522-2594(200008)44:2<174::aid-mrm2>3.0.co;2-4. [DOI] [PubMed] [Google Scholar]
- 12.Chen XJ, Hedlund LW, Möller HE, Chawla S, Maronpot RR, Johnson GA. Detection of emphysema in rat lungs by using magnetic resonance measurements of 3He diffusion. Proc Natl Acad Sci USA. 2000;97:11478–11481. doi: 10.1073/pnas.97.21.11478. [DOI] [PMC free article] [PubMed] [Google Scholar]
- 13.Conradi MS, Yablonskiy DA, Woods JC, Gierada DS, Jacob RE, Chang YV, Choong CK, Sukstanskii AL, Tanoli T, Lefrak SS, Cooper JD. 3He diffusion MRI of the lung. Acad Rad. 2005;12:1406–1413. doi: 10.1016/j.acra.2005.07.006. [DOI] [PMC free article] [PubMed] [Google Scholar]
- 14.Peces-Barba G, Ruiz-Cabello J, Cremillieux Y, et al. Helium-3 MRI diffusion coefficient: correlation to morphometry in a model of mild emphysema. Eur Respir J. 2003;22:14–19. doi: 10.1183/09031936.03.00084402. [DOI] [PubMed] [Google Scholar]
- 15.Yablonskiy DA, Sukstanskii AL, Leawoods JC, Gierada DS, Bretthorst GS, Lefrak SS, Cooper JD, Conradi MS. Quantitative in vivo assessment of lung microstructure at the alveolar level with hyperpolarized 3He diffusion MRI. Proceeding National Academy of Sciences. 2002;99:3111–3116. doi: 10.1073/pnas.052594699. [DOI] [PMC free article] [PubMed] [Google Scholar]
- 16.Sukstanskii AL, Conradi MS, Yablonskiy DA. Relationship between 3He gas ADCs and lung microstructure. Computer simulations. Proc Intl Soc Magn Reson Med. 2007;15:1335. [Google Scholar]
- 17.Jensen JH, Helpern JA, Ramani A, Hanzhang L, Kaczynski K. Diffusion kurtosis imaging: the quantification of non-Gaussian water diffusion by means of magnetic resonance imaging. Magn Reson Med. 2005;53:1432–1440. doi: 10.1002/mrm.20508. [DOI] [PubMed] [Google Scholar]
- 18.Shanbhag DD, Altes TA, Miller GW, Mata JF, Knight-Scott J. Q-space analysis of lung morphmetry in vivo with hyperpolarized 3He spectroscopy. J Magn Reson Imag. 2006;24:84–94. doi: 10.1002/jmri.20618. [DOI] [PubMed] [Google Scholar]
- 19.Shanbhag DD, Altes TA, Mata JF, Miller GW, Knight-Scott J. SNR performance of Q-space formalism and multi-exponential modeling for hyperpolarized 3He gas diffusion spectroscopy in human lungs. Proc Intl Soc Magn Reson Med. 2007;15:1286. [Google Scholar]
- 20.Alex L, Dougherty L. MR imaging of motion with spatial modulation of magnetization. Radiology. 1989;171:841–845. doi: 10.1148/radiology.171.3.2717762. [DOI] [PubMed] [Google Scholar]
- 21.Owers-Bradley JR, Bennattayalah A, Fichele S, McGloin JC, Bowtell R, Morgan PS, Moody AR. Diffusion and tagging of hyperpolarized 3He in the lungs. Proc 10th Annual Meeting International Society for Magnetic Resonance in Medicine; Honolulu, Hawaii. 2002. p. 2016. [Google Scholar]
- 22.Woods JC, Yablonskiy DA, Chino K, Tanoli TSK, Cooper JD, Conradi MS. Magnetization tagging decay to measure long-range 3He diffusion in healthy and emphysematous canine lungs. Magn Reson Med. 2004;51:1002–1008. doi: 10.1002/mrm.20070. [DOI] [PMC free article] [PubMed] [Google Scholar]
- 23.Woods JC, Choong CK, Yablonskiy DA, Chino K, Macklem PT, Pierce JA, Cooper JD, Conradi MS. Long-range diffusion of hyperpolarized 3He in excised normal and emphysematous human lungs via magnetization tagging. J Appl Physiology. 2005;99:1992–1997. doi: 10.1152/japplphysiol.00185.2005. [DOI] [PMC free article] [PubMed] [Google Scholar]
- 24.Wang C, Miller GW, Altes TA, de Lange EE, Cates GD, Jr, Mugler JP., III Time dependence of 3He diffusion in the human lung: measurement in the long-time regime using stimulated echoes. Magn Reson Med. 2006;56:296–309. doi: 10.1002/mrm.20944. [DOI] [PubMed] [Google Scholar]
- 25.Wang C, Miller GW, Altes TA, de Lange EE, Brookeman JR, Cates GD, Jr, Mugler JP., III Measuring medium and long-time-scale regional 3He diffusion using stimulated echoes. Proc Intl Soc Magn Reson Med. 2007;15:458. [Google Scholar]
- 26.Wang C, Altes TA, Miller GW, de Lange EE, Ruppert K, Brookeman JR, Mata JF, Cates GD, Jr, Mugler JP., III Short-time-scale and long-time-scale 3He diffusion MRI in emphysema: which is more sensitive? Proc Intl Soc Magn Reson Med. 2007;15:941. [Google Scholar]
- 27.West JB. Respiratory physiology. 5. Baltimore, MD: Williams & Wilkins; 1995. pp. 21–30. [Google Scholar]
- 28.Menkes HA, Macklem PT. In: Collateral flow. In Handbook of physiology, section 3: The respiratory system. Fishman AP, editor. Bethesda MD: Amer Physiological Society; 1977. pp. 337–353. [Google Scholar]
- 29.Weibel ER. Design of airways and blood vessels considered as branching trees. In: Crystal RG, West JB, Barnes PJ, Weibel ER, editors. The lung: scientific foundations. 2. Philadelphia: Lippencott-Raven; 1997. pp. 1061–1071. [Google Scholar]
- 30.Mathews J, Walker RL. Mathematical methods of physics. Menlo Park, CA: WA Benjamin; 1970. pp. 217–252. [Google Scholar]
- 31.Bartel SET, Haywood SE, Woods JC, Chang YV, Menard C, Yablonskiy DA, Gierada DS, Conradi MS. Simulations and measurements of long-range diffusion of gas in lungs. In preparation. [Google Scholar]
- 32.Lide DR, editor. CRC handbook of chemistry and physics. 85. Boca Raton. FL: CRC Press; 2004. pp. 8–87. [Google Scholar]
- 33.Kirchner B, Stubbs J, Marx D. Fast anomalous diffusion of small hydrophobic species in water. Phys Rev Lett. 2002;89:215901–215904. doi: 10.1103/PhysRevLett.89.215901. [DOI] [PubMed] [Google Scholar]
- 34.Smythe WR. Static and dynamic electricity. New York, NY: McGraw-Hill; 1968. p. 124. [Google Scholar]
- 35.Berg HC. Random walks in biology. Princeton NJ: Princeton U; 1993. [Google Scholar]
- 36.Bastacky J, Goerke J. Pores of Kohn are filled in normal lungs: low-temperature scanning electron microscopy. J Appl Physiol. 1992;73:88–95. doi: 10.1152/jappl.1992.73.1.88. [DOI] [PubMed] [Google Scholar]
- 37.Woolcock AJ, Macklem PT. Mechanical factors influencing collateral ventilation in human, dog and pig lungs. J Appl Physiol. 1971;30:99–115. doi: 10.1152/jappl.1971.30.1.99. [DOI] [PubMed] [Google Scholar]
- 38.Terry PB, Traystman RJ, Newball HH, Batra G, Menkes HA. Collateral ventilation in man. New Engl J Med. 1978;298:10–15. doi: 10.1056/NEJM197801052980103. [DOI] [PubMed] [Google Scholar]
- 39.Hogg JC, Macklem PT, Thurlbeck WM. The resistance of collateral channels in excised human lungs. J Clin Invest. 1969;48:421–431. doi: 10.1172/JCI105999. [DOI] [PMC free article] [PubMed] [Google Scholar]
- 40.Macklem PT. Collateral ventilation. New Engl J Med. 1978;298:49–50. doi: 10.1056/NEJM197801052980112. [DOI] [PubMed] [Google Scholar]
- 41.Cetti EJ, Moore AJ, Geddes GM. Collateral ventilation. Thorax. 2006;61:371–373. doi: 10.1136/thx.2006.060509. [DOI] [PMC free article] [PubMed] [Google Scholar]
- 42.Inners CR, Terry PB, Traystman RJ, Menkes HA. Effects of lung volume on collateral and airway resistance in man. J Appl Physiol. 1979;46:67–73. doi: 10.1152/jappl.1979.46.1.67. [DOI] [PubMed] [Google Scholar]
- 43.Kundu PK, Cohen IM. Fluid mechanics. 2. New York: Academic; 2002. [Google Scholar]
- 44.Verbanck S, Paiva M. Simulation of the apparent diffusion of helium-3 in the human acinus. J Appl Physiol. 2007;103:249–254. doi: 10.1152/japplphysiol.01384.2006. [DOI] [PubMed] [Google Scholar]