Abstract
A recently developed ultrasound technique is evaluated by measuring the behavior of a cavitation bubble that is induced in water by a femtosecond laser pulse. The passive acoustic emission during optical breakdown is used to estimate the location of the cavitation bubble’s origin. In turn, the position of the bubble wall is defined based on the active ultrasonic pulse-echo signal. The results suggest that the developed ultrasound technique can be used for quantitative measurements of femtosecond laser-induced microbubbles.
The use of femtosecond lasers in medical applications has significantly increased in recent years. Owing to the low energy threshold of bubble formation, the femtosecond laser breakdown has become an established tool for precision microsurgery of tissues and cells [1]. Ultrasound monitoring of the bubble formation can potentially be a useful tool to control the photodisruption process in real time [2–6], especially where optical methods are not feasible. Recently, we described an ultrasound technique that can be used to monitor the spatial and temporal behavior of the cavitation bubble after an optical breakdown [5,6]. This technique, based on recording the passive acoustic emission and active ultrasonic pulse echoes, was used to estimate the location and size of the bubbles induced by a nanosecond laser pulse in water and gelatin phantoms. The results of the ultrasound estimations were compared with both the optical measurements of the stationary bubble and the theoretical estimates of the bubble dynamics, which were derived from the Rayleigh model of a cavity collapse. In this Letter, we evaluate the previously developed ultrasound technique by measuring the behavior of cavitation bubbles induced by femtosecond laser pulses in water.
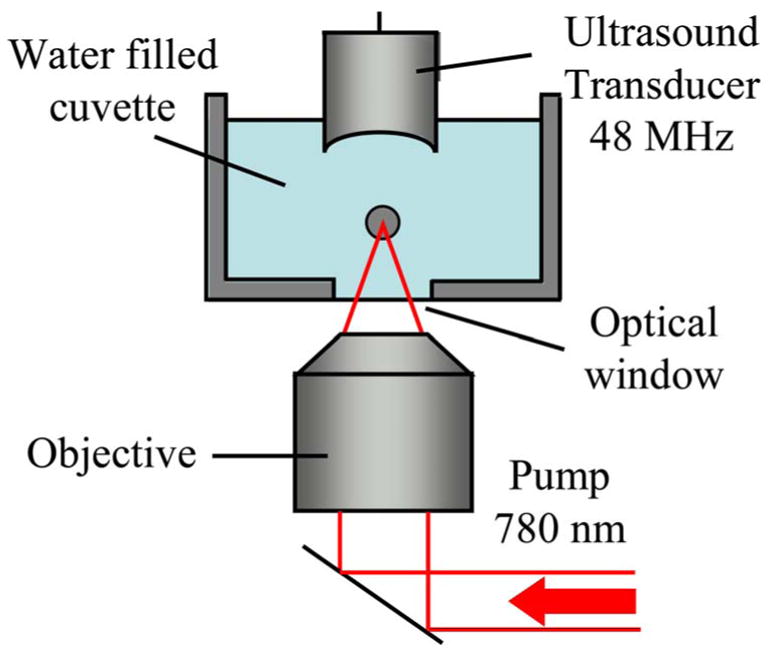
A schematic of the experimental setup is shown in Fig. 1. A 220 fs 780 nm wavelength pump pulse from an amplified Ti:sapphire laser (Spitfire, Spectra Physics Inc.) was focused into a water filled cuvette with a 100 μm thick glass optical window using a microscope objective (64×/1.4 oil immersion, Carl Zeiss MicroImaging Inc.). A single laser pulse was used to generate the cavitation bubble 95 μm above the glass surface. To detect passive acoustic emissions and to acoustically probe the cavitation bubble, an ultrasound pulser–receiver (model 5910PR, Panametrics Inc.) and a custom-built single element transducer with a 5.5 mm focal length, an f-number of 1.4, and a 48 MHz center frequency were used. The foci of the objective and the ultrasound transducer were aligned prior to the experiment. The acoustic signal was pre-amplified and recorded using an 8 bit analog-to-digital converter (GageScope Inc.) operating at a 500 MS/s sampling rate. To probe the cavitation bubble at different times, a function generator (model 33250A, Agilent, Inc.) was used to trigger the ultrasound pulser. The ultrasound pulse was initiated with a variable delay between laser and ultrasound pulses.
Fig. 1.

(Color online) Schematic of the experimental setup for the ultrasound measurement of the dynamics of laser-induced breakdown in water.
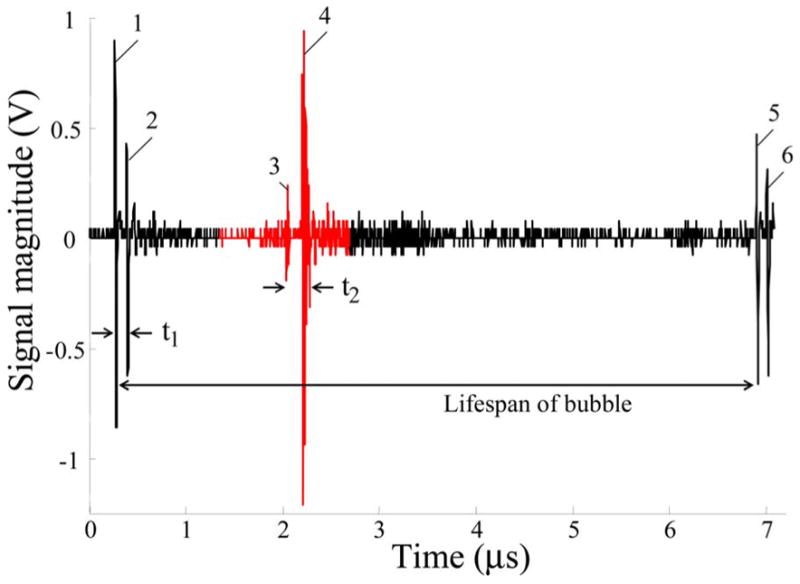
A typical acoustic signal record for the femtosecond laser pulse is presented in Fig. 2. When a sufficiently intense laser beam is focused into water, a high density plasma is produced at the focal volume, and a shock wave is generated from the origin of the optical breakdown [1]. The shock wave and its reflection from the glass surface are detected by the ultrasound transducer. The time shift t1 between these two signals identifies the location of the origin of the optical breakdown relative to the bottom. Note that time shift t1 does not depend on the speed of the shock wave but only on the speed of sound when the distance between the transducer and the point of an optical breakdown is greater than the length of shock-to-acoustic wave conversion [6]. The high-density plasma expands and forms a cavitation bubble. The ultrasound pulse, sent into the medium with a desired time delay prior to or after the laser pulse (i.e., the delay between ultrasound and laser pulses could be both positive and negative), is reflected from the top surface of the bubble as well as from the glass bottom. Therefore, based on the time shift t2 between bubble and glass reflections and accounting for the speed of sound c, the radius R of the cavitation bubble can be assessed for any time τ determined by the user-defined time delay between ultrasound and laser pulses and the time required for the wave to travel from the transducer to the bubble wall:
| (1) |
Fig. 2.

(Color online) Typical ultrasound rf data record containing both passive and active acoustic signals. (1) Shock wave generated by optical breakdown; (2) same shock wave reflected from the glass surface; (3) active ultrasound pulse-echo reflected from the bubble; (4) active ultrasound pulse-echo from the glass surface; (5) the shock wave generated by the bubble collapse; (6) same shock wave reflected from the glass surface.
It is worth mentioning that the bubble radius can be estimated without using the reflections from the glass surface, which is based on the distance estimated relative to the transducer position. However, the use of the reflected waves to estimate the bubble radius requires only the knowledge of the speed of sound and, therefore, avoids the problems associated with the estimation of the shock wave speed that is generally higher than the speed of sound. A comparison of these two approaches is presented in detail elsewhere [6].
As shown in Fig. 2, the bubble collapse produces a second shock wave. A difference between the registration time of the first and second shock waves defines the lifetime of the bubble. The developed ultrasound technique does not rely on the detection of the shock wave associated with the cavity collapse. In the experiments, however, the lifetime of the bubble was used to verify the technique, using the Rayleigh model of spherical cavity collapse in an incompressible liquid [7]. To fully describe the bubble dynamics, it was assumed that expansion of the bubble and its subsequent collapse are symmetric processes [5,6,8].
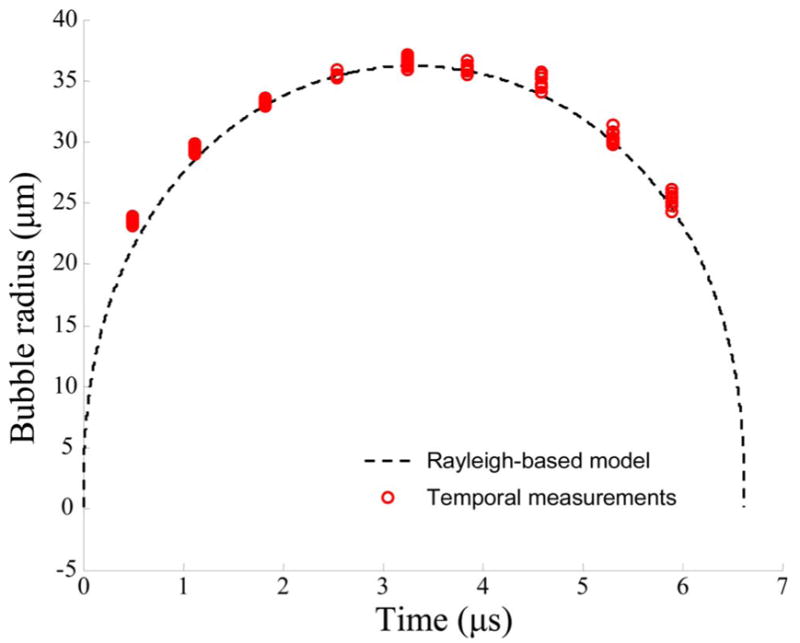
Two sets of experiments were performed. In the first set, a laser energy of 200 nJ was used, and different time delays between ultrasound and laser pulses were introduced to study the dynamics of the bubble. The measured behavior was compared with that estimated from the Rayleigh model. The delay was chosen to probe bubbles 0.5 μs after breakdown and then every 0.68 μs. Ten measurements were made for each delay. To calculate the bubble radius, Eq. (1) was used, where the speed of sound is assumed to be 1500 m/s. The estimated lifetime of the bubbles was 6.6±0.1 μs (mean value and standard deviation). Figure 3 shows the dependence of the bubble radius on time and its comparison with theoretical predictions. Ten experimental measurements are plotted for each time point. The theoretical dependence of the bubble radius was calculated based on the Rayleigh model [7], assuming no vapor pressure inside the bubble, 100 kPa for atmospheric pressure, 1000 kg/m3 for the density of water, and a cavity collapse duration of 3.3 μs (half of the lifetime). Figure 3 demonstrates a good agreement between the ultrasonically measured and theoretically predicted bubble behavior. Within the limits of experimental error, bubbles symmetrically grow and collapse around the point of the maximum radius. In comparison with the results obtained using nanosecond laser pulses [5,6], the distribution of the bubble sizes and lifetimes is much smaller. For example, the standard deviation for the bubble radii shown in Fig. 3 is in the range from 0.18 to 0.54 μm.
Fig. 3.

(Color online) Comparison of the ultrasonically measured radius with the theoretical predictions of the bubble radius as a function of time for the laser energy of 200 nJ.
Because the ratio of distance between the bubble origin and the solid boundary to the maximum radius (stand-off parameter) was slightly less than 3, we cannot completely exclude the impact of the solid boundary on the results of these experiments. The boundary causes a prolongation of the collapse time. However, for a stand-off parameter more than 2, the collapse time increase should not exceed 10% [9].
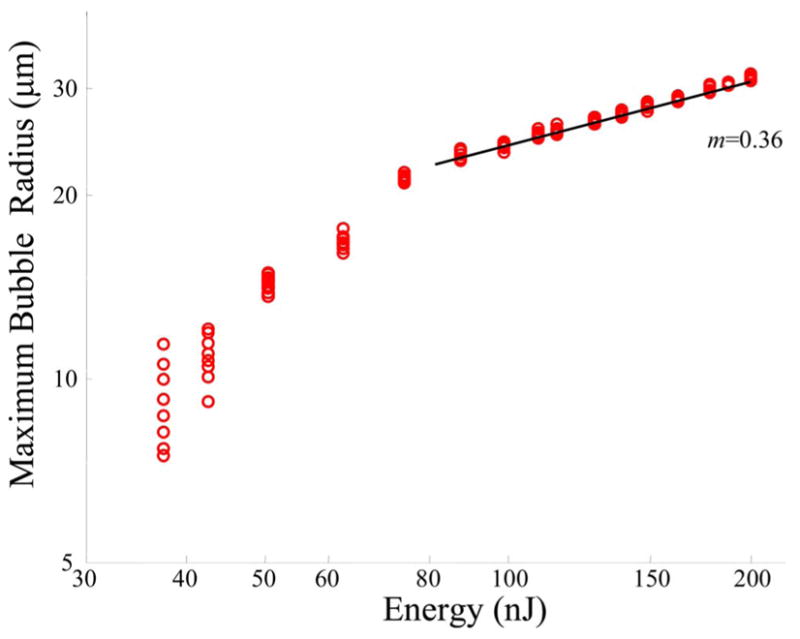
Figure 4 presents the results of the second set of experiments in a logarithmic scale, where the maximum bubble radius was measured as a function of the laser pulse energy in the range from 38 to 200 nJ. Ten measurements were performed for each energy value. The first measurement was used to estimate the time between bubble formation and collapse and to choose the time delay, such that the bubble size was measured in the middle of its lifetime (i.e., when the bubble radius reaches a maximum). As seen in Fig. 4 the maximum bubble radius is monotonically increasing with the energy of the laser pulse. For laser pulse energies higher than 80 nJ, the maximum bubble size is approximately proportional to the cube root of the laser pulse. The slope of the best fitting straight line is 0.36, compared to the slope value of 1/3, which represents perfect agreement. However, in the low energy range, this relationship breaks down, since the pulse energy is close to the optical breakdown threshold. These results are in good agreement with previously published experimental data obtained for nanosecond and picosecond laser breakdowns in water [10,11]. In addition, the results are also in agreement with the recent data for a femto-second laser [12], where bubble radii were measured close to the optical breakdown threshold. For low energies, the data distribution is significantly higher, but this can be explained by the current characteristics of the ultrasound probe. For low laser pulse energies the ultrasound wavelength (~30 μm) becomes larger than the bubble diameter, which could significantly increase the experimental error. For smaller bubbles, a higher frequency and, therefore, smaller wavelength ultrasound should be used.
Fig. 4.

(Color online) Maximum cavitation bubble radius as a function of the laser pulse energy (logarithmic scale). The straight line has a slope of 0.36, the best fit for high energies.
In conclusion, the ultrasound technique for monitoring the spatial and temporal behavior of a cavitation bubble produced by a single femtosecond laser pulse was developed and tested. The measurements of the cavitation bubble size were compared with estimates obtained from the Rayleigh model of cavity collapse. Maximum radii of the bubbles were measured as a function of the laser pulse energy. Our preliminary results showed that the developed ultrasound technique can be used to reliably measure the sizes of microbubbles induced by femtosecond laser pulses.
Acknowledgments
This work was partially supported by the National Institutes of Health under grants EB004963, EY018081, and NS060129 and by the National Science Foundation under grants BES-0548673 and BES-0508266. We thank Geoff Lockwood (Department of Physics, Engineering Physics, and Astronomy at the Queen’s University, Canada) for providing the ultrasound transducer.
References
- 1.Vogel A, Noack J, Huttman G, Paltauf G. Appl Phys. 2005;B 81:1015. [Google Scholar]
- 2.Milas SM, Ye JY, Norris TB, Hollman KW, Emelianov SY, O’Donnell M. IEEE Trans Ultrason Ferroelectr Freq Control. 2003;50:517. [Google Scholar]
- 3.Tse C, Zohdy MJ, Ye JY, Norris TB, Balogh LP, Hollman KW, O’Donnell M. IEEE Trans Ultrason Ferroelectr Freq Control. 2005;52:1962. doi: 10.1109/tuffc.2005.1561665. [DOI] [PubMed] [Google Scholar]
- 4.Zohdy MJ, Tse C, Ye JY, O’Donnell M. IEEE Trans Ultrason Ferroelectr Freq Control. 2006;53:117. doi: 10.1109/tuffc.2006.1588397. [DOI] [PubMed] [Google Scholar]
- 5.Karpiouk AB, Aglyamov SR, Bourgeois F, Ben-Yakar A, Emelianov SY. Proc SPIE 64350P. 2007 [Google Scholar]
- 6.Karpiouk AB, Aglyamov SR, Bourgeois F, Ben-Yakar A, Emelianov SY. J Biomed Opt. doi: 10.1117/1.2937478. (to be published) [DOI] [PMC free article] [PubMed] [Google Scholar]
- 7.Leighton GT. The Acoustic Bubble. Academic; 1994. [Google Scholar]
- 8.Buogo S, Cannelli GB. J Acoust Soc Am. 2002;111:2594. doi: 10.1121/1.1476919. [DOI] [PubMed] [Google Scholar]
- 9.Vogel A, Lauterborn W. J Acoust Soc Am. 1988;84:719. [Google Scholar]
- 10.Zysset B, Fujimoto JG, Deutsch TF. Appl Phys. 1989;B 48:139. [Google Scholar]
- 11.Vogel A, Busch S, Jungnickel K, Birngruber R. Lasers Surg Med. 1994;15:32. doi: 10.1002/lsm.1900150106. [DOI] [PubMed] [Google Scholar]
- 12.Vogel A, Linz N, Freidank S, Paltauf G. Phys Rev Lett. 2008;100:038102. doi: 10.1103/PhysRevLett.100.038102. [DOI] [PubMed] [Google Scholar]


