Abstract
During most infections, the population of immune cells known as macrophages are key to taking up and killing bacteria as an integral part of the immune response. However, during infection with Mycobacterium tuberculosis (Mtb), host macrophages serve as the preferred environment for mycobacterial growth. Further, killing of Mtb by macrophages is impaired unless they become activated. Activation is induced by stimulation from bacterial antigens and inflammatory cytokines derived from helper T cells. The key macrophage-activating cytokines in Mtb infection are tumor necrosis factor-α (TNF) and interferon (IFN)-γ. Due to differences in cellular sources and secretion pathways for TNF and IFN- γ, the possibility of heterogeneous cytokine distributions exists, suggesting that the timing of macrophage activation from these signals may affect activation kinetics and thus impact the outcome of Mtb infection. Here we use a mathematical model to show that negative feedback from production of nitric oxide (the key mediator of mycobacterial killing) that typically optimizes macrophage responses to activating stimuli may reduce effective killing of Mtb. Statistical sensitivity analysis predicts that if TNF and IFN-γ signals precede infection, the level of negative feedback may have a strong effect on how effectively macrophages kill Mtb. However, this effect is relaxed when IFN-γ or TNF + IFN-γ signals are received coincident with infection. Under these conditions, the model suggests that negative feedback induces fast responses and an initial overshoot of nitric oxide production for given doses of TNF and IFN-γ, favoring killing of Mtb. Together, our results suggest that direct entry of macrophages into a granuloma site (and not distal to it) from lung vascular sources represents a preferred host strategy for mycobacterial control. We examine implications of these results in establishment of latent Mtb infection.
Keywords: mathematical model, cytokine, immune system, response time, feedback
Introduction
During most bacterial infections, the population of host immune cells known as macrophages (Mϕs) internalize and kill bacteria as an integral part of the innate immune response. However, during infection with Mycobacterium tuberculosis (Mtb), Mϕs are both the preferred environment for growth (Collins & Kaufmann, 2001) and the primary immune cell responsible for its control (reviewed in Chan & Flynn, 2004). Killing of Mtb by Mϕs is impaired except under conditions of appropriate activation that occurs during adaptive immunity. In previous work we predicted that the evolution of Mϕ activation has favored a robust quiescent state to prevent excessive activation in most situations (Ray & Kirschner, 2006); however, this design may benefit Mtb infections.
In mouse models of Mtb infection, Mϕs require at least two complementary activation signals (Cooper et al., 1993; Heldwein & Fenton, 2002) to become effective at killing Mtb. One of the signals, interferon (IFN)-γ, is secreted by activated T cells directly to the immunological synapse (Huse et al., 2006), which forms at the interface with antigen presenting cells such as Mϕs. In contrast, tumor necrosis factor-α (TNF), a complementary signal to IFN-γ for effective Mtb killing by Mϕs, was shown to be secreted multi-directionally from T cells (Huse et al., 2006), and is also produced by activated Mϕs (Decker et al., 1987). Concentrations and distributions of cytokines at the site of Mtb infection in the lungs are difficult or impossible to determine. Due to possible different spatial distributions of TNF and IFN-γ arising from their production pathways, timing of different activation signals received by the Mϕ may alter the kinetics of Mϕ activation and the success of responses to Mtb.
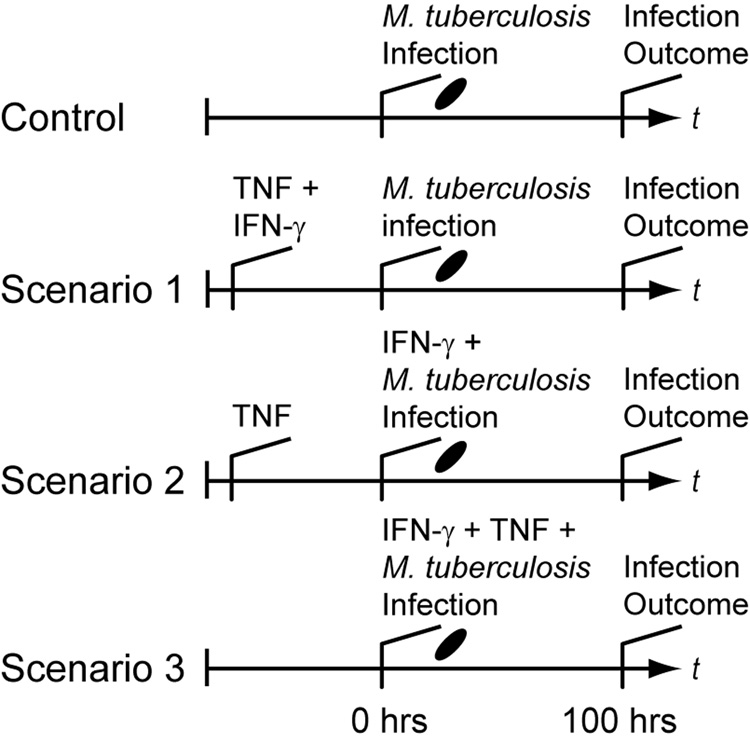
To test this hypothesis, we examined differences between three relevant Mϕ activation scenarios based on timing of receipt of the activating cytokine signals TNF and IFN-γ (Figure 1). The scenarios each posit a distinct possibility for when Mϕs encounter these two cytokine signals in the course of an ongoing infection with adaptive immunity relative to when infection occurs. In Scenario 1, IFN-γ and TNF signals both precede infection of Mϕs (i.e. when Mϕs internalize Mtb). This case may occur during very strong immune responses with high systemic cytokine levels. In Scenario 2, Mϕs receive a TNF signal before infection while targeted secretion of IFN-γ occurs concurrent with Mtb infection. This case represents activation from Mϕ-derived TNF flanking the infection site and/or targeted secretion preventing wide IFN-γ distribution. Mϕs may also receive both TNF and IFN-γ at the time of infection (i.e. at the time of Mtb uptake; Scenario 3). This represents recruitment of monocytes (which become Mϕs) directly to the site of infection without prior cytokine exposure. A fourth scenario, where IFN-γ is received before TNF, is omitted since targeted IFN-γ secretion combined with TNF derived from Mϕs make this scenario unlikely. These scenarios may occur simultaneously in the same infection, but preferentially allowing favorable scenarios may represent an activation strategy for the host. A scenario without TNF and IFN-γ serves as a negative control (labeled Control in Figure 1). We use a simple mathematical model describing Mϕ-Mtb interactions at the cellular level that is analogous to a Mϕ cell-culture system. Each scenario is determined by experimenter-controlled variables in the model. We measure the effectiveness of the scenarios by the number of Mtb within Mϕs 100 hours post-infection in the model.
Figure 1.
Simulated experimental scenarios for macrophage activation that depend on the timing of IFN-γ and TNF signaling relative to infection. “Infection Outcome” refers to the success or failure of macrophage responses, measured by the number of intracellular bacteria. In Scenario 1, TNF and IFN-γ signaling precedes infection. Scenario 2 represents targeted secretion of IFN-γ at the time of infection with TNF stimulation preceding. Scenario 3 represents TNF and IFN-γ signaling both concurrent with infection. The control scenario represents no cytokines present as is the case during an innate response. In this case the only activation signal is derived from mycobacteria during infection. After macrophages initially receive a given signal, we assume that signal is persistent.
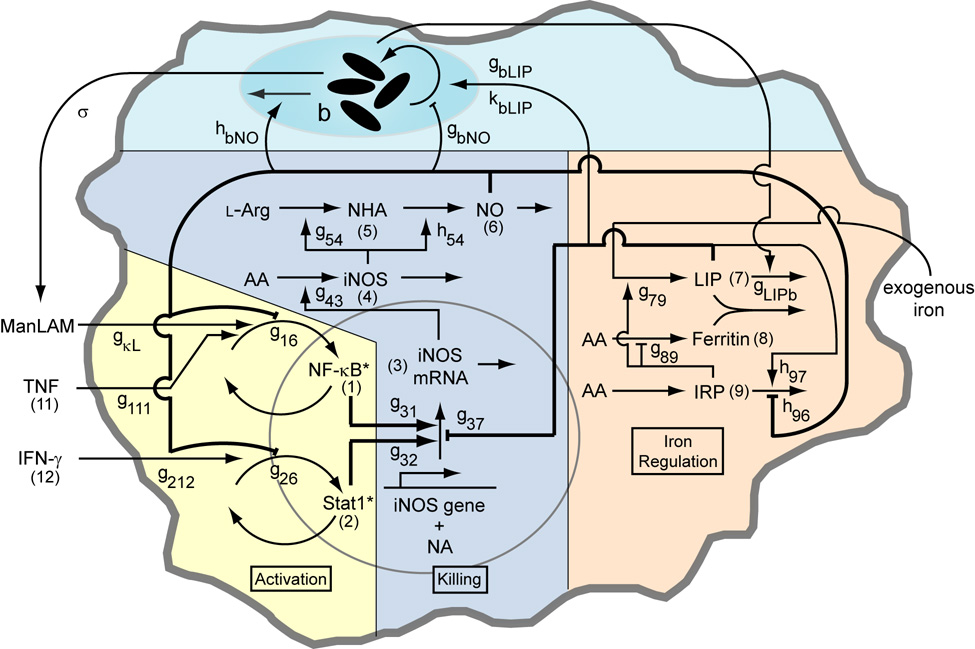
In mouse models, TNF and IFN-γ induce production of nitric oxide (NO), which is necessary for killing of Mtb (Nathan & Shiloh, 2000). NO and some reactive nitrogen intermediates (RNIs) derived from it are effective at killing Mtb in vitro (Yu et al., 1999), but other anti-microbial molecules are not (Bryk et al., 2000; Ehrt et al., 1997; Nathan & Shiloh, 2000; Ruan et al., 1999; Springer et al., 2001). NO or RNIs may also induce a latent phase of the Mtb growth cycle (Couture et al., 1999; Ohno et al., 2003). As previously described (Ray & Kirschner, 2006), nitric oxide production primarily involves three main functional activities in Mϕs: activation signaling, transcriptional regulation of killing, and intracellular iron regulation. These Mϕ activities are connected by regulatory interactions that result in feedback (Figure 2).
Figure 2.
Schematic of the macrophage network including interactions with an intracellular population of Mycobacterium tuberculosis with parameter names and variable numbers depicted. Numbers in parentheses refer to the variable number of the component (e.g. (1) refers to x1, (11) refers to x11, etc). Parameters gij and hij quantify network interaction types (stimulation or inhibition of a process by a cellular component) and interactions with the bacterial population. See Table A1 for parameter definitions and values. The model is analogous to a cell culture experiment, with these interactions averaged over a large population of macrophages. The biochemical model (Activation, Killing and Iron Regulation) was previously analyzed without a representation of bacteria in (Ray & Kirschner, 2006).
Two intracellular signaling mechanisms are primarily involved in activation of NO production in Mϕs: NF-κB and Stat1. The NF-κB pathway is induced by bacterial antigens (such as LPS or LAM; Fujihara et al., 2003; Heldwein & Fenton, 2002; Means et al., 1999) or TNF (Ding et al., 1988; Nathan et al., 1983; Sato et al., 1998) while Stat1 is activated by IFN-γ (Aaronson & Horvath, 2002; Cooper et al., 1993; Flesch & Kaufmann, 1987; Rook et al., 1986). These two signal pathways synergistically activate inducible nitric oxide synthase (iNOS) (Lorsbach et al., 1993), the enzymatic producer of NO.
Intracellular iron homeostasis is co-regulated with NO production (Kim & Ponka, 2003; Weiss et al., 1994). This allows internalization of extracellular (transferrin-bound) iron into the intracellular labile iron pool (LIP), where it ultimately becomes chelated into ferritin (Harrison & Arosio, 1996). The LIP regulates C/EBP-β (NF-IL6), which is necessary, but not sufficient, for iNOS transcription (Hentze & Kuhn, 1996). Iron is also a limiting nutrient for growth of Mtb and other intracellular pathogens (Schaible & Kaufmann, 2004) and intracellular mycobacteria remove iron from the LIP (Olakanmi et al., 2002).
Clearly, NO regulates many components of the Mϕ network. However, it is not clear from the literature whether regulation by NO and RNIs is inherently stimulatory or inhibitory (e.g. Hattori et al., 2004). Previous analysis by our group suggests that feedback regulation of iNOS transcription by NO is primarily negative, occurring via three pathways: NF-κB, Stat1, and iron regulation. One effect of the proposed negative feedback is optimization of several system properties when compared to positive feedback in the same pathway (Ray & Kirschner, 2006). Since the timing of Mϕ activation reflects possible host activation strategies, the kinetic effects of NO feedback may be important in Mtb infection.
The model we develop here expands our previous work (Ray & Kirschner, 2006). In that model we assumed general endotoxin (LPS) stimulation of the NF-κB pathway. Here, we focus on Mtb-specific factors to study the parameters that determine clearance versus persistence in the interaction between macrophages and Mtb. To this end, we introduce a dynamic intracellular population of Mtb into the existing model (Figure 2). The ability of Mϕs to kill Mtb via NO-mediated mechanisms may depend on timing of TNF and IFN-γ signaling. In addition to TNF and IFN-γ, Mtb-derived signals also contribute to Mϕ activation. We assume this to occur due to ManLAM, a complex glycolipid of Mtb, including the virulent H37Rv strain (Brown & Taffet, 1995; Chan et al., 2001). Lack of quantitative data for Mϕ responses to ManLAM prompted dose-response experiments performed herein for calibration of the model to Mϕ activation kinetics.
Materials and Methods
Dose-response experiments
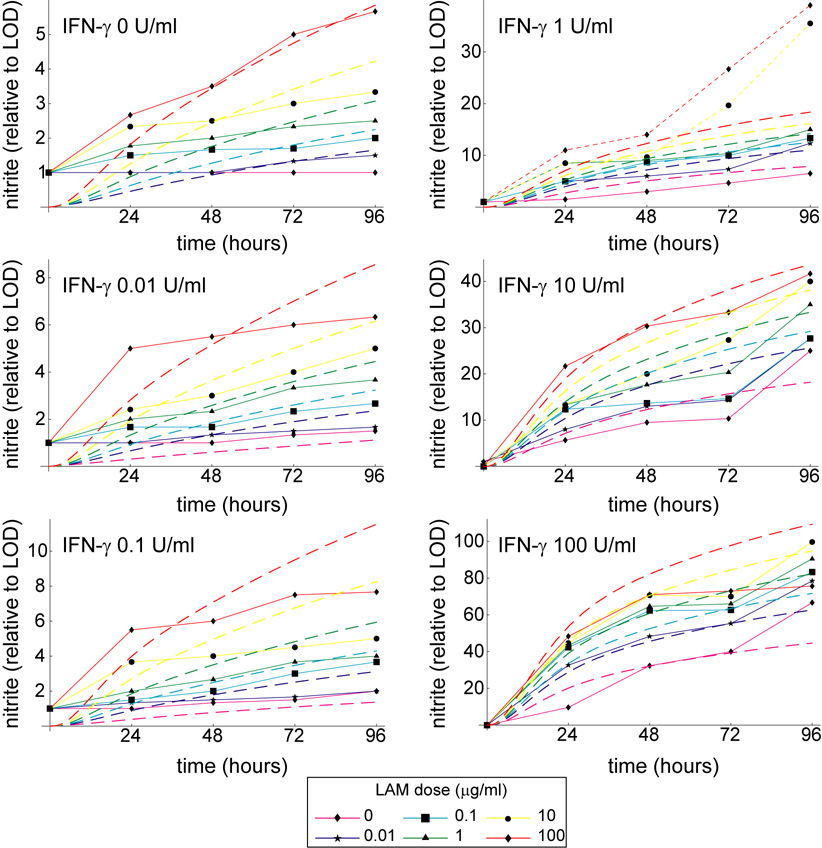
In the mathematical model we assume that Mtb-derived signals contribute to activation via ManLAM-mediated NF-κB induction (Brown & Taffet, 1995; Chan et al., 2001). In order to calibrate the Mϕ model response to ManLAM of virulent Mtb strains and to establish a cooperative NO response with IFN-γ, we performed dose-response experiments with the J774.16 Mϕ cell line (ATCC; Figure 2 and Figure A1). Doses of 0, 0.01, 0.1, 1, 10, and 100 µg/ml ManLAM (Colorado State University, Fort Collins, CO) were treated along with 0, 0.01, 0.1, 1, 10, and 100 U/ml IFN-γ (Sigma) in triplicate for 96 hours in 96-well plates (Becton Dickinson) seeded with 1.5 × 10⁵ Mϕs/well. At appropriate times we used the Griess reagent assay to measure nitrite output as a proxy for NO production (Chan et al., 1992).
Figure A1.
Simulations and experimental data shown as time series over 96 hours. The mathematical model reproduces experimental trends over the entire 96 hour time frame. Dashed lines represent simulated nitrite output for various LAM doses, while solid lines with data squares represent experimental data. The two dotted lines represent dose levels excluded from the fitting (see Footnote 1 in the main text).
A macrophage network model with mycobacterial infection
We previously developed a mathematical model of the Mϕ response to activation signals (IFN-γ and the general endotoxin LPS) inducing killing mechanisms (iNOS/NO in the model) coregulated with iron homeostasis apparatus (Ray & Kirschner, 2006). This model did not include a representation of infection. Here we introduce a population of Mtb that interacts with the existing Mϕ model framework to study how effectively this system kills Mtb under different signaling conditions, with ManLAM/TNF replacing LPS as the complementary signal to IFN-γ.
We represent each component of the model as a continuous entity in an ordinary differential equation. It is useful to think of this model as being analogous to a Mϕ cell culture system, with the results averaged over a large population of Mϕs. The model is built with a non-dimensionalized form of the local and piecewise S-system representations of the power law formalism (Savageau, 1996; Savageau, 2002). Each of n molecular components of the system is described by a differential equation
| (1) |
vi+ and vi− are aggregate power law fluxes describing the production and consumption of molecule xi that may be affected by any of m independent variables. Parameter ai is a turnover rate, always positive, that sets the speed of production and consumption. Parameters gij and hij are kinetic orders (regulatory parameters) quantifying the effect of the variable xj on the rate of xi production and consumption, respectively. How a model component (variable) regulates a given flux is determined by the kinetic order: if gij > 0, xj has a stimulatory effect on the flux vi+; if gij < 0 the effect is inhibitory; if gij = 0 then xj does not regulate vi+. Figure 2 illustrates the biochemical network with numerical indices for each variable and important parameters. We present the compete set of equations and parameter values in the Appendix. With the model in non-dimensional form, we report [NO], [LIP] and other molecular species as fold-induction above the basal steady state: xj = Xj/Xj,0 (where Xjis the absolute concentration and Xj,0 is the quiescent steady state level).
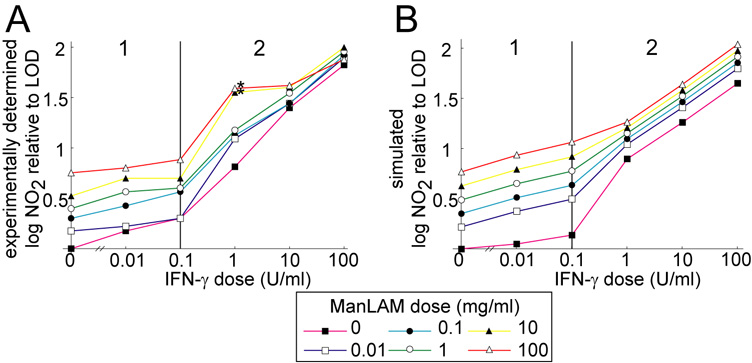
Some terms in the model (i.e. production rates of NF-κB, Stat 1 and iNOS mRNA) require a piecewise representation due to a biphasic response in the data (c.f. two response phases in Figure 3), where we quantify the effects of LAM and IFN-γ on activation signaling over the entire range of experimentally determined nitrite outputs. In this case the rate terms have the same mathematical form but the parameters depend on which IFN-γ dose range is used (Figure 3 shows the phases with model fit; Table A2 gives parameter estimates of the fit).
Figure 3.
A. Cumulative nitrite output of J774.16 macrophages at 96 h after treatment with a wide range of ManLAM and IFN-γ doses. Note two distinct response phases based on the dose of IFN-γ marked 1 and 2. B. Simulated cumulative nitrite production at 96 h after treatment reproduces experimental trends. A version of the mathematical model without M. tuberculosis infection simulated the cell culture experiment. LOD: limit of detection for nitrite. The two asterisks denote dose levels excluded from the fitting (see Footnote 1 in the text).
Simulated M. tuberculosis infection
We represent Mtb infection as a single variable: an intracellular population subject to the effects of NO and iron levels in the Mϕ network. The equation representing bacterial kinetics has growth and death rates parameterized as power laws:
| (2) |
This representation is mathematically equivalent to a piecewise Generalized Mass Action representation of the power law formalism (Savageau, 2001).The Mtb load is sensitive to NO levels due to growth rate inhibition (represented by the parameter gbNO) and enhancement of the rate of death (represented by hbNO; Figure 2). This model phenomenologically captures several effects of NO/RNIs; for example, gbNO captures a possible dormancy program in Mtb induced by NO (Ohno et al., 2003; Voskuil et al., 2004). The relative insensitivity of Mtb to superoxide and other non-RNI killing mechanisms (Bryk et al., 2000; Ehrt et al., 1997; Nathan & Shiloh, 2000; Ruan et al., 1999; Springer et al., 2001) allows us to omit these effectors, which are more important against other pathogens (Miller & Britigan, 1997). The effect of elevated intracellular iron (represented by gbLIP) is stimulatory, capturing the effects of iron-gathering siderophores produced by Mtb (DeVoss et al., 2000). This effect saturates when iron is no longer the rate-limiting nutrient (Raghu et al., 1993) at a level given by kbLIP.
The variables representing NO (x6) and the LIP (x7) are scaled to accurately represent how these quantities affect Mtb growth. For simplicity, mycobacteria are presumed to grow best in the absence of NO and to be sensitive to relatively small levels of it. Then x6= 1 (non-dimensional [NO] at the quiescent steady state) is the threshold for sensitivity of Mtb growth and death rates to NO. The LIP concentration giving the fastest growth defines the LIP saturation threshold, kbLIP. The parameter gbLIP scales the effect of the iron pool (in the sub-saturation range) on the rate of bacterial growth. The logistic term ensures that the population does not exceed a plausible MOI, above a maximal population we set at 50 bacteria per cell (Paul et al., 1996; Zhang et al., 1998).
Iron is removed from the cellular LIP at a rate proportional to the number of bacteria. When bacterial levels drop below detectable levels (set by kLIPb), this effect is absent. Sensitivity of iron pool levels to bacterial number is scaled by hLIPb. We expect this parameter to be small (estimated 10 at 0.05) to approximate the level of iron loss from Mϕs (approximately 30%; Olakanmi et al., 2002). The resulting iron loss rate in the Mϕ network is:
| (3) |
Activation Signals
We introduce exogenous concentrations of TNF and IFN-γ into the model as independent variables (x11 and x12, respectively). Each independent variable is scaled by a parameter d to interface with the non-dimensional network model. Intracellular Mtb also contributes to Mϕ activation, assumed to be from stimulation by sloughed ManLAM. Since it is derived from the intracellular Mtb population, it is a function of the number of bacteria present. σ scales the Mtb population to capture the effect of ManLAM for compatibility with the Mϕ model. The resulting terms for production of active NF-κB (vi+) and Stat1 (vi+), which go into equations for x1 and x2, are
| (4) |
Parameter estimation
Specific choices of parameter values give the system quantitative characteristics and are required to solve the system on a computer (Table A1). To calibrate the model and estimate unknown parameters, we modified the Mϕ network model (without Mtb) to include a variable representing nitrite accumulation from NO production, a modification to capture experiments performed herein. We also account for degradation of ManLAM and IFN-γ in cell culture. This allowed us to directly fit simulated nitrite dynamics to our dose-response experiments (Figure A1). We account for the biphasic response in the model using a piecewise function for Stat1 and NF-κB activation rate laws (described above). The fitted parameters (listed in Table A2) were assigned an initial value based on previous work (Ray & Kirschner, 2006) and systematically adjusted by hand to achieve the fit1 (Figure 3).
Simulated infection and treatment protocols
Simulations employed a protocol where Mϕs were treated with constant concentrations of TNF and/or IFN-γ as described in the 3 scenarios with infection of 1.5×10⁵ bacteria at t = 0 hrs, (i.e. MOI = 1, or one bacillus per Mϕ, in analogy to a cell culture system; Figure 1). As a reference threshold of activation, TNF concentrations of 22 ng/ml and IFN-γ concentrations of 1 U/ml were simulated. We increased IFN-γ to 100 U/ml and/or TNF to 220 ng/ml in some simulations to determine the effects of variable cytokine doses. The concentrations of IFN-γ were chosen to represent a range from phase 2 of the dose response studies (Figure 3), where activation levels are likely bactericidal. TNF concentrations are known to be in the ng/ml range in tuberculosis patients (Grebenchtchikov et al., 2005). We chose the reference TNF dose to represent a high level of activation without dominating the response to IFN-γ.
For scenarios with TNF and/or IFN-γ stimuli preceding infection (c.f. Figure 1), the Mϕ system was brought to steady state before infection. We use the intracellular population of Mtb at t = 100 hrs post-infection as a measure of the effectiveness of Mϕs at killing Mtb (i.e. the infection outcome). This time frame is similar to longer co-culture experiments here and elsewhere (Bonecini-Almeida et al., 1998; Sato et al., 1998).
Numerical simulations
After deriving the model, we solved the nonlinear ordinary differential equation S-system to obtain temporal dynamics for each element of the model. We used Mathematica (Wolfram Research) for most calculations, including an algorithm for uncertainty and sensitivity analysis and mathematically controlled comparisons (both described below). Results derived with these algorithms were confirmed with a second differential equation solver in C++ implementing Runga-Kutta adaptive step-size solvers and appropriate finite difference methods. A Systems Biology Markup Language file of the model is available on the authors’ website (http://malthus.micro.med.umich.edu/lab/sbml.html).
Uncertainty and sensitivity analysis
Parameters measured from experimental studies likely vary by experiment due to intrinsic errors of measurement and differences in experimental protocol. To explore the effects of uncertainty in the model, we evaluated it with a range of specific parameter values using Latin hypercube sampling (McKay et al., 1979). For this scheme, each parameter range was divided into 1000 equiprobable subintervals of a uniform distribution, randomly combined from each parameter to give 1000 parameter sets. Parameters g111, g212, bTNF and bIFN-γ were held constant during this analysis to preserve relative levels of activation of Stat1 and NF-κB pathways. Computing the numerical solution to these 1000 specific cases gives a statistical description of each model component at any time point, here using Mtb population at t = 100 hrs post-infection as the outcome measure. We determine statistical sensitivity by computing partial rank correlations (PRCs) between the outcome Mtb population and each varied parameter (Blower & Dowlatabadi, 1994). These correlations vary between -1 and 1, with a significance test approximating a Student’s T (Blower & Dowlatabadi, 1994) to determine if the PRC is significantly different from zero. Each sampled parameter has its own correlation that we interpret to represent the sensitivity of the Mtb population to that parameter. A separate Z test (Howell, 1987) compares the relative correlations between different parameters and between the same parameter examined under different experimental conditions. To account for the large number of varied parameters we corrected significance levels using the Bonferroni method (Shaffer, 1995).
Macrophage network characteristics and effective reduction of Mtb numbers
We previously used mathematically controlled comparisons (Irvine, 1991) to predict the type of regulation (i.e. positive or negative) between important Mϕ network interactions (represented by the boldfaced regulatory parameters in Table A1; see Figure 2). These are based on evolutionary pressures represented by criteria for functional effectiveness (described below). This approach has been applied before with statistical techniques to study S-system behavior (Alves & Savageau, 2000; Schwacke & Voit, 2004).
With this method we compare the effect of positive regulation (+) versus no regulation (0) versus negative regulation (−) for each interaction in the Mϕ model to meet criteria for how the system best operates. It also allows comparisons for quantitative changes in each interaction constrained to one type of regulation (i.e. +/0/−). We previously analyzed the model without Mtb (Ray & Kirschner, 2006) using three criteria established for other inducible genetic circuits (Hlavacek & Savageau, 1995): stability, robustness and responsiveness. Stability refers to the ability of a system to return to steady state after a small change in component levels. Robustness means a relative insensitivity of model variables and production/consumption rates to perturbations in parameters and other external components. Finally, responsiveness in this case represents a fast temporal change in NO levels after activation signals, reaching an activated steady state as quickly as possible after induction.
For this study we define response time as the time for NO concentrations to reach half way to the activated steady state level (approximated by the level of NO 100 hours post-infection). This definition captures the speed of response without penalizing for overshoot (of NO).
Mathematically controlled comparisons require internal and external equivalence of the system across changes in the parameter of interest (Schwacke & Voit, 2004 discuss these equivalence requirements in more detail). Internal equivalence is ensured by requiring that all terms in the mathematical model that are not involved in the interaction under study must have identical values. Meeting external equivalence requires correction of parameters in the rate term (V) containing the parameter of interest (p) as p is altered to ensure some equivalent external behavior of the system. To meet this requirement, the gain of iNOS from changes in TNF, IFN-γ and exogenous iron are held constant as the strength of the interaction changes. That is, the sum Ls = L(X4, X11) + L(X4, X12) + L(X4, X17) must be constant, where (the mathematical definition of gain in this type of system, which may be positive or negative; denotes a quiescent or activated steady state level of Xi). For each interaction, we deduce a constrained, two-dimensional parameter space (Ray & Kirschner, 2006) with the interaction parameter under study and one other parameter in the same rate term V corrected for external equivalence. There is a line of equivalent gain in this parameter space found from Ls along which the parameters are varied for the comparison.
We now extend the analysis described above to include one further functional criterion, bacterial control: optimizing the reduction or killing of Mtb. We calculated bacterial load in the system at t = 100 hrs after infection for two kinds of changes in the parameters of interest. In some cases, we changed the interaction type (−/0/+) while for others we changed the intensity of regulation for a specific interaction type. The type or level of regulation for each interaction that resulted in the lowest bacterial numbers represents the parameter value that optimally leads to a reduction in bacterial loads for that parameter.
Results
While macrophages are capable of effectively killing most pathogens, Mtb preferentially survives within them under certain conditions. Our goal is to determine why Mϕs are poor at killing Mtb, and to predict conditions that optimize killing/reducing Mtb levels. Here we use a mathematical model to determine the effects of timing of the activation signals TNF and IFN-γ in achieving this goal.
Macrophage network characteristics that prevent effective Mtb killing
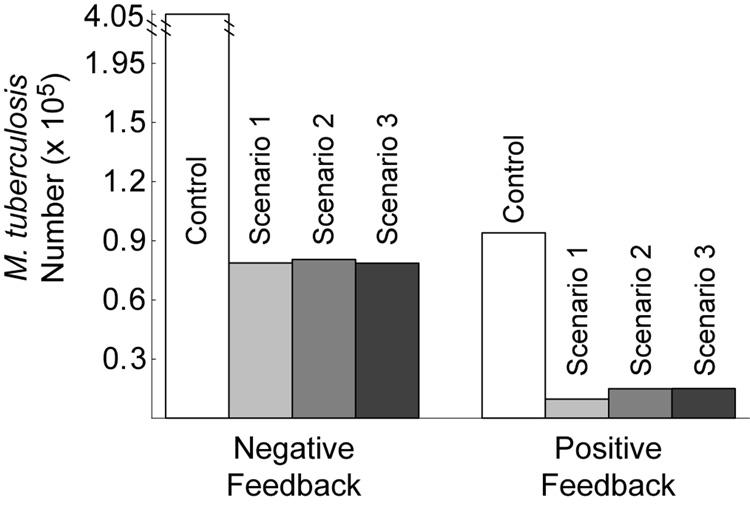
While negative regulation by NO optimizes stability, robustness and responsiveness of the Mϕ network, it does so by down-regulating iNOS transcription (Ray & Kirschner, 2006). To determine the effects of negative feedback on Mtb killing, we computed the predicted infection outcome (Mtb numbers 100 hours post-infection) under different feedback conditions. Parameters representing regulation of NF-κB, Stat1 and iron regulatory apparatus were varied between positive, negative and lack of feedback using mathematically controlled comparisons. We then simulated each scenario (Figure 1) at the reference cytokine dosage (22 ng/ml TNF and 1 U/ml IFN-γ) for each type of regulation. We also performed this analysis for transcriptional signals to confirm that this method gives results in agreement with known types of iNOS regulation. We present one interaction in detail (NO feedback to NF-κB: g16; Figure 4) to show our methodology and summarize the other results in Table 1.
Figure 4.
Greater survival of M. tuberculosis in macrophages with negative feedback to NF-κB by NO compared to positive feedback. The feedback parameter (g16) was changed between negative (− 0.75) and positive (0.75) using mathematically controlled comparisons. M. tuberculosis numbers represent the population of Mtb in 1.5×10⁵ Mϕs at 100 hours post-infection. Control: no cellmediated immunity. In Scenario 1, TNF and IFN-γ signaling precedes infection. Scenario 2 represents targeted secretion of IFN-γ at the time of infection with TNF stimulation preceding. Scenario 3 represents TNF and IFN-γ signaling both concurrent with infection. See Figure 1 for details of the scenarios.
Table 1.
Macrophage regulatory interactions optimizing killing of M. tuberculosis and temporal responsiveness
| Transcriptional regulation of iNOS by: | Nitric oxide feedback to: | |||||
|---|---|---|---|---|---|---|
| NF-κB (g31) | Stat1 (g32) | LIP1 (g37) | NF-κB (g16) | Stat1 (g26) | IRP2 (h96) | |
| Optimal Killing3 | + | + | − | + | ≈4 | + |
| Optimal Response Time5 | + | + | − | − | − | − |
Regulation occurs indirectly via C/EBP-β in vivo.
IRP: Iron response protein. See Figure 2.
In all scenarios with cell-mediated immunity.
All Mtb numbers within 5% for positive (+), null (0) and negative (−) feedback.
Other criteria for macrophage function also conform to this result (Ray & Kirschner, 2006).
Table 1 shows that the predicted type of regulation that minimizes Mtb numbers for NO feedback to NF-κB is positive, which suggests that positive feedback optimizes Mtb killing. This is also true for another case regarding NO regulation of iron regulatory apparatus (parameter h96), while NO feedback to Stat1 (g26) is neutral to infection outcome (Table 1). These results contradict our previous predictions that negative feedback is optimal in each case for the other criteria for Mϕ function in the uninfected form of the model (c.f. Table 1 and Ray & Kirschner (2006)). Therefore, the type of regulation by NO in the Mϕ network that optimizes other functional criteria does not improve bacterial control (Mtb killing) in comparison to other types of regulation, and in some cases is antagonistic toward killing. We now show how the timing of activation signals relative to when infection occurs can compensate for this effect.
Activation signals concurrent with infection counteract the antagonistic effects of negative feedback
While the previous results suggest that negative feedback regulation by NO in Mϕs reduces the effectiveness of killing, the sensitivity of Mtb to this effect may depend on the timing of activation signals. Since feedback likely affects kinetics of activation, we hypothesized that the timing of activation signals may benefit from the kinetic advantages of negative feedback. To test this, we performed sensitivity analysis that correlates the number of Mtb 100 hours post-infection (the infection outcome) with changes in the strength of each parameter in the model, preserving the qualitative type of regulation (+ or −) for all parameters. The resulting correlations indicate the sensitivity of Mtb to each varied interaction (see “Uncertainty and sensitivity analysis” in Methods for details). We calculated these correlations separately for each activation scenario (Figure 1).
The total number of parameters that significantly correlate with the infection outcome is reduced from 9 for Scenario 1 (i.e. TNF and IFN-γ introduction preceding infection; the significant parameters are βb, g16, g26, g31, g32, g37, h96, h97 and hbNO as defined in Table A1) to 6 of these 9 for Scenario 2 (i.e. TNF introduction preceding infection; the significant parameters are βb, g26, g31, g32, h96, and hbNO) and 4 of the 9 for Scenario 3 (i.e. TNF and IFN-γ introduction concurrent with infection; the significant parameters are βb, g31, g32, and hbNO). Since the only difference between these scenarios is the timing of TNF and IFN-γ, competing effects may ‘cancel out’ the sensitivity of some parameters in Scenario 2 and 3 due to activation kinetics. To test this, we examined the effect of each scenario on sensitivities to NO feedback parameters.
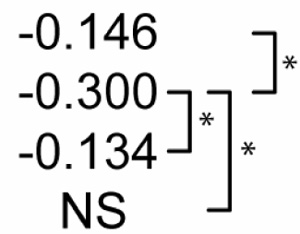
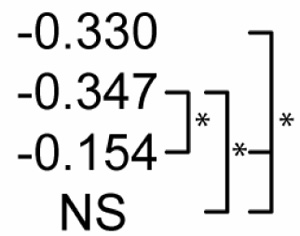
Table 2 shows statistical sensitivities of Mtb infection outcome to each NO feedback parameter. Each non-zero sensitivity is negative. Since the parameters are negative (representing negative feedback), a negative sensitivity here represents an effect that reduces the effectiveness of Mtb killing. Each of the sensitivities is significantly smaller than zero in Scenario 1. Scenario 2 shows a reduced effect for two of the parameters (feedback to Stat1 and IRP; p < 0.01 in a Z test versus Scenario 1 sensitivities) and no sensitivity to feedback to NF-κB. In Scenario 3, none of the three sensitivities is significantly different from zero. These changes in sensitivity between the three scenarios suggest that the timing of activation signals has an effect on the role of NO regulatory effects in Mtb killing, where activation concurrent with infection relaxes the undermining effects of these signals.
Table 2.
Sensitivity of M. tuberculosis numbers (100 hours post-infection) to quantitative variations in regulatory interactions
| Partial Rank Correlations with Mtb # | NO regulation of:1 |
||
|---|---|---|---|
| NF-κB | Stat1 | IRP2 | |
| Control | 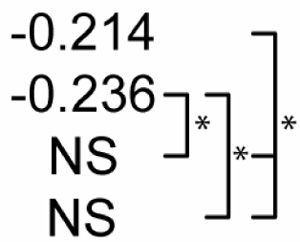 |
 |
 |
| Scenario 1 | |||
| Scenario 2 | |||
| Scenario 3 | |||
p<0.01. The far right bracket for each parameter denotes significant differences between Control and each numbered scenario. The remaining two brackets denote significant changes between the three numbered scenarios. NS: not significantly different from zero (p > 0.01).
Due to negative regulation by these interactions, correlations with negative signs are interpreted to mean that stronger negative regulation reduces the effectiveness of M. tuberculosis killing.
IRP: Iron response protein. See Figure 2.
Dynamics that benefit cytokine signals concurrent with infection
While negative feedback speeds response times in all the tested scenarios, NO production by Mϕs is initially lower in Scenarios 2 and 3 as compared to Scenario 1. Therefore the effects of NO in the Mϕ system do not consistently favor Mtb killing. This may create a dependency on fast response times that favors strong negative feedback. We hypothesized that the dynamics of Mϕ activation in the initial hours post-infection may neutralize the effects of negative feedback that reduces the effectiveness of Mtb killing.
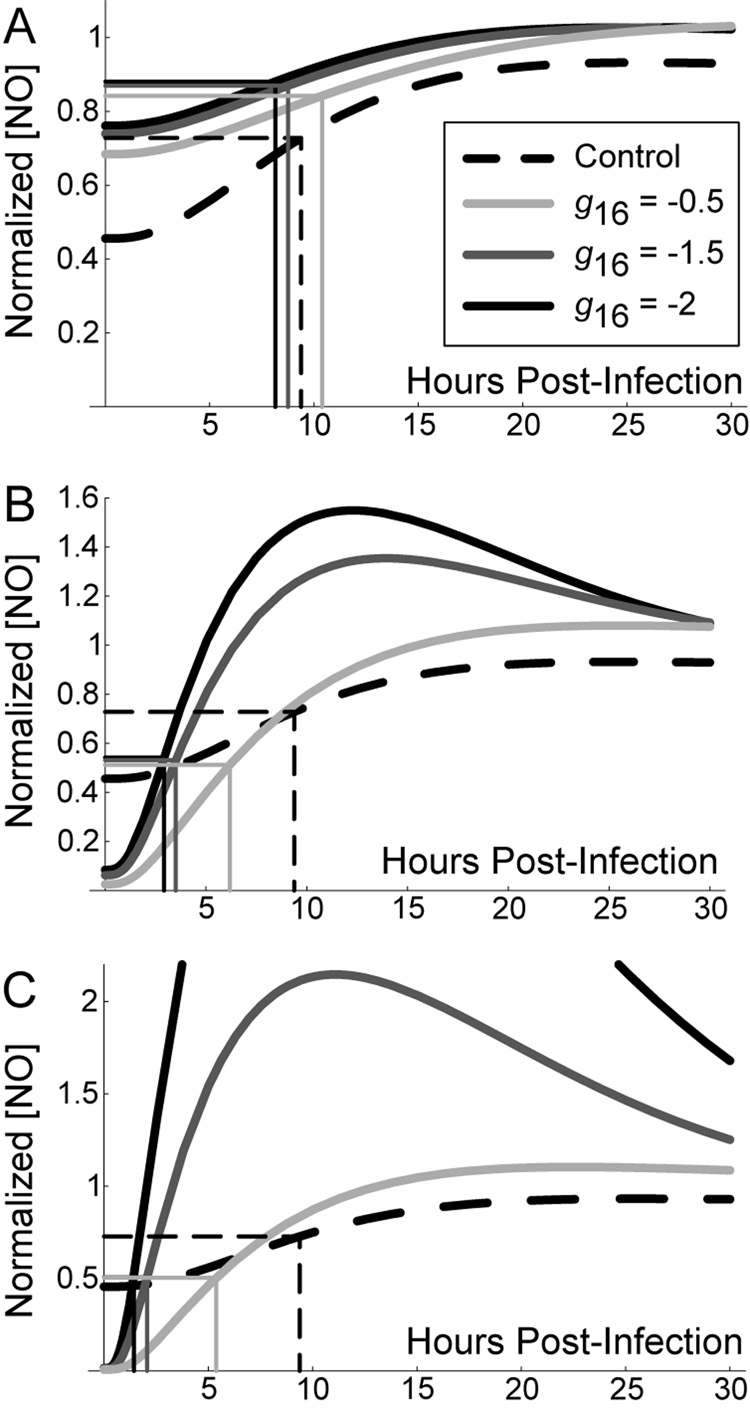
To test this hypothesis, we investigate the effects of the parameter representing NO feedback to NF-κB (g16) using mathematically controlled comparisons. For brevity we explore only this parameter, but the effects hold qualitatively for NO feedback to Stat1 (g26) and iron regulation (h96) as well. To determine the specific effect of feedback to NF-κB in each scenario, we varied g16 using mathematically controlled comparisons as described in Methods (Figure 5). As the feedback becomes more strongly negative (i.e. g16 from −0.5 to −2.0), the response time of NO levels (measured here as the time, in hours, required to reach half [NO] at t = 100) is unchanged for the scenario with no exogenous cytokine signals (Control). Scenario 1 improves on this response time only for very strong negative feedback (Figure 5A), while response times readily improve for Scenarios 2 and 3 (Figures 5B and 5C, respectively)2. This result suggests that strong negative feedback preferentially benefits Mϕ activation in scenarios with delayed activation signals (Scenario 3).
Figure 5.
Stronger negative feedback improves macrophage activation time during infection with M. tuberculosis. Graphs depict the first 30 hours post-infection to show initial kinetics. The level of negative feedback to NF-κB by nitric oxide (represented in the model by parameter g16) was varied using mathematically controlled comparisons. A. TNF and IFN-γ signals preceding infection (Scenario 1). B. Targeted secretion of IFN-γ restricting it to the site of infection (Scenario 2). C. Initial cytokine stimulus concurrent with infection time (Scenario 3). We found the control scenario (without cell-mediated immunity; dashed line in A, B and C) to be constant over variations in the level of feedback; we therefore use it as a reference point between scenarios. Rectangles depict the response time (number of hours for nitric oxide concentration to reach half the level at 100 hours post-infection) for each case. Nitric oxide levels are normalized in each scenario by the level at 100 hours post-infection.
Strongly negative feedback improves relative bacterial killing with activation concurrent with Mtb infection compared to other scenarios
Due to the combination of costs and benefits of negative feedback, we hypothesized that higher cytokine concentrations received concurrent with infection can compensate for antagonistic effects of feedback on Mtb killing by Mϕs.
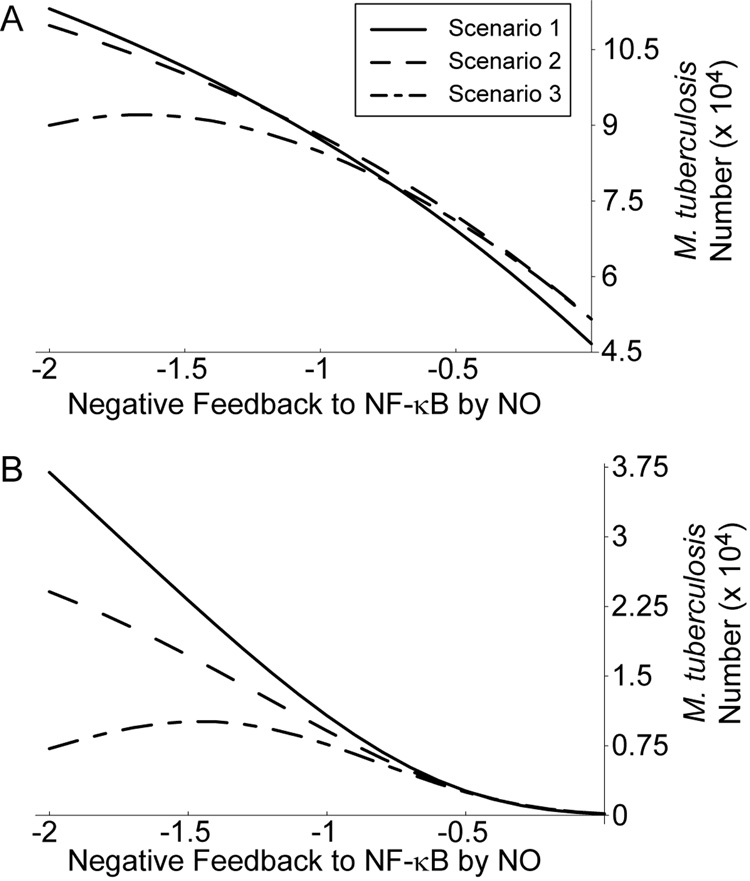
To test this hypothesis, we examined Mtb numbers at 100 hours post-infection for each activation scenario as we varied levels of feedback to NF-κB using mathematically controlled comparisons (Figure 6). This was done at two simulated cytokine concentrations, representative of the reference dose used throughout (1 U/ml IFN-γ and 22 ng/ml TNF; Figure 6A) and a case with IFN-γ concentration elevated to 100 U/ml (Figure 6B). We repeated this analysis for elevated TNF concentrations with each IFN-γ concentration with similar results (not shown).
Figure 6.
High cytokine concentrations that do not precede infection enhance killing under strong negative feedback. A. Level of Mtb killing for three macrophage activation scenarios with cytokine concentrations of 22 ng/ml TNF and 1 U/ml IFN-γ. B. Mtb killing for three activation scenarios with 22 ng/ml TNF and 100 U/ml IFN-γ. Scenario 1: TNF and IFN-γ signaling precedes infection. Scenario 2: targeted secretion of IFN-γ at the time of infection with TNF stimulation preceding. Scenario 3: TNF and IFN-γ signaling both concurrent with infection. See Figure 1 for details of the scenarios.
For a given level of feedback, Mtb killing is nearly identical between all three activation scenarios at the lower cytokine dose (Figure 6A). For elevated IFN-γ dosing and strongly negative feedback (Figure 6B), IFN-γ concurrent with infection (Scenario 2) shows somewhat enhanced killing over IFN-γ preceding infection (Scenario 1). Scenario 3 shows a much larger improvement in killing, with higher levels of negative feedback becoming beneficial to killing beyond a certain level (Figure 6B). This coincides with high levels of NO overshoot beyond the activated steady state level for this activation scenario (e.g. Figure 5C), suggesting a mechanism for this effect.
Therefore, in scenarios with cytokine signaling that is timed to coincide with infection, Mϕs perform at least as well at Mtb killing as scenarios with signaling preceding infection at equal concentrations. High cytokine doses can improve killing in Scenarios 2 and 3 under strong negative feedback, with sufficient overshoot of NO reversing the antagonistic effects of NO on Mtb killing.
Discussion
Mϕs require complementary activation signals (TNF or bacterial antigens and IFN-γ) to achieve a bactericidal state during infection with Mtb. Different sources for TNF (produced by Mϕs and T cells) and IFN-γ (which undergoes targeted secretion by T cells) may reflect a host strategy to prevent superfluous perturbation of surrounding tissues. However, the timing of these activation signals may affect the outcome of Mtb infection.
We simplified a range of possible activation kinetics into three scenarios based on timing of TNF and IFN-γ signals that Mϕs receive relative to when they become infected (i.e. take up Mtb; Figure 1). The effects of these scenarios were tested with a mathematical model representing important Mϕ activities known to interact with intracellular Mtb in mouse models (Figure 2). This model was calibrated to extensive dose-response experiments (Figure 3 and Figure A1) to establish a reasonable kinetic response for production of NO, a major anti-mycobacterial effector molecule.
To prevent excessive activation while still allowing high NO levels when necessary, the Mϕ network must balance a quiescent state with the rare need to reach high levels of activation. To this end a series of negative feedback loops modulate NO production (Figure 2). However, one possible effect of negative feedback is that effective Mtb killing by Mϕs is reduced when compared to positive feedback (Table 1 and Figure 4).
The mathematical model predicts a reduced effect of negative feedback by NO in scenarios where TNF and/or IFN-γ signals are introduced concurrent with Mtb infection (Table 2). Strengthening the feedback (i.e. making NO regulation of NF-κB more negative by making the parameter g16 more negative) also speeds Mϕ responses after infection in scenarios where receipt of TNF and/or IFN-γ signals coincides with infection (Figure 5). This suggests the importance of improved response times allowed by negative feedback in Scenarios 2 and 3.
This result depends on the interpretation of response times as rise times of NO, which permits the system to be capable of high overshoots that may be detrimental to overall system function. Our previous results suggest that this system allows high NO production if the appropriate signals are present (Ray & Kirschner, 2006). Based on this activation model, we suggest that overproduction of NO is acceptable in circumstances with multiple activation signals.
We also find a possible advantage of this overshoot. Under conditions of strengthened feedback to NF-κB (i.e. parameter g16 < −1.25), the model predicts enhanced killing of Mtb by Mϕs at high cytokine concentrations for Scenarios 2 and 3 compared to Scenario 1. This effect is particularly apparent for Scenario 3, where TNF and IFN-γ signals occur concurrent with infection of Mϕs (Figure 6), and coincides with the predicted overshoot of NO production. This indicates an advantage of the initial burst of NO levels permitted by negative feedback after infection.
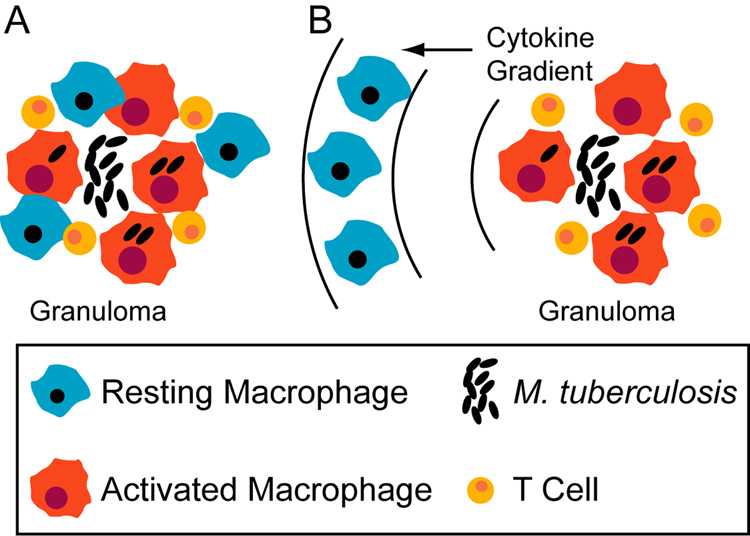
During the course of pulmonary infection with Mtb, multiple signals from cell-mediated adaptive immunity induce migration of Mϕs along with T cells to the lung leading to the formation of immune structures called granulomas (e.g. Algood et al., 2003). Mϕs that have ingested Mtb at the site of infection can present antigen to T cells,which, upon activation constitute a rich source of TNF and IFN-γ (reviewed in Flynn & Chan, 2001). The most frequent clinical outcome of pulmonary Mtb infection is a latent infection that represents a stable co-existence of host and pathogen. We have emphasized the functional consequences of host Mϕ activation strategies from the perspective of optimizing Mtb killing, but our results also suggest a mechanism for establishing latent infections. The most effective host activation strategy may be recruitment of Mϕs directly into the granuloma (with cytokine signaling as in Scenario 3 in Figure 1), and prevention of this strategy may favor Mtb growth (for instance, via loss of vascular points of Mϕ entry in regions of Mtb-induced necrosis). An ongoing immune response at the periphery of a granuloma prevents bacterial dissemination in most cases. However, Mϕs migrating to the site of infection from flanking lung tissues (possibly encountering cytokines as in Scenarios 1 and 2 in Figure 1) are more likely to permit some Mtb growth, thus striking a balance favorable to a latent infection state (Figure 7).
Figure 7.
Recruitment scenarios that tip the balance between bacterial killing and persistence based on timing of activation signals. A. Recruitment of blood monocytes (that become macrophages) directly to a granuloma from localized vascular sources may favor effective bacterial killing. B. Recruitment of macrophages from surrounding lung tissue may result in some level of activation preceding infection, favoring latent infection.
A role for the timing of events from Mϕ activation has been proposed to tip the balance between host-pathogen interactions in different contexts (e.g. Shaughnessy & Swanson, 2007). In the case of Mtb infection, our model suggests that late activation is an optimal pathogen killing strategy. Experimental Mtb infection of Mϕs with cytokine signals timed as in each of the scenarios here can test our predictions. These results also call for the integration of theoretical and experimental approaches to understand the temporal and spatial roles of signaling and macrophage migration in Mtb granuloma formation.
Acknowledgments
This work was supported by NIH grants 07544-26 (JCJR), HL 71241 and N01-AI-40091 (JC), and LM 009027, HL 072682 and HL 68526 (DEK). We thank V.J. DiRita for critique of the manuscript and members of the Kirschner lab for helpful discussions. We are also greatly appreciative of the feedback from the members of JCJR’s thesis committee and anonymous reviewers.
Appendix
Complete specification of the mathematical model. The definition of each variable and parameter can be found in Methods and Figure 2. The effects of some precursors (e.g. amino acids) are omitted for clarity.
Table A1.
Definitions and estimates of model parameters
| Effect | Parameter | Est’d Value | LHS Rangea | References |
|---|---|---|---|---|
| NF-κB turnover | a1 | 2.4 h−1 | [0.01, 50] | (Hoffmann et al., 2002) |
| Stat1 turnover | a2 | 2.77 h−1 | [0.01, 50] | (Haspel et al., 1996) |
| iNOS mRNA turnover | a3 | 0.173 h−1 | [0.116, 0.347] | (Ray & Kirschner, 2006) |
| INOS turnover | a4 | 0.0693 h−1 | [0.0365, 0.693] | (Ray & Kirschner, 2006) |
| NHA turnover | a5 | 5.545 µmol/h | [5.454, 332.711] | (Ray & Kirschner, 2006) |
| NO turnover | a6 | 2.773 h−1 | [2.727, 166.355] | (Ray & Kirschner, 2006) |
| LIP turnover | a7 | 32.201 µmol/h | [2.565, 61.820] | (Ray & Kirschner, 2006) |
| Ferritin turnover | a8 | 40.0 µmol/h | [4, 89] | (Ray & Kirschner, 2006) |
| IRP turnover | a9 | 35.0 µmol−1 h−1 | [29.17, 44.06] | (Ray & Kirschner, 2006) |
| NF-κB reg. by TNF | g111 | 1.18 | Not Varied | (Harant et al., 1996) |
| TNF conc. scaling | dTNF | 117.4 | Not Varied | (Harant et al., 1996) |
| Stat1 reg. by IFN-γ | g212 | cf. Table A2 | Not Varied | cf. Table A2 |
| IFN-γ conc. scaling | dIFN-γ | 20 | Not Varied | cf. Table A2 |
| NF-κB txn reg. | g31 | cf. Table A2 | [0.1, 1.5] | cf. Table A2 |
| Stat1 txn reg. | g32 | 0.26 | [0.1, 1] | cf. Table A2 |
| LIP txn reg. | g37 | −0.177 | [−0.1, −2] | (Ray & Kirschner, 2006) |
| NO feedback to NF-κB | g16 | cf. Table A2 | [−0.3, −1.5] | (Hattori et al., 2004); cf. Table A2 |
| NO feedback to Stat1 | g26 | −0.5 | [−0.3, −1.5] | (Ray & Kirschner, 2006) |
| Translation | g43 | 1 | Not Varied | (Ray & Kirschner, 2006) |
| Arg NHA reg. | g54 | 1 | Not Varied | (Ray & Kirschner, 2006) |
| NHA NO reg. | h54 | 1 | Not Varied | (Ray & Kirschner, 2006) |
| reg. Of iron influx | g79 | 0.5 | [0.1, 1.5] | (Ray & Kirschner, 2006) |
| LIP sequestration | h78 | 0.74 | Not Varied | (Kakhlon et al., 2001) |
| IRP reg. of ferritin | g89 | −0.645 | [−0.1, −2] | (Ray & Kirschner, 2006) |
| LIP Ferritin | h87 | 1 | Not Varied | (Ray & Kirschner, 2006) |
| NO reg. of IRP | h96 | −0.5 | [−0.1, −1] | (Ray & Kirschner, 2006) |
| LIP reg. of IRP | h97 | 0.5 | [0.4, 2] | (Ray & Kirschner, 2006) |
| Mtb growth rate | αb | 0.0250 Mtb/h | [0.0191, 0.0385] | Avg. of (Graham & Clark-Curtiss, 1999; Manca et al., 1999; Silver et al., 1998; Zhang et al., 1998) |
| NO reg. of Mtb growth | gbNO | −0.5 | [−0.3, −1.5] | Initial guess |
| Iron enhancement of Mtb growth | gbLIP | 1 | [0.3, 1.0] | Initial guess |
| Iron effect saturation | kbLIP | 1 | [0.1, 2] | Initial guess |
| Intrinsic Mtb death rate | βb | 2.5×10⁻⁴ Mtb/h | [2.5 × 10⁻⁵, 2.5 × 10⁻⁴] | 1 % of αb |
| Killing by NO | hbNO | 0.75 | [0.1, 2] | Initial guessb |
| NF-κB reg. by LAM | gκB | 0.2 | Not Varied | cf. Table A2 |
| Sloughed LAM | σ | 120 Mtb−1 | [10, 10000] | (Nigou et al., 2000) |
| Scaling of Mtb on LIP | kLIPb | 106 Mtb−1 | Not Varied | Initial guess |
| Effect of Mtb on LIP | hLIPb | 0.05 | [0.1, 0.001] | Initial guess |
| Maximum Mtb per Mϕ | bmax | 50 Mtb/Mϕ | Not Varied | Guess from (Paul et al., 1996; Zhang et al., 1998) |
LHS: Latin hypercube sampling.
Calibrated to achieve approximately 50% killing at the default cytokine dose for default parameter values.
Table A2.
Parameter estimates from dose response experiments
| Phase | IFN-γ dose | NF-κB activation by LAM (gκB) | Stat1 activation by IFN-γ (g212) | iNOS activation by NF-κB (g31) | iNOS activation by Stat1 (g32) | NO feedback to NF-κB (g16) |
|---|---|---|---|---|---|---|
| A | ≤ 0.1 U/ml | 0.2 | 1.0 | 1.46 | 0.26 | −0.672 |
| B | > 0.1 U/ml | 0.2 | 2.5 | 0.5 | 0.26 | −1.5 |
| Phase | IFN-γ dose | LAM half-life in culture (kLAM)1 | IFN-γ half-life in culture (kIFN-γ)1 | Scaling constant for LAM (dLAM) 1 | Scaling constant for IFN-γ (dIFN-γ) |
|---|---|---|---|---|---|
| A | ≤ 0.1 U/ml | 0.025 | 0.035 | 500 | 20 |
| B | > 1 U/ml | 0.025 | 0.035 | 500 | 20 |
Parameter required to accurately fit the model to the data, but not needed for simulations in the main text.
Footnotes
Two of the dose combinations (1 U/ml IFN-γ with 10 or 100 µg/ml ManLAM) give model predictions lower than the experimental data. These data appear to be anomalously high in comparison to nitrite output at other doses (Figure 2 and Figure A1 starred), and we attribute the discrepancy to experimental error.
We also found response times to be improved for stronger negative feedback in parameter sets not exhibiting the overshoot effect seen in Figure 4 (not shown).
Publisher's Disclaimer: This is a PDF file of an unedited manuscript that has been accepted for publication. As a service to our customers we are providing this early version of the manuscript. The manuscript will undergo copyediting, typesetting, and review of the resulting proof before it is published in its final citable form. Please note that during the production process errors may be discovered which could affect the content, and all legal disclaimers that apply to the journal pertain.
References
- Aaronson DS, Horvath CM. A road map for those who know JAK-STAT. Science. 2002;296(5573):1653–1655. doi: 10.1126/science.1071545. [DOI] [PubMed] [Google Scholar]
- Algood H, Chan J, Flynn J. Chemokines and tuberculosis. Cytokine & Growth Factor Reviews. 2003;14(6):467–477. doi: 10.1016/s1359-6101(03)00054-6. [DOI] [PubMed] [Google Scholar]
- Alves R, Savageau MA. Extending the method of mathematically controlled comparison to include numerical comparisons. Bioinformatics. 2000;16(9):786–798. doi: 10.1093/bioinformatics/16.9.786. [DOI] [PubMed] [Google Scholar]
- Blower SM, Dowlatabadi H. Sensitivity and Uncertainty Analysis of Complex Models of Disease Transmission: an HIV Model, as an Example. Int Stat Rev. 1994;62:229–243. [Google Scholar]
- Bonecini-Almeida MG, Chitale S, Boutsikakis I, Geng J, Doo H, He S, Ho JL. Induction of in vitro human macrophage anti-Mycobacterium tuberculosis activity: requirement for IFN-gamma and primed lymphocytes. J Immunol. 1998;160:4490–4499. [PubMed] [Google Scholar]
- Brown MC, Taffet SM. Lipoarabinomannans derived from different strains of Mycobacterium tuberculosis differentially stimulate the activation of NF-κB and KBF1 in murine macrophages. Infect Immun. 1995;63(5):1960–1968. doi: 10.1128/iai.63.5.1960-1968.1995. [DOI] [PMC free article] [PubMed] [Google Scholar]
- Bryk R, Griffin P, Nathan C. Peroxynitrite reductase activity of bacterial peroxiredoxins. Nature. 2000;407:211–215. doi: 10.1038/35025109. [DOI] [PubMed] [Google Scholar]
- Chan ED, Morris KR, Belisle JT, Hill P, Remigio LK, Brennan PJ, Riches DW. Induction of Inducible Nitric Oxide Synthase-NO. by Lipoarabinomannan of Mycobacterium tuberculosis Is Mediated by MEK1-ERK, MKK7-JNK, and NF-κB Signaling Pathways. Infect Immun. 2001;69(4):2001–2010. doi: 10.1128/IAI.69.4.2001-2010.2001. [DOI] [PMC free article] [PubMed] [Google Scholar]
- Chan J, Flynn J. The immunological aspects of latency in tuberculosis. Clin Immunol. 2004;110(1):2–12. doi: 10.1016/s1521-6616(03)00210-9. [DOI] [PubMed] [Google Scholar]
- Chan J, Xing Y, Magliozzo RS, Bloom BR. Killing of virulent Mycobacterium tuberculosis by reactive nitrogen intermediates produced by activated murine macrophages. J Exp Med. 1992;175:1111–1122. doi: 10.1084/jem.175.4.1111. [DOI] [PMC free article] [PubMed] [Google Scholar]
- Collins HL, Kaufmann SH. The many faces of host responses to tuberculosis. Immunology. 2001;103(1):1–9. doi: 10.1046/j.1365-2567.2001.01236.x. [DOI] [PMC free article] [PubMed] [Google Scholar]
- Cooper A, Dalton D, Stewart T, Griffin J, Russell D, Orme I. Disseminated tuberculosis in interferon gamma gene-disrupted mice. J Exp Med. 1993;178(6):2243–2247. doi: 10.1084/jem.178.6.2243. [DOI] [PMC free article] [PubMed] [Google Scholar]
- Couture M, Yeh S, Wittenberg B, Wittenberg J, Ouellet Y, Rousseau D, Guertin M. A cooperative oxygen-binding hemoglobin from Mycobacterium tuberculosis. Proc Natl Acad Sci U S A. 1999;96(20):11223–11228. doi: 10.1073/pnas.96.20.11223. [DOI] [PMC free article] [PubMed] [Google Scholar]
- Decker T, Lohmann-Matthes ML, Gifford GE. Cell-associated tumor necrosis factor (TNF) as a killing mechanism of activated cytotoxic macrophages. J Immunol. 1987;138(3):957–962. [PubMed] [Google Scholar]
- DeVoss JJ, Rutter K, Schroeder BG, Su H, Zhu Y, Barry CE., III The salicylate-derived mycobactin siderophores of Mycobacterium tuberculosis are essential for growth in macrophages. Proc Natl Acad Sci U S A. 2000;97:1252–1257. doi: 10.1073/pnas.97.3.1252. [DOI] [PMC free article] [PubMed] [Google Scholar]
- Ding A, Nathan C, Stuehr D. Release of reactive nitrogen intermediates and reactive oxygen intermediates from mouse peritoneal macrophages. Comparison of activating cytokines and evidence for independent production. J Immunol. 1988;141(7):2407–2412. [PubMed] [Google Scholar]
- Ehrt S, Shiloh MU, Ruan J, Choi M, Gunzburg S, Nathan C, Xie Q, Riley LW. A novel antioxidant gene from Mycobacterium tuberculosis. J Exp Med. 1997;186:1885–1896. doi: 10.1084/jem.186.11.1885. [DOI] [PMC free article] [PubMed] [Google Scholar]
- Flesch I, Kaufmann S. Mycobacterial growth inhibition by interferon-gamma-activated bone marrow macrophages and differential susceptibility among strains of Mycobacterium tuberculosis. J Immunol. 1987;138(12):4408–4413. [PubMed] [Google Scholar]
- Flynn JL, Chan J. Immunology of tuberculosis. Annu Rev Immunol. 2001;19:93–129. doi: 10.1146/annurev.immunol.19.1.93. [DOI] [PubMed] [Google Scholar]
- Fujihara M, Muroi M, Tanamoto K, Suzuki T, Azuma H, Ikeda H. Molecular mechanisms of macrophage activation and deactivation by lipopolysaccharide: roles of the receptor complex. Pharmacol Ther. 2003;100(2):171–194. doi: 10.1016/j.pharmthera.2003.08.003. [DOI] [PubMed] [Google Scholar]
- Graham J, Clark-Curtiss J. Identification of Mycobacterium tuberculosis RNAs synthesized in response to phagocytosis by human macrophages by selective capture of transcribed sequences (SCOTS) Proc Natl Acad Sci U S A. 1999;96(20):11554–11559. doi: 10.1073/pnas.96.20.11554. [DOI] [PMC free article] [PubMed] [Google Scholar]
- Grebenchtchikov N, van der Ven-Jongekrijg J, Pesman GJ, Geurts-Moespot A, van der Meer JW, Sweep FC. Development of a sensitive ELISA for the quantification of human tumour necrosis factor-alpha using 4 polyclonal antibodies. Eur Cytokine Netw. 2005;16(3):215–222. [PubMed] [Google Scholar]
- Harant H, de Martin R, Andrew P, Foglar E, Dittrich C, Lindley I. Synergistic Activation of Interleukin-8 Gene Transcription by All-trans-retinoic Acid and Tumor Necrosis Factor-alpha Involves the Transcription Factor NF-kappa B. J. Biol. Chem. 1996;271(43):26954–26961. doi: 10.1074/jbc.271.43.26954. [DOI] [PubMed] [Google Scholar]
- Harrison PM, Arosio P. The ferritins: molecular properties, iron storage function and cellular regulation. Biochim Biophys Acta. 1996;1275:161–203. doi: 10.1016/0005-2728(96)00022-9. [DOI] [PubMed] [Google Scholar]
- Haspel RL, Salditt-Georgieff M, Darnell JE., Jr The rapid inactivation of nuclear tyrosine phosphorylated Stat1 depends upon a protein tyrosine phosphatase. EMBO J. 1996;15:6262–6268. [PMC free article] [PubMed] [Google Scholar]
- Hattori Y, Kasai K, Gross S. NO suppresses while peroxynitrite sustains NF-κB: a paradigm to rationalize cytoprotective and cytotoxic actions attributed to NO. Cardiovascular Research. 2004;63(1):31–40. doi: 10.1016/j.cardiores.2004.03.014. [DOI] [PubMed] [Google Scholar]
- Heldwein KA, Fenton MJ. The role of Toll-like receptors in immunity against mycobacterial infection. Microbes Infect. 2002;4:937–944. doi: 10.1016/s1286-4579(02)01611-8. [DOI] [PubMed] [Google Scholar]
- Hentze MW, Kuhn LC. Molecular control of vertebrate iron metabolism: mRNA-based regulatory circuits operated by iron, nitric oxide, and oxidative stress. Proc Natl Acad Sci U S A. 1996;93:8175–8182. doi: 10.1073/pnas.93.16.8175. [DOI] [PMC free article] [PubMed] [Google Scholar]
- Hlavacek WS, Savageau MA. Subunit structure of regulator proteins influences the design of gene circuitry: analysis of perfectly coupled and completely uncoupled circuits. J Mol Biol. 1995;248:739–755. doi: 10.1006/jmbi.1995.0257. [DOI] [PubMed] [Google Scholar]
- Hoffmann A, Levchenko A, Scott M, Baltimore D. The Ikappa B-NF-kappa B Signaling Module: Temporal Control and Selective Gene Activation. Science. 2002;298(5596):1241–1245. doi: 10.1126/science.1071914. [DOI] [PubMed] [Google Scholar]
- Howell D. Statistical Methods for Psychology. Boston: Duxbury Press; 1987. [Google Scholar]
- Huse M, Lillemeier Br, Kuhns M, Chen D, Davis M. T cells use two directionally distinct pathways for cytokine secretion. Nature Immunology. 2006;7(3):247–255. doi: 10.1038/ni1304. [DOI] [PubMed] [Google Scholar]
- Irvine D. The Method of Controlled Mathematical Comparison. In: Voit E, editor. Canonical Nonlinear Modeling. S-System Approach to Understanding Complexity. New York: Van Nostrand Reinhold; 1991. pp. 90–109. [Google Scholar]
- Kakhlon O, Gruenbaum Y, Cabantchik Z. Repression of ferritin expression increases the labile iron pool, oxidative stress, and short-term growth of human erythroleukemia cells. Blood. 2001;97(9):2863–2871. doi: 10.1182/blood.v97.9.2863. [DOI] [PubMed] [Google Scholar]
- Kim S, Ponka P. Role of nitric oxide in cellular iron metabolism. Biometals. 2003;16:125–135. doi: 10.1023/a:1020788603046. [DOI] [PubMed] [Google Scholar]
- Lorsbach RB, Murphy WJ, Lowenstein CJ, Snyder SH, Russell SW. Expression of the nitric oxide synthase gene in mouse macrophages activated for tumor cell killing. Molecular basis for the synergy between interferon-gamma and lipopolysaccharide. J Biol Chem. 1993;268:1908–1913. [PubMed] [Google Scholar]
- Manca C, Tsenova L, Barry C, Bergtold A, Freeman S, Haslett P, Musser J, Freedman V, Kaplan G. Mycobacterium tuberculosis CDC1551 Induces a More Vigorous Host Response In Vivo and In Vitro, But Is Not More Virulent Than Other Clinical Isolates. J Immunol. 1999;162(11):6740–6746. [PubMed] [Google Scholar]
- McKay MD, Conover WJ, Beckman RJ. A comparison of three methods of selecting values of input variables in the analysis of output from a computer code. Technometrics. 1979;21:239–245. [Google Scholar]
- Means TK, Wang S, Lien E, Yoshimura A, Golenbock DT, Fenton MJ. Human toll-like receptors mediate cellular activation by Mycobacterium tuberculosis. J Immunol. 1999;163:3920–3927. [PubMed] [Google Scholar]
- Miller R, Britigan B. Role of oxidants in microbial pathophysiology. Clin Microbiol Rev. 1997;10(1):1–18. doi: 10.1128/cmr.10.1.1. [DOI] [PMC free article] [PubMed] [Google Scholar]
- Nathan C, Shiloh MU. Reactive oxygen and nitrogen intermediates in the relationship between mammalian hosts and microbial pathogens. Proc Natl Acad Sci U S A. 2000;97:8841–8848. doi: 10.1073/pnas.97.16.8841. [DOI] [PMC free article] [PubMed] [Google Scholar]
- Nathan CF, Murray HW, Wiebe ME, Rubin BY. Identification of interferon-gamma as the lymphokine that activates human macrophage oxidative metabolism and antimicrobial activity. J Exp Med. 1983;158(3):670–689. doi: 10.1084/jem.158.3.670. [DOI] [PMC free article] [PubMed] [Google Scholar]
- Nigou J, Vercellone A, Puzo G. New structural insights into the molecular deciphering of mycobacterial lipoglycan binding to C-type lectins: lipoarabinomannan glycoform characterization and quantification by capillary electrophoresis at the subnanomole level. J Mol Biol. 2000;299(5):1353–1362. doi: 10.1006/jmbi.2000.3821. [DOI] [PubMed] [Google Scholar]
- Ohno H, Zhu G, Mohan V, Chu D, Kohno S, Jacobs W, Chan J. The effects of reactive nitrogen intermediates on gene expression in Mycobacterium tuberculosis. Cell Microbiol. 2003;5(9):637–648. doi: 10.1046/j.1462-5822.2003.00307.x. [DOI] [PubMed] [Google Scholar]
- Olakanmi O, Schlesinger LS, Ahmed A, Britigan BE. Intraphagosomal Mycobacterium tuberculosis acquires iron from both extracellular transferrin and intracellular iron pools. Impact of interferon-gamma and hemochromatosis. J Biol Chem. 2002;277:49727–49734. doi: 10.1074/jbc.M209768200. [DOI] [PubMed] [Google Scholar]
- Paul S, Laochumroonvoranpong P, Kaplan G. Comparable growth rates of virulent and avirulent Mycobacterium tuberculosis in human macrophages in vitro. J Infect Dis. 1996;177:1723. doi: 10.1093/infdis/174.1.105. [DOI] [PubMed] [Google Scholar]
- Raghu B, Sarma GR, Venkatesan P. Effect of iron on the growth and siderophore production of mycobacteria. Biochem Mol Biol Int. 1993;31:341–348. [PubMed] [Google Scholar]
- Ray JCJ, Kirschner DE. Requirement for multiple activation signals by anti-inflammatory feedback in macrophages. J Theor Biol. 2006;241(2):276–294. doi: 10.1016/j.jtbi.2005.11.037. [DOI] [PubMed] [Google Scholar]
- Rook G, Steele J, Ainsworth M, Champion B. Activation of macrophages to inhibit proliferation of Mycobacterium tuberculosis: comparison of the effects of recombinant gamma-interferon on human monocytes and murine peritoneal macrophages. Immunology. 1986;59(3):333–338. [PMC free article] [PubMed] [Google Scholar]
- Ruan J, John GS, Ehrt S, Riley L, Nathan C. noxR3, a novel gene from Mycobacterium tuberculosis, protects Salmonella typhimurium from nitrosative and oxidative stress. Infect Immun. 1999;67:3276–3283. doi: 10.1128/iai.67.7.3276-3283.1999. [DOI] [PMC free article] [PubMed] [Google Scholar]
- Sato K, Akaki T, Tomioka H. Differential potentiation of anti-mycobacterial activity and reactive nitrogen intermediate-producing ability of murine peritoneal macrophages activated by interferon-gamma (IFN-gamma) and tumour necrosis factor-alpha (TNF-alpha) Clin Exp Immunol. 1998;112:63–68. doi: 10.1046/j.1365-2249.1998.00554.x. [DOI] [PMC free article] [PubMed] [Google Scholar]
- Savageau MA. Power-law formalism: A canonical nonlinear approach to modeling and analysis in World Congress of Nonlinear Analysts. 1996;4:3323–3334. [Google Scholar]
- Savageau MA. Design principles for elementary gene circuits: Elements, methods, and examples. Chaos. 2001;11:142–159. doi: 10.1063/1.1349892. [DOI] [PubMed] [Google Scholar]
- Savageau MA. Alternative designs for a genetic switch: analysis of switching times using the piecewise power-law representation. Math Biosci. 2002;180:237–253. doi: 10.1016/s0025-5564(02)00113-x. [DOI] [PubMed] [Google Scholar]
- Schaible UE, Kaufmann SHE. Iron and microbial infection. Nature Reviews Microbiology. 2004;2(12):946–953. doi: 10.1038/nrmicro1046. [DOI] [PubMed] [Google Scholar]
- Schwacke J, Voit E. Improved methods for the mathematically controlled comparison of biochemical systems. Theor Biol Med Model. 2004;1:1. doi: 10.1186/1742-4682-1-1. [DOI] [PMC free article] [PubMed] [Google Scholar]
- Shaffer JP. Multiple Hypothesis Testing. Ann. Rev. Psych. 1995;46:561–584. [Google Scholar]
- Shaughnessy LM, Swanson JA. The role of the activated macrophage in clearing Listeria monocytogenes infection. Front Biosci. 2007;12:2683–2692. doi: 10.2741/2364. [DOI] [PMC free article] [PubMed] [Google Scholar]
- Silver R, Li Q, Ellner J. Expression of Virulence of Mycobacterium tuberculosis within Human Monocytes: Virulence Correlates with Intracellular Growth and Induction of Tumor Necrosis Factor Alpha but Not with Evasion of Lymphocyte-Dependent Monocyte Effector Functions. Infect Immun. 1998;66(3):1190–1199. doi: 10.1128/iai.66.3.1190-1199.1998. [DOI] [PMC free article] [PubMed] [Google Scholar]
- Springer B, Master S, Sander P, Zahrt T, McFalone M, Song J, Papavinasasundaram KG, Colston MJ, Boettger E, Deretic V. Silencing of oxidative stress response in Mycobacterium tuberculosis: expression patterns of ahpC in virulent and avirulent strains and effect of ahpC inactivation. Infect Immun. 2001;69:5967–5973. doi: 10.1128/IAI.69.10.5967-5973.2001. [DOI] [PMC free article] [PubMed] [Google Scholar]
- Voskuil M, Visconti K, Schoolnik G. Mycobacterium tuberculosis gene expression during adaptation to stationary phase and low-oxygen dormancy. Tuberculosis (Edinb) 2004;84(3–4):218–227. doi: 10.1016/j.tube.2004.02.003. [DOI] [PubMed] [Google Scholar]
- Weiss G, Werner-Felmayer G, Werner ER, Grunewald K, Wachter H, Hentze MW. Iron regulates nitric oxide synthase activity by controlling nuclear transcription. J Exp Med. 1994;180:969–976. doi: 10.1084/jem.180.3.969. [DOI] [PMC free article] [PubMed] [Google Scholar]
- Yu K, Mitchell C, Xing Y, Magliozzo RS, Bloom BR, Chan J. Toxicity of nitrogen oxides and related oxidants on mycobacteria: M. tuberculosis is resistant to peroxynitrite anion. Tuber Lung Dis. 1999;79(4):191–198. doi: 10.1054/tuld.1998.0203. [DOI] [PubMed] [Google Scholar]
- Zhang M, Gong J, Lin Y, Barnes P. Growth of Virulent and Avirulent Mycobacterium tuberculosis Strains in Human Macrophages. Infect Immun. 1998;66(2):794–799. doi: 10.1128/iai.66.2.794-799.1998. [DOI] [PMC free article] [PubMed] [Google Scholar]


