Abstract
Recently, the target function for crystallographic refinement has been improved through a maximum likelihood analysis, which makes proper allowance for the effects of data quality, model errors, and incompleteness. The maximum likelihood target reduces the significance of false local minima during the refinement process, but it does not completely eliminate them, necessitating the use of stochastic optimization methods such as simulated annealing for poor initial models. It is shown that the combination of maximum likelihood with cross-validation, which reduces overfitting, and simulated annealing by torsion angle molecular dynamics, which simplifies the conformational search problem, results in a major improvement of the radius of convergence of refinement and the accuracy of the refined structure. Torsion angle molecular dynamics and the maximum likelihood target function interact synergistically, the combination of both methods being significantly more powerful than each method individually. This is demonstrated in realistic test cases at two typical minimum Bragg spacings (dmin = 2.0 and 2.8 Å, respectively), illustrating the broad applicability of the combined method. In an application to the refinement of a new crystal structure, the combined method automatically corrected a mistraced loop in a poor initial model, moving the backbone by 4 Å.
The aim of macromolecular crystallography is to obtain an accurate atomic model based on the observed diffraction data. This model needs to be optimized to obtain the best agreement with the observed diffraction data. Several specialized optimization methods have been developed to refine macromolecules, including partial and full matrix least-squares (1, 2), conjugate gradient minimization (3), and molecular dynamics-based simulated annealing (4, 5). However, the refinement of macromolecular structures is often difficult for several reasons. First, the data-to-parameter ratio is low, creating the danger of overfitting the diffraction data. Therefore, the apparent ratio of data to parameters is often increased by incorporation of chemical information, i.e., bond length and bond angle restraints obtained from ideal values seen in high resolution structures (1). Second, the initial model is often poor because of the typically limited quality of experimental phases, and there is, therefore, some discrepancy to the actual structure of the crystallized molecule. Third, local (false) minima exist in the target function. The more local minima there are and the deeper the minima are, the more likely refinement will fail. Fourth, model bias in the electron density maps complicates the process of manual refitting between cycles of automated refinement. This problem is exacerbated by overfitting the diffraction data in the refinement process.
Methods have been devised to address these difficulties. Cross-validation, in the form of the free R-value, can be used to detect overfitting (6–8). The radius of convergence of refinement can be increased by the use of stochastic optimization methods such as molecular dynamics-based simulated annealing (4). Introduction of torsion angle-based approaches (9, 10) reduce the number of degrees of freedom by making the reasonable assumption that bond lengths and angles are approximately constant. The implementation of this method within the framework of molecular dynamics has been shown to increase dramatically the radius of convergence of refinement and to decrease overfitting (10, 11).
As with any optimization problem, the efficiency of the refinement method depends on the complexity of the landscape of the target function. This landscape is also influenced by the way model incompleteness and errors are modelled. The most commonly used target function (ELSQ) for macromolecular refinement employs the least-squares residual for the diffraction data,
 |
1 |
where |Fo| and |Fc| are the observed and calculated structure-factor amplitudes, k is a relative scale factor, wa is a weight, and Erestraints are geometric (bond length, bond angle, and atomic repulsion) restraints. A decrease of this function can sometimes be due to accumulation of systematic errors in the model without improvement or even a worsening of the model (12). The underlying reason can be found in the fact that the least-squares residual does not account for the effects of phase errors in the calculated structure factors, so it is poorly justified when the model is far away from the correct answer or incomplete (13). A more appropriate target for macromolecular refinement can be obtained through a maximum likelihood formulation (14–16), and such implementations have been recently described (13, 17, 18).
The goal of the maximum likelihood method is to determine the probability of making a set of measurements, given the model, and estimates of its errors and of errors in the measured intensities. The effects of model errors (misplaced atoms and missing atoms) on the calculated structure factors are first quantified with σA values, which correspond roughly to the fraction of each structure factor that is expected to be correct (13, 19). To achieve an improvement over the least-squares residual (Eq. 1), cross-validation (6, 8) was used for the computation of σA, necessitating its calculation with a randomly selected test set of diffraction data that was never included in the refinement process (13). The need for cross-validation is demonstrated in Results. The cross-validated σA values (σAcv) are then used to compute the expected value of 〈|Fo|〉cv and the corresponding variance (σMLcv2) (13). 〈|Fo|〉cv for the acentric case is given by
 |
2 |
For the centric case, the expected value is
 |
3 |
where ɛ is the expected intensity factor, σΔ2 = ΣN − D2ΣP, ΣN is the distribution parameter of the Wilson intensity distribution for |Fo| (20) and ΣP is the distribution parameter of the Wilson intensity distribution for |Fc|, and Φ(a, b, x) is Kummer’s confluent hypergeometric function. The parameters ΣN, ΣP, and D are calculated using cross-validated data. 〈|Fo|〉cv and σMLcv2 can be readily incorporated into a maximum likelihood target function,
 |
4 |
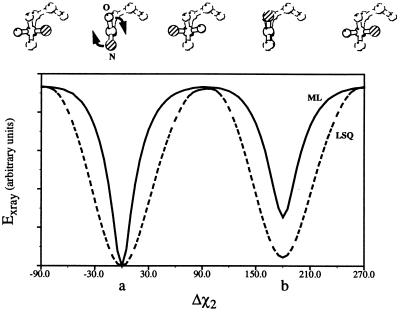
Fig. 1 shows the improvement of the target function by maximum likelihood; the false minimum is less pronounced compared with the least-squares residual. Despite this major improvement, local minima still exist (Fig. 1), which causes a limited radius of convergence when gradient descent optimization methods are used. Here we show that torsion angle molecular dynamics and the cross-validated maximum likelihood target EML, each of which independently improves the refinement of poor models, combine synergistically to significantly improve macromolecular crystallographic refinement.
Figure 1.
A comparison of the energy landscapes of the least-squares residual (dashed line) and the maximum likelihood target (solid line). An asparagine residue was placed in a P1 unit cell of size a = 40 Å, b = 40 Å, and c = 40 Å. Diffraction data from 20- to 2-Å resolution were calculated from the structure in its initial conformation. These data were modified by addition of Gaussian error (± 10% of |F|). A single value of σF, 10% of the average amplitude, was used for all reflections. The χ2 dihedral was then rotated in 5° steps, and the value of the x-ray target (Eqs. 1 and 4), compared with the model diffraction data, was calculated at each position. The two minima correspond to the correct solution (a) and a false minimum with the positions of OD1 and ND2 inverted (b). The maximum likelihood target clearly shows sharper minima, broader, flatter maxima, and a less deep false minimum.
METHODS
Refinement Protocol.
A maximum likelihood function using cross-validated σA weighting (19) and experimental amplitudes has been described previously (13). Several improvements to the original method were implemented for the smoothing of the cross-validated σA function, the determination of the optimal weight between experimental and geometric restraints (wa), and automation of the refinement procedure.
The σA function is used to obtain an estimate of the effect of model errors and incompleteness. To make this estimate as unbiased as possible, cross-validation is used by setting aside a randomly selected set of typically 10% of the diffraction data for the calculation of σAcv, while the remaining 90% is used in the target function (“working set,” Eq. 4) (6, 8, 13). The relatively small number of reflections in the test set results in large fluctuations in the σAcv values when calculated as a function of resolution. Therefore, during the optimization of likelihood as a function of σAcv, a harmonic term is added to the target to restrain the resolution-dependent σAcv values to the average of the two neighboring resolution bins. This restraint serves to smooth the σAcv function.
The optimal weight (wa) between the x-ray and geometric terms (Eqs. 1 and 4) was estimated by
 |
5 |
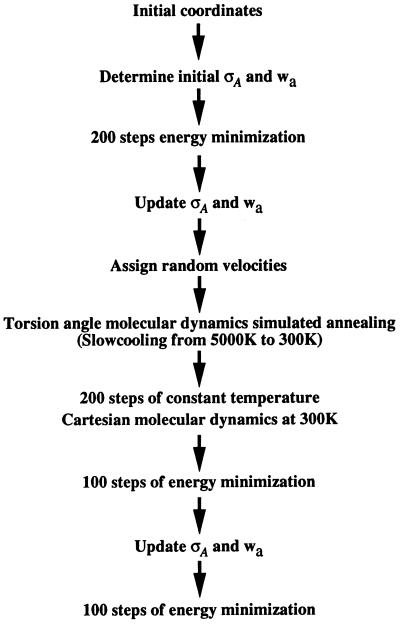
after an unrestrained (i.e., with wa set to 0 in Eqs. 1 and 4) molecular dynamics simulation (4). For the maximum likelihood target (Eq. 4), it became clear that the choice of wa is very important, in contrast to least-squares residual based refinements where changes of up to a factor of 2 in wa make little difference (unpublished data). Therefore, an automated method was developed to adjust wa during the course of refinement. At stages in the refinement protocol where the model may have significantly changed, the new weight (wa) between the geometric and x-ray terms was recalculated (using Eq. 5). For the maximum likelihood target, the σA values were recalculated before recalculation of wa. The points at which model changes were greatest were after initial minimization and simulated annealing (Fig. 2).
Figure 2.
Automated torsion angle dynamics simulated annealing protocol for maximum likelihood-based refinement. Refinements with the maximum likelihood target calculated initial σA values that were used through an initial 200 conjugate gradient minimization steps, after which the estimates of σA and the weight (wa) were updated. Torsion angle molecular dynamics in combination with simulated annealing started from a temperature of 5,000 K and decreased in 25 K steps to 300 K, and 12 steps of dynamics with a timestep of 2 fs were carried out for each temperature drop. After torsion angle molecular dynamics 200 steps of Cartesian molecular dynamics were carried out at a constant temperature of 300 K followed by 100 steps of conjugate gradient minimization. A final 100 steps of minimization were performed after a final update of the σA and wa values.
Details of this new highly automated protocol are shown in Fig. 2. Note that the protocol does not require any “preparation” stage, minimizing the possibility of user error. Simulated annealing refinements were repeated 10 times with different initial velocities. A modified version of the parameter set of Engh and Huber (21) was used for all refinements, where the nonbonded terms were modified to be similar to those implemented in prolsq using a quartic, repulsive nonbonded energy function (1, 22). Temperatures during simulated annealing were maintained at a constant value by coupling to a temperature bath (23).
Refinements were carried out with a developmental program that combines the maximum likelihood target with both simulated annealing using torsion angle molecular dynamics and conjugate gradient minimization (which will be made available upon request from A.T.B.).
Test Cases.
Test refinements were carried out using the crystal structure of amylase inhibitor (24). Unit cell dimensions in spacegroup P212121 are a = 61.76 Å, b = 40.73 Å, and c = 26.74 Å. Diffraction data were measured for the resolution range 17–2.0 Å, and all data with |F| < 2σF were discarded for comparison with the published refined structure (24). Refinements using the maximum likelihood target (Eq. 4) used all data from 17- to 2-Å resolution. For this test case, use of the bulk solvent model with the least-squares residual gave worse results than use of a truncated data range. This was probably due to the large coordinate error for many of the starting models and the relatively low solvent content (30%) of the crystal. Therefore, no bulk solvent model and a truncated data range of 8–2 Å was used in the least-squares refinements described below.
Models with increasing coordinate error were generated by performing an unrestrained molecular dynamics simulation at 600 K starting from the published crystal structure (10). The resulting scrambled models were energy minimized to achieve starting models with good geometry and nonbonded interactions. Five models were obtained with rms backbone (C, CA, N) errors between 0.6 and 1.9 Å from the crystal structure.
Molecular Replacement Is Successful with the Models Scrambled by Molecular Dynamics.
To ensure that the resulting scrambled models represent realistic starting structures, molecular replacement was carried out using the experimental amylase inhibitor data. The molecular replacement protocol consisted of the direct rotation function (25) followed by translation searches (26) around the top 10 grid points of the rotation function computed using data from 15- to 3.5-Å resolution. Briefly, a 10° grid search in Euler angle space using 5° steps was carried out around each of the top 10 grid points, resulting in 1,250 translation searches. The top translation function solutions were rigid body refined and scored according to the Patterson correlation coefficient (27). The correct solution was obtained in all five cases studied both with a full-atom and a poly-alanine model. The signal-to-noise ratio (ratio of the Patterson correlation coefficient for the correct and highest incorrect solution) ranged from 1.44 for the best model to 0.93 for the worst model. The correct solution was always the top translation search peak except in the case of the worst search model, which had a backbone coordinate rms deviation of 1.9 Å. However, torsion angle molecular dynamics simulated annealing refinement, using the maximum likelihood target, of the top two peaks for the worst model clearly indicated that the correct solution was the second peak, as assessed by both the R-value and free R-value. Thus, all five scrambled models contain sufficient information to solve the crystal structure through an extensive molecular replacement search.
The models after refinement were compared with the published amylase inhibitor crystal structure (24). The unweighted phase error was calculated for all data (17–2 Å or 17–2.8 Å). The rms error for backbone atoms (excluding residues 1–4, which are very flexible as indicated by their high B-values) was also calculated.
Application to a New Crystal Structure.
A partially refined model of the recently solved crystal structure of human hnRNP A1 (28) was used. This small RNA binding protein was crystallized in spacegroup P21 with unit cell dimension a = 38.1 Å, b = 44.0 Å, c = 56.1 Å, and β = 94.8°. The initial free R-value for the model, against a lower resolution data set to 2.2 Å, was 46.9%, and the R-value was 38.6%. Conjugate gradient minimization and simulated annealing using torsion angle dynamics from a starting temperature of 10,000 K were carried out. The full resolution range of 35–2.2 Å, with no weak data excluded, was used in refinements using either the least-squares or maximum likelihood targets. A bulk solvent correction (29) was applied (ksol = 0.42 electron/Å3 and Bsol = 154.8 Å2), resulting in a major improvement in both R-value and free R-value, in contrast to the amylase inhibitor test case. Refinements were repeated five times, with different initial velocities.
RESULTS
Test Case with All Atoms.
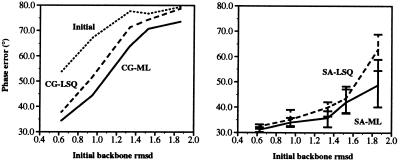
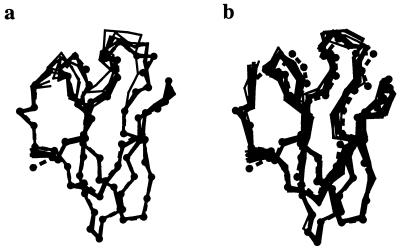
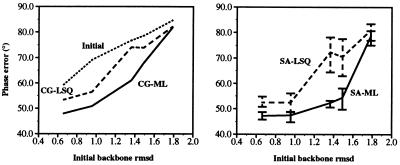
The models placed according to the molecular replacement search solutions were used as starting points for refinement against the amylase inhibitor diffraction data. Both conjugate gradient minimization and simulated annealing with torsion angle molecular dynamics were carried out to compare the performance of the maximum likelihood target against the least-squares residual. Fig. 3 shows that the maximum likelihood target produces models with lower phase error. For conjugate gradient minimization, the average phase improvement, compared with the least-squares residual, is approximately 5°. It can also be seen that torsion angle molecular dynamics using the least-squares residual has a larger radius of convergence than minimization with the maximum likelihood target, and that the convergence of torsion angle molecular dynamics is further improved by the use of the maximum likelihood target (Fig. 3). For the most scrambled model, an average phase improvement, compared with the least-squares residual, of more than 15° is obtained. The resulting structures are very close to the published crystal structure (Fig. 4). The large spread in structures observed for the least-squares residual refinement is due to limited radius of convergence and, in this particular case, should not be interpreted as conformational variability in the structure.
Figure 3.
Final phase error for the least-squares residual target, Eq. 1 (dashed line), and the maximum likelihood target, Eq. 4 (solid line), for refinements of the scrambled amylase inhibitor structures against diffraction data at dmin = 2.0 Å, with respect to the published crystal structure. (Left) Results for conjugate gradient minimization. (Right) Results for 10 simulated annealing runs with torsion angle dynamics. The simulated annealing graph shows the average of 10 refinements with different initial velocities. Error bars indicate the maximum and minimum phase errors obtained with 10 simulated annealing runs. The best structures are readily identified by the lowest free R-value. Initial phase errors are shown by the upper dotted line.
Figure 4.
(a) Result of 10 simulated annealing refinements with the maximum likelihood target (solid lines), compared with the published amylase inhibitor crystal structure (dashed line with Cα atoms shown as solid circles). (b) Same results for 10 refinements with the least-squares residual. The starting model has an rms deviation of 1.9 Å from the published crystal structure. This figure was created with the program molscript (30).
Local minima cause gradient descent methods to become trapped, whereas simulated annealing-based methods can partially overcome this problem. This clearly also applies to the maximum likelihood target (Fig. 3). Extensive minimization consisting of 10 macrocycles of conjugate gradient minimization, each of 200 steps followed by an update of σA and its derived quantities, was carried out for the model with 1.53 Å rms initial backbone coordinate error (a total of 2,000 steps of minimization, with the estimates of σAcv being updated every 200 steps). The free R-value and phase error were decreased (Table 1). However, the resulting structures are much poorer than those obtainable by simulated annealing (Fig. 3).
Table 1.
Comparison of simulated annealing with torsion angle dynamics and repeated conjugate gradient minimization interspersed by σA updates
| Refinements | Free R-value, % | R-value, % | Phase error, ° |
|---|---|---|---|
| TAD-SA | |||
| Initial | 55.4 | 53.4 | 76.7 |
| Average | 40.8 | 36.4 | 42.1 |
| Best | 37.7 | 35.5 | 37.9 |
| Minimization | |||
| CV | 43.2 | 36.6 | 48.0 |
| No CV | 51.5 | 43.4 | 64.0 |
Ten independent simulated annealing refinements were carried out with different initial velocities on the scrambled amylase inhibitor model with 1.53 Å rms initial coordinate error; averages refer to the numerical average of the 10 refinements. Ten cycles of conjugate gradient minimization, each of 200 steps, were performed. Minimizations were repeated with and without cross-validation (CV) to calculate the maximum likelihood target. TAD-SA, torsion angle dynamics.
Cross-validation is essential in the calculation of the maximum likelihood target (8, 13). Its importance was demonstrated by using all reflections in the calculation of σAcv. Repeated conjugate gradient refinements were performed as above, interspersed by σAcv and wa updates, for the model with 1.53 Å rms initial backbone coordinate error. The refinement without cross-validation gave much poorer results, as indicated by the high free R-value and phase error (Table 1). In addition, the difference between the R-value and free R-value is significantly larger (8.1%) compared with the refinement where cross-validation was used (6.6%). Therefore, cross-validation is essential to obtain good results with this maximum likelihood target.
Test Case with Low Resolution Data.
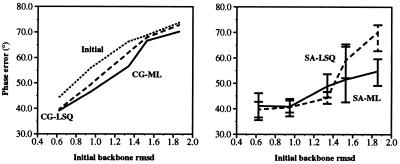
The molecular replacement solutions for the five scrambled structures were used also in test refinements against lower resolution diffraction data that were created from the observed amylase inhibitor amplitudes by the application of a B-factor of 45 Å2 to both amplitudes (|F|) and σF values. Refinements were carried out as before, starting with the 3.5-Å molecular replacement solution, but at the reduced resolution range of 17–2.8 Å for the maximum likelihood target and 8–2.8 Å for the least-squares target against this lower resolution data set. As for the higher resolution refinements, the maximum likelihood target produces models with lower phase error in most cases (Fig. 5). For smaller initial coordinate error, the results for either target are comparable. However, at higher initial error, maximum likelihood only gives superior results when used in combination with simulated annealing.
Figure 5.
Final phase error for the least-squares residual target, Eq. 1 (dashed line), and the maximum likelihood target, Eq. 4 (solid line), for refinements of the scrambled amylase inhibitor structures against lower resolution diffraction data at dmin = 2.8 Å (see text), with respect to the published crystal structure. (Left) Results for conjugate gradient minimization. (Right) Results for 10 simulated annealing runs with torsion angle dynamics. The simulated annealing graph shows the average of 10 refinements with different initial velocities. Error bars indicate the maximum and minimum phase errors obtained with 10 simulated annealing runs. The best structures are readily identified by the lowest free R-value. Initial phase errors are shown by the upper dotted line.
Test Case with Poly-Alanine Models.
To thoroughly test the limits of the methods, both molecular replacement and refinement were repeated using poly-alanine-only models. Molecular replacement was successful in all five cases (with signal-to-noise ratios ranging from 1.57 to 1.07). After refinement against the amylase inhibitor diffraction data, the final phase errors show that the combination of simulated annealing and the maximum likelihood target are again consistently better except for the worst initial model (Fig. 6). In this latter case all methods fail to converge. However, torsion angle molecular dynamics simulated annealing in combination with the maximum likelihood target is able to successfully refine models with initial rms deviation errors of between 1.3 Å and 1.5 Å (Fig. 6). The least-squares residual is unable to improve these models.
Figure 6.
Final phase error for the least-squares residual target, Eq. 1 (dashed line), and the maximum likelihood target, Eq. 4 (solid line), for refinements of the poly-alanine only scrambled amylase inhibitor structures against diffraction data at dmin = 2.0 Å, with respect to the published crystal structure. (Left) Results for conjugate gradient minimization. (Right) Results for 10 simulated annealing runs with torsion angle dynamics. The simulated annealing graph shows the average of 10 refinements with different initial velocities. Error bars indicate the maximum and minimum phase errors obtained with 10 simulated annealing runs. The best structures are readily identified by the lowest free R-value. Initial phase errors are shown by the upper dotted line.
Application to a New Crystal Structure.
A partially refined model of the recently solved crystal structure of human hnRNP A1 (28) was refined at 2.2-Å resolution using simulated annealing with both the least-squares residual and the maximum likelihood target. This structure had proved difficult to refine, partially because of some large initial errors in the model. Refinement of the structure was only successful using a combination of simulated annealing, torsion angle molecular dynamics and multiple refinements followed by averaging (L. M. Rice, Y. Shamoo, and A.T.B., unpublished work). A model from the early stages of refinement, therefore, provided a good test case for the new maximum likelihood target.
Conjugate gradient minimization refinement with the maximum likelihood target and the least-squares residual target both reduced the free R-value to 44.4%. The maximum likelihood target, however, reduces the amount of model bias to the incorrect initial model (Fig. 7b). This is apparent in the smaller difference between the free R-value and R-value (6%) compared with the least-squares residual target (9%).
Figure 7.
Electron density maps for a loop region of human hnRNP A1 comprising residues 141–143 (all maps σA weighted and contoured at 1.0 σ). In all cases, the final refined structure is shown in black. (a) Best model (shown in red) from five simulated annealing refinements using the least-squares target. The connected density in the region of the model and the broken density in the region of the correct solution is due to model bias. (b) Model (shown in blue) from conjugate gradient minimization using the maximum likelihood target. Reduced model bias due to the maximum likelihood target results in connected electron density in the region of the correct solution. (c) Representative model (shown in orange) from five simulated annealing refinements using the maximum likelihood target. The combination of torsion angle simulated annealing and the maximum likelihood target reduces model bias even further. (d) Best model (shown in green) from five simulated annealing refinements using the maximum likelihood target. The correct placement of the residues has been automatically achieved. These images were created with the program o (31).
Torsion angle molecular dynamics simulated annealing refinements with the maximum likelihood target and the least-squares residual target both reduced the free R-value compared with conjugate gradient minimization, with average values over five refinements of 42.4% and 42.9%, respectively. However, the structure with the lowest free R-value was produced by torsion angle dynamics with the maximum likelihood target (free R-value = 40.9%, R-value = 36.2%). In this structure, a mistraced loop was automatically corrected by a backbone movement of 4 Å (Fig. 7d), with a resulting rms deviation from the final model for Cα atoms in this loop region of 0.98 Å. In contrast, refinements with the least-squares residual made no significant change to this loop, with the resulting rms deviation for Cα atoms being 2.5 Å. In addition, the lowest free R-value from the least-squares target (free R-value = 41.8%, R-value = 33.7%) shows a high level of model bias in the electron density map (Fig. 7a). The other torsion angle refinements with the maximum likelihood target, despite only small movements in this loop region, show significantly less model bias than the least-squares refinements (Fig. 7c).
DISCUSSION
The cross-validated maximum likelihood target (Eq. 4) is most powerful when used in combination with torsion angle simulated annealing. Although this new target also improves conjugate gradient minimization based refinement, the radius of convergence is still smaller than that of torsion angle simulated annealing. Even with the least-squares residual (Eq. 1), simulated annealing is superior to minimization with maximum likelihood. However, the addition of the maximum likelihood target significantly improves the radius of convergence of torsion angle simulated annealing and reduces overfitting. In this series of tests, refinement of structures with initial rms backbone errors up to 1.8 Å converge to the correct solution. These examples are typical for weak molecular replacement solutions where the initial phases are so poor that the refinement method has to be relied upon to fully solve the structure.
A fundamental problem with the least-squares residual (Eq. 1) is the danger of overfitting the diffraction data. Systematic errors that reduce the difference between |Fo| and |Fc| can be introduced into the model. This is of particular concern in macromolecular crystallography, where repeated cycles of manual rebuilding and refinement are performed. A significant advantage of the maximum likelihood formulation is that the amount of overfitting is reduced (Table 1). In general the maximum likelihood target produces higher R-values, but more accurate models and lower or equal free R-values, compared with the least-squares target. This reduced overfitting serves to reduce model-bias in electron density maps, of crucial importance during the manual rebuilding stages of refinement (Fig. 7).
The cross-validated maximum likelihood target tested here is shown to be superior to the standard least-squares residual. Final phase errors are reduced and the convergence of macromolecular refinement is improved. The direct incorporation of model errors using the σA function into the maximum likelihood target makes it most powerful for high initial phase errors, when the model is often incomplete and has significant deviations from the crystal structure. This is the case at both medium (2.0 Å) and lower (2.8 Å) resolution. The maximum likelihood target allows all diffraction data to be used without the need for artificial resolution or |Fo|/σF truncations and without the need for bulk solvent correction at the early stages of refinement. This and the larger radius of convergence make the combination of cross-validated maximum likelihood and torsion angle simulated annealing an important new tool for macromolecular crystallography.
Acknowledgments
We thank Luke Rice for stimulating discussions and critical reading of this manuscript. We also thank Yousif Shamoo and Thomas A. Steitz for access to coordinates and diffraction data for human hnRNP A1. This work was supported by a grant from the National Science Foundation (ASC 93–181159) to A.T.B., a grant from the Natural Sciences and Engineering Research Council of Canada to N.S.P., and grants from the Alberta Heritage Foundation for Medical Research and the Medical Research Council of Canada (MT11000) to R.J.R.
References
- 1.Hendrickson W A. Methods Enzymol. 1985;115:252–270. doi: 10.1016/0076-6879(85)15021-4. [DOI] [PubMed] [Google Scholar]
- 2.Tronrud D E, Ten Eyck L F, Matthews B W. Acta Crystallogr A. 1987;43:489–500. [Google Scholar]
- 3.Jack A, Levitt M. Acta Crystallogr A. 1978;34:931–935. [Google Scholar]
- 4.Brünger A T, Kuriyan J, Karplus M. Science. 1987;235:458–460. doi: 10.1126/science.235.4787.458. [DOI] [PubMed] [Google Scholar]
- 5.Gros P, Betzel C, Dauter Z, Wilson K S, Hol W G J. J Mol Biol. 1989;210:347–367. doi: 10.1016/0022-2836(89)90336-7. [DOI] [PubMed] [Google Scholar]
- 6.Brünger A T. Nature (London) 1992;355:472–474. doi: 10.1038/355472a0. [DOI] [PubMed] [Google Scholar]
- 7.Brünger A T. Acta Crystallogr D. 1992;49:24–36. doi: 10.1107/S0907444992007352. [DOI] [PubMed] [Google Scholar]
- 8.Kleywegt G J, Brünger A T. Structure (London) 1996;4:897–904. doi: 10.1016/s0969-2126(96)00097-4. [DOI] [PubMed] [Google Scholar]
- 9.Diamond R. Acta Crystallogr A. 1971;27:436–452. [Google Scholar]
- 10.Rice L M, Brünger A T. Proteins Struct Funct Genet. 1994;19:277–290. doi: 10.1002/prot.340190403. [DOI] [PubMed] [Google Scholar]
- 11.Braig K, Adams P D, Brünger A T. Nat Struct Biol. 1995;2:1083–1094. doi: 10.1038/nsb1295-1083. [DOI] [PubMed] [Google Scholar]
- 12.Silva A M, Rossmann M G. Acta Crystallogr B. 1985;41:147–157. [Google Scholar]
- 13.Pannu N S, Read R J. Acta Crystallogr A. 1996;52:659–668. [Google Scholar]
- 14.Read R J. Acta Crystallogr A. 1990;46:900–912. [Google Scholar]
- 15.Bricogne G. Acta Crystallogr A. 1991;47:803–829. doi: 10.1107/s0108767391005433. [DOI] [PubMed] [Google Scholar]
- 16.Bricogne G. Acta Crystallogr D. 1993;49:37–60. doi: 10.1107/S0907444992010400. [DOI] [PubMed] [Google Scholar]
- 17.Bricogne G, Irwin J. In: Macromolecular Refinement: Proceedings of the CCP4 Study Weekend at Chester College, January 5–6. Bailey S, Dodson E, editors. Daresbury, U.K.: Council of the Central Laboratory of the Research Councils; 1996. pp. 85–92. [Google Scholar]
- 18.Murshudov G N, Dodson E J, Vagin A A. In: Macromolecular Refinement: Proceedings of the CCP4 Study Weekend at Chester College, January 5–6. Bailey S, Dodson E, editors. Daresbury, U.K.: Council of the Central Laboratory of the Research Councils; 1996. pp. 93–104. [Google Scholar]
- 19.Read R J. Acta Crystallogr A. 1986;42:140–149. [Google Scholar]
- 20.Wilson A J C. Acta Crystallogr. 1949;2:318–321. [Google Scholar]
- 21.Engh R A, Huber R. Acta Crystallogr A. 1991;47:392–400. [Google Scholar]
- 22.Nilges M, Clore G M, Gronenborn A M. FEBS Lett. 1988;229:317–324. doi: 10.1016/0014-5793(88)81148-7. [DOI] [PubMed] [Google Scholar]
- 23.Berendsen H J C, Postma J P M, van Gunsteren W F, DiNola A, Haak J R. J Chem Phys. 1984;81:3684–3690. [Google Scholar]
- 24.Pflugrath J W, Wiegand G, Huber R, Vértesey L. J Mol Biol. 1989;189:383–386. doi: 10.1016/0022-2836(86)90520-6. [DOI] [PubMed] [Google Scholar]
- 25.Delano W L, Brünger A T. Acta Crystallogr D. 1995;51:740–748. doi: 10.1107/S0907444995001284. [DOI] [PubMed] [Google Scholar]
- 26.Fujinaga M, Read R J. J Appl Crystallogr. 1987;20:517–521. [Google Scholar]
- 27.Hauptman H. Acta Crystallogr A. 1982;38:289–294. [Google Scholar]
- 28.Shamoo Y, Krueger U, Rice L M, Williams K R, Steitz T A. Nat Struct Biol. 1997;3:215–222. doi: 10.1038/nsb0397-215. [DOI] [PubMed] [Google Scholar]
- 29.Jiang J S, Brünger A T. J Mol Biol. 1994;243:100–105. doi: 10.1006/jmbi.1994.1633. [DOI] [PubMed] [Google Scholar]
- 30.Kraulis P J. J Appl Crystallogr. 1991;24:946–950. [Google Scholar]
- 31.Jones T A, Zou J Y, Cowan S W, Kjeldgaard M. Acta Crystallogr A. 1991;47:110–119. doi: 10.1107/s0108767390010224. [DOI] [PubMed] [Google Scholar]


