Abstract
Changes in metabolism and local circulation occur in the spinal cord during peripheral noxious stimulation. Evidence is presented that this stimulation also causes signal intensity alterations in functional magnetic resonance images of the spinal cord during formalin-induced pain. These results indicate the potential of functional magnetic resonance imaging in assessing noninvasively the extent and intensity of spinal cord excitation in this well characterized pain model. Therefore, the aim of this study was to establish functional magnetic resonance imaging as a noninvasive method to characterize temporal changes in the spinal cord after a single injection of 50 μl of formalin subcutaneously into the hindpaw of the anesthetized rat. This challenge produced a biphasic licking activity in the freely moving conscious animal. Images of the spinal cord were acquired within 2 min, enabling monitoring of the site and the temporal evolution of the signal changes during the development of formalin-induced hyperalgesia without the need of any surgical procedure. The time course of changes in the spinal cord functional image in the isoflurane-anesthetized animal was similar to that obtained from behavioral experiments. Also, comparable physiological data, control experiments, and the inhibition of a response through application of the local anesthetic agent lidocaine indicate that the signal changes observed after formalin injection were specifically related to excitability changes in the relevant segments of the lumbar spinal cord. This approach could be useful to characterize different models of pain and hyperalgesia and, more importantly, to evaluate effects of analgesic drugs.
Activation of specific brain areas following a stimulation paradigm leads to a local change in the physiological parameters of the nervous tissue which may be detected by using functional magnetic resonance imaging (fMRI) techniques (1, 2). Two mechanisms responsible for changes of the fMRI signal intensity in the activated areas have been postulated: (i) Stimulation of a brain area increases local perfusion. Depending on the MRI measurement technique, this change in local cerebral blood flow may lead to either an increase or a decrease in signal. (ii) Brain activation causes alteration in the degree of blood oxygenation. Venous blood contains a higher concentration of oxygenated hemoglobin during neuronal activation, which can be measured as a signal increase in susceptibility-weighted (gradient-recalled echo) experiments yielding blood oxygenation level-dependent (BOLD) contrast images (3). The signal increase is due to a prolongation of the T*2 relaxation time caused by a decreased concentration of paramagnetic deoxyhemoglobin. Taking all these facts together, fMRI provides sensitive measures for the characterization of functional changes in the central nervous system without the need of exogenous contrast material.
Although the main focus of fMRI studies is human brain mapping, they are also of great interest in experimental animal research. Two issues have to be addressed when conducting functional studies on animals: (i) these studies require high temporospatial resolution, and (ii) the interference of anesthesia has to be minimized. These obstacles were overcome in recent experiments using fMRI for the characterization of local cortical changes after stimulation of the front paw (4, 5) and of a single whisker¶ of the rat. Similarly to intensity changes induced by peripheral stimulation in the areas of motor cortex representing the forelimb and whisker barrels, primary afferent activation may also induce segmental intensity changes in fMRI of the spinal cord. There is strong physiological and pharmacological support for this hypothesis, as the underlying mechanisms of inflammatory and peripheral neuropathic pain involve spinal cord hyperexcitability (6) and local changes in blood flow as measured by the laser Doppler technique (7).
The major problem with conventional pharmacological and physiological spinal studies is the extent of experimental intervention. Most studies on spinal mechanisms of pain and hyperalgesia involve extensive surgery, insertion of electrodes, and exposure of the spinal cord. Also, physiological measurements of spinal events are limited in space and time, leaving the full extent of temporal changes unrevealed. Nonetheless, a few models developed for the study of pain and hyperalgesia have been satisfactorily characterized and may, therefore, provide comparative data for initial evaluation of fMRI in spinal studies. Bearing in mind the apparent limitations of fMRI, the model of formalin-induced hyperalgesia and pain (8) was chosen for the present study. This model has been thoroughly evaluated both in the anesthetized rat (8) and in behavioral experiments (9). Furthermore, the relatively brief time course of formalin-induced pain (8, 10) allows complete evaluation of the temporal profile by fMRI. In addition, pharmacological evaluation of the model provides a base for the study of analgesics.
Briefly, a single subcutaneous injection of formalin was given to induce spinal hyperactivity in the lumbar cord of anesthetized rats. To acquire images of high quality and stability for functional studies, specific problems had to be addressed. A specific spinal cord resonator with the following main characteristics was developed: (i) high signal-to-noise ratio due to high Q-value and filling factor, (ii) small geometrical dimensions allowing reduction of the field of view and thus increasing the spatial resolution, and (iii) a proper fixation allowing restriction of motion of the animal and, thus, reduction of artifacts. Using this radiofrequency probe, we have obtained high-quality images from the rat spinal cord. The proximity of the bodies and processes of the vertebrae to the probe produced susceptibility artifacts and precluded the application of susceptibility-weighted pulse sequences commonly used in fMRI. Therefore, the spin echo technique, which is compensated for magnetic field inhomogeneities, was applied at the expense of a poorer temporal resolution. This was, however, not a major concern in these experiments because of the relatively long duration of the hyperexcitability.
METHODS
Animals.
Male Sprague Dawley rats of 100–120 g body weight were used throughout the study. For the fMRI experiments, animals were anesthetized with 1% isoflurane (Forene; Abbott, Switzerland) in an oxygen/nitrous oxide mixture (1:2) administered by means of a face mask. The radiofrequency coil was mounted on the back of the rat, and the animal was positioned on a holder made of glass-fiber-reinforced epoxy resin. Care was taken to align the spine as straight as possible in the field of view of the radiofrequency probe. An infusion line (inner diameter 0.28 mm/outer diameter 0.61 mm polyethylene tube) was inserted into the skin of the left hindpaw with the tip of a stainless steel needle (27 gauge) pointing toward the ankle to allow for formalin or saline injection into the paw of the framed animal during the imaging process. A second infusion line was introduced for the administration of the local anesthetic agent lidocaine (8, 11). The animals were kept in the magnet at a temperature of 37°C for the duration of the experiment. Once the imaging procedure had been finished animals were sacrificed with an overdose of isoflurane. For behavioral studies, animals were housed individually in bedded cages. The rats were sacrificed with an overdose of isoflurane immediately after the end of the behavioral observation period. The experimental protocol was revised and approved by the Veterinarian Administration of the Canton of Basle.
MRI.
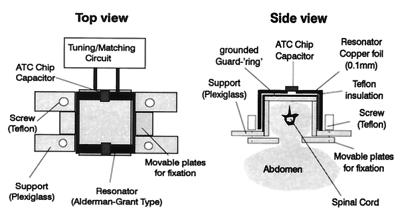
MRI experiments were performed on a Biospec 47/15 spectrometer (Bruker, Karlsruhe, Germany) equipped with a self-shielded gradient system of 85 mm inner diameter. A spinal cord MRI probe was constructed, which allowed good spatial resolution to be achieved while reducing motion artifacts. Fig. 1 shows the modified Alderman–Grant type resonator (12), which was placed on the back of the rat and firmly secured by the movable plates on both sides of the vertebral column. The respiratory motion of the animal was not restricted by the device. On the other hand, abdominal movements due to respiration did not interfere with the measurements and, hence, did not degrade image quality as this motion occurred outside the sensitive volume of the MRI probe. The dimensions of the resonator were 20 mm × 20 mm × 40 mm, yielding an optimal filling factor and sensitivity.
Figure 1.
Schematic diagram of the modified Alderman–Grant resonator used for the spinal cord experiments. Dimensions of the probe were 20 mm × 20 mm × 40 mm. The device was tightly fixed on the back of the rat with the movable plates. With this construction, motion artifacts in the images could be reduced significantly. The Q-factor of the probe loaded with the rat was 120.
A rapid acquisition with relaxation enhancement (RARE) pulse sequence (13) with a repetition delay of 1750 ms and an echo delay of 25 ms was used for image acquisition. Eight echoes were collected per acquisition, and the effective echo time was 100 ms. The field of view was 30 mm × 30 mm, the slice thickness 1 mm, and the matrix dimensions 256 × 128, yielding pixel dimensions of 117 μm × 234 μm. Four averages were recorded, resulting in a measurement time of 2 min per coronal slice. The slice was positioned on the basis transverse and sagittal scout images obtained with a snapshot fast low-angle shot (FLASH) pulse sequence (14).
Experimental Protocol for fMRI Studies.
Three series of fMRI studies were carried out: (i) 15 animals received an injection of 50 μl of a 5% formalin solution in physiological saline; (ii) 11 animals received an injection of 50 μl of a solution of 2% lidocaine in physiological saline 4 min prior to formalin administration; and (iii) control experiments were carried out in 3 rats receiving an injection of 50 μl of physiological saline. In each fMRI experiment, 30 RARE images (in the lidocaine experiment, 24 RARE images) of the spinal cord were acquired sequentially, without interrupting the acquisition to maintain steady-state relaxation. Formalin (or saline) was injected at the beginning of the acquisition of the 11th image. Thus, baseline signal intensities were determined from the first 10 images. In the lidocaine experiment, formalin was injected at the beginning of the acquisition of the 6th image (and consequently, lidocaine at the beginning of the 4th image). In this case, baseline signal intensities were determined from the first 5 images.
Image Analysis.
The magnetic resonance (MR) signal intensity was analyzed in ipsi- and contralateral regions of interest (ROI) at several levels of the spinal cord (L1 to L6) with uxnmr or ParaVision (Bruker, Karlsruhe, Germany), standard software packages of the MR equipment. To minimize the influence of slight movements of the animal in the signal evaluation, care was taken to avoid pixels at the edge of the spinal cord in the definition of the ROI. Relative intensities were calculated for each ROI according to
 |
Difference images were obtained by subtracting poststimulation from prestimulation images. Spatial low-pass filtering (3 × 3 matrix, all points weighted equally) and intensity thresholding were applied to highlight the region of altered signal intensity and to eliminate noise interference. The highlighted region was overlayed on the prestimulation image by adding the filtered and thresholded difference map to the original prestimulation image.
Behavioral Experiments.
Two groups of rats, each comprising five animals, were used for behavioral studies. Either formalin or saline was administered s.c. into the footpad of the left hindpaw (as described above), and the time spent licking the hindpaw per 5 min was measured for an observation period of 60 min. Data obtained from control (saline-injected) and formalin-treated animals were compared.
Statistical Analysis.
For each animal the area under the curve (AUC) of the relative signal intensity changes between the ipsi- and contralateral sides of the spinal cord was computed for the L4–L5 and for the L2–L3 regions. A Student’s t test has been used to compare AUCs of these two regions.
RESULTS
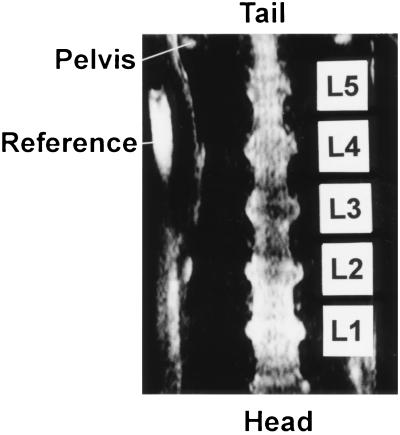
Well defined images of the lumbar spinal cord have been obtained by using the RARE sequence (Fig. 2). The easily identifiable cranial outline of the pelvic bone, which determines the level of the L5–L6 vertebrae, was used as the anatomical reference in frontal images. The lumbar spinal cord with dorsal root ganglia (DRGs) and sciatic nerve endings could be clearly defined. A reference containing water, which appears at the left side of the image, was used to define the ipsi- and contralateral sides.
Figure 2.
Image of the lumbar spinal cord featuring the L1–L5 segments of the cord. The rostral ends of the pelvis are marked by the arrow. A reference containing water marks the right side of the rat.
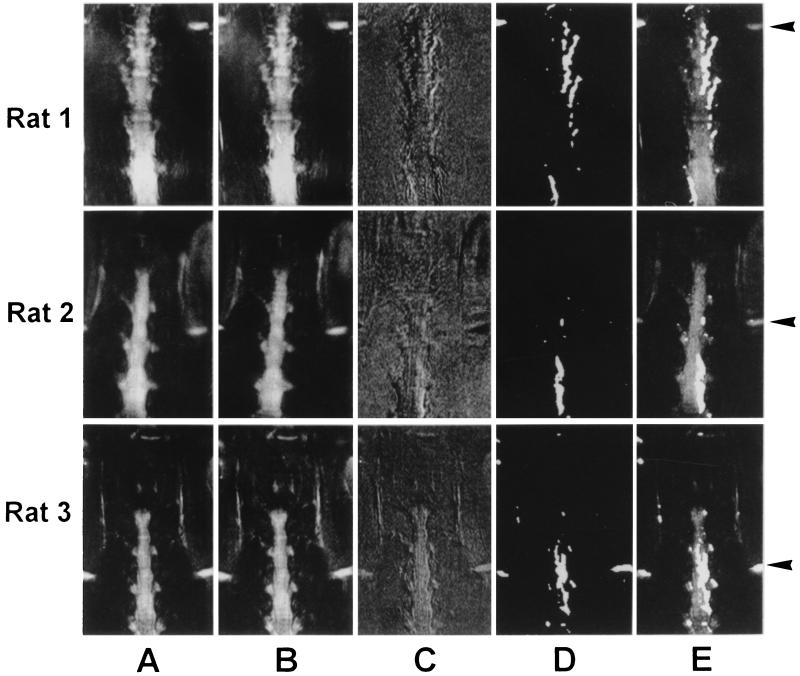
Intensity variations in serially acquired baseline images were less than 3%. After the baseline images, one of which is displayed in Fig. 3a, had been recorded, 50 μl of a 5% formalin solution was injected into the hindpaw. There was an immediate response on the ipsilateral side of the spinal cord characterized by a drop in signal intensity, while the contralateral side remained unaffected (Fig. 3 B–E). The poststimulation image is shown in Fig. 3B. The difference image (Fig. 3C) showed focal intensity at the levels L4–L6 that could be associated with the peripheral stimulation. While in rat 1 negative signals were observed at the edge of the spinal cord on the contralateral side, this was not the case for rats 2 and 3 and the others (data not shown). Spatial low-pass filtering and intensity thresholding revealed the hypo-intense signal after stimulation (Fig. 3D). The overlay with the original prestimulation image showed a region of altered signal intensity comprising L4 and L5 DRGs and the ipsilateral side of the spinal cord in the area of the lower lumbar segments (Fig. 3E). Signal changes in the spinal cord were mainly observed in the L4 and L5 segments with some cranial extension, while the more caudal (L6) segment was less affected. The discrepancy between the craniocaudal level of the affected DRGs and the ipsilateral spinal cord (see Fig. 3) is relevant to the topographical representation of the ganglia and their corresponding segments.
Figure 3.
Visualization of activated spinal cord area after injection of formalin into the left hindpaw. Data sets for three rats are shown. (A) Prestimulation images. (B) Poststimulation images. (C) Difference images (prestimulation minus poststimulation). (D) Filtered difference images (spatial low-pass filtering and intensity thresholding). (E) Overlay of images A and D. For an anatomical reference, the iliac crests were recognized as a hyperintense structure at the left and right margins of the images (arrows).
Motion artifacts could cause signal alterations which might erroneously be attributed to physiological changes in the spinal cord. The images were therefore analyzed with respect to in-plane motion by tracking the location of an anatomical landmark (DRG L5) throughout the image series. Average in-plane displacement of five images was 0.10 ± 0.26 (mean ± SEM) pixels after stimulation and 0.33 ± 0.23 pixels at the end of the experiment as compared with the image taken immediately prior to stimulation. This excludes in-plane motion to cause the observed signal changes.
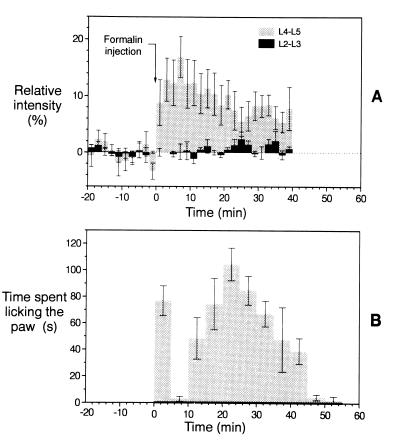
The maximum relative signal intensity difference between the ipsi- and contralateral sides of the spinal cord at the L4–L5 level after formalin injection was ΔI = 12.7% ± 3.7% (mean ± SEM) with n = 6 rats. This signal intensity difference developed rapidly at the L4–L5 level, within 2 min after formalin injection. The maximal signal intensity change occurred 10 min after injection, and the intensity slowly decreased to ΔI = 4.5% ± 1.3% after 40 min (Fig. 4). This response was essentially due to the intensity profile on the ipsilateral side. The contralateral signal increased monotonically and reached 5% ± 4% at the end of the observation period with no abrupt changes in between. The full time course of the intensity difference had a duration of about 40 min, with a rapid rise and a slow decline in amplitude. There was no sign of a double peak: the curve was monophasic. The AUCs for the affected versus the nonaffected regions were significantly different (P < 0.01). Forty percent of the animals studied showed the response described, while for the others no changes in MR signal intensity have been observed. We attribute this variability to isoflurane anesthesia.
Figure 4.
(A) Relative signal intensity [I(contra) − I(ipsi)]/I(contra) changes (in %) for an ROI in the rat lumbar spine corresponding to L4 and L5 segments (light gray bars). The width of the bar corresponds to the measurement time of 2 min per image. Upon injection of formalin at time 0 (arrow), a sharp intensity change was observed, after which the intensity slowly declined to the baseline values. For comparison, the intensity change in a more rostral ROI corresponding to L2 and L3 segments is shown (black bars). At this level of the spinal cord almost no activation has been observed (n = 6). Values are given as mean ± SEM. (B) Time course of the licking activity in rats (n = 5) into which 50 μl of 5% formalin had been injected into the left hindpaw at time point zero. The time spent with licking the hindpaw was measured in every 5 min interval as indicated by the width of the bars. A group of animals (n = 5) served as a control and was injected with 50 μl of physiological saline instead of formalin. In these experiments licking activity was not observed at all (indicated as the black line in the interval 0–55 min).
In contrast, the paw-licking activity obtained in a group (n = 5) of freely moving conscious animals after formalin injection showed a clear biphasic curve (Fig. 4B). The onset was rapid, with the first peak occurring between 1 and 5 min after formalin injection, followed by a brief, ≈5-min-long, uneventful period. The second-phase peak reached a maximum 20–25 min after formalin injection, and decayed slowly. Full recovery occurred within 50 min. The heights of the two peaks were not significantly different. After saline injection alone there was no licking activity observed.
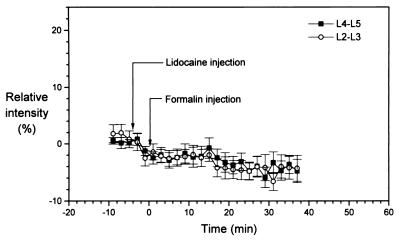
To provide additional evidence for the interrelation of the observed signal changes in the lumbar spinal cord with the peripheral noxious stimulus, a series of experiments were carried out, in which the local anesthetic lidocaine was administered prior to formalin injection. Fig. 5 illustrates that pretreatment with lidocaine (50 μl; 2%; s.c.) fully prevented the development of the signal intensity decrease on the ipsilateral side. This result was obtained on all animals pretreated with lidocaine. Furthermore, no signal changes were observed in the spinal cord images of all animals that received an injection of saline instead of formalin (control experiments).
Figure 5.
Relative signal intensity [I(contra) − I(ipsi)]/I(contra) changes (in %) in the ROI of L4–L5 and L2–L3 spinal segments in response to formalin (50 μl; 5%) injection after s.c. lidocaine treatment (50 μl; 2%). There are no significant difference between the two groups of ROI, demonstrating that lidocaine effectively suppressed the signal response caused by formalin.
DISCUSSION
The major finding of this study is that signal changes in MR images of the lumbar spinal cord of anesthetized rats after prolonged noxious stimulation with formalin are observed with sufficient temporospatial resolution by using the RARE sequence. The newly developed spinal cord resonator provided the sensitivity necessary to detect small changes in signal amplitude in the ipsilateral side of the spinal cord. The use of this novel design significantly improved the quality of spinal images as compared with previously published data (15). The intensity variation in the prestimulation images was 3%, while the signal changes observed after stimulation were of the order of 10–12%. The resonator immobilized the spinal cord, which was crucial for the difference images. Image analysis revealed that the observed signal changes were not due to in-plane motion of the animals. The data cannot exclude potential contributions from out-of-plane movements. However, it is unlikely that this type of motion would affect the results in such a highly reproducible way that signal changes always occurred at the same anatomical location.
The region displaying altered signal intensity was clearly localized in all the cases in the ipsilateral lumbar spinal cord at segments L4–L5, with involvement of the corresponding DRGs. This corresponds to the anatomical representation of the sciatic nerve, which innervates the glabrous skin of the hindpaw. Although the area affected by formalin could not be precisely estimated, we presume that the effect was localized to the calcaneal area of the sole, which represents only a relatively minor proportion of the full receptive field of the cutaneous innervation of the sciatic nerve. In this respect the extent of the spinal signal changes is fairly large. The diffuse appearance of the region may be attributed to several factors. First, limited spatial resolution, especially with respect to slice thickness (1 mm), which is substantial compared with the dimensions of the spinal cord, causes partial volume effects, leading to ill-defined boundaries of the affected region. Second, the spatial filtering process, carried out to reduce the noise in the images, may deteriorate the in-plane resolution. Nevertheless, there were no significant intensity changes on the contralateral side of the spinal cord in any of the animals. The affected region in the ipsilateral cord extended to the L3 segment in some animals, but there was no recognizable change beyond the caudal border of L5. The preventive effect of lidocaine strongly supports the fact that the spinal changes detected by MRI were specifically due to activation of primary afferents by formalin.
In human fMRI brain mapping susceptibility-weighted pulse sequences are usually applied, where the change in blood oxygenation (BOLD contrast) is reflected in a signal increase in the activated regions. In the ipsilateral lumbar spinal cord we found a signal attenuation by using the RARE sequence. Several mechanisms, about which we currently can only speculate, might contribute to the observed signal decrease. First, an increase in perfusion rates might cause a decrease of signal intensity in T2-weighted images due to signal dephasing of the moving spins in a gradient field. On the other hand it has been shown that in anesthetized cynomolgus monkeys the cerebral blood flow response to stimulation is largely suppressed (16). However, blood flow regulation in the spinal cord is different from that of the brain as some strongly vasoactive compounds are involved, so that results obtained from cerebral perfusion studies may not be readily extrapolated to our study. The release of neuropeptides (substance P, neurokinin A, and calcitonin gene-related peptide) from activated C-fibers can enhance local circulation (especially substance P, which on its own is a strong vasodilator) and also produce increased vascular leakage for a prolonged period of time (7, 17) in addition to causing neuronal hyperactivity. Indeed, after activation of C-fibers a general, sustained increase of the extrasynaptic substance P content was measured in the spinal dorsal horn (18). By contrast, a blood flow decrease in the spinal cord was measured by laser Doppler technique during local application of Spantide, a substance P antagonist (7). In comparison, the contribution of the above-mentioned vasoactive peptides in the cerebral cortex is minimal.
Nevertheless, it seems unlikely that changes in perfusion alone could account for the full extent of signal decrease observed. Alternatively, an MRI signal decrease might also arise from an increase in the total amount of deoxyhemoglobin in the tissue. Negative BOLD contrast could be the result of an increased oxygen consumption in combination with unaltered or reduced blood flow. When blood flow is sufficient to match the increased oxygen demand and fractional blood deoxyhemoglobin is not altered, a negative BOLD effect may still occur due to an increased tissue blood volume. It has been demonstrated in the monkey studies mentioned above (16) that deoxyhemoglobin remained elevated in anesthetized animals after visual stimulation. Under these circumstances a signal decrease would be expected in RARE images. However, the time course of these experiments was of the order of seconds and thus significantly shorter as compared with our study. Further experiments would be needed to address the precise mechanism(s) contributing to fMRI signal changes in the spinal cord during spinal nociceptive activation.
Due to the partial volume effects, signal changes might be attributed to altered liquor dynamics. It is, however, unlikely that this mechanism could account for the observed intensity change, as it was localized selectively in the L4–L5 segments and no change was observed on the contralateral side. Moreover motion of cerebral spinal fluid would predominantly be visible at the edges of the spinal cord because of the slice selection in the spinal canal.
The fMRI signal response largely agrees with the characteristic temporal profile described in physiological experiments (8, 10), although the absence of a biphasic pattern has not been fully understood yet. This may be due to the fact that the physiological parameters assessed by MRI do not show a biphasic response. This could be the case as spinal hyperexcitability develops after transient electrical or chemical stimulation (19, 20) and is maintained for several minutes. Indeed, it has been suggested that early central changes occur during the first phase of the spinal hyperexcitability (21). Formalin-induced hyperalgesia has been characterized as a model for both peripheral and central hyperexcitation (8). The second phase was originally described as the direct central consequence of the early firing activity of primary afferents with no further involvement from these fibers at the later stage (8). Recent evidence, however, suggests that primary afferent C-fibers show biphasic firing activity. Therefore, the second phase is at least partially peripherally driven (10). Our findings with fMRI are in good agreement with this observation, since the time course of the signal change in the spinal cord paralleled that of the DRGs.
In conclusion, we present a novel method which could be a valuable tool for the noninvasive, objective evaluation of spinal effects caused by peripheral noxious stimulation and their prevention through the application of analgesic drugs. The major advantage of the use of fMRI in studying formalin-induced hyperalgesia in the rat is that by avoiding extensive surgery and thus stress to the animal the full spatial and temporal extent of spinal changes could be revealed. Our further efforts will be to consolidate these initial data and to study the effects of systemically applied analgesic drugs on the spinal images produced by peripheral activation of formalin-induced noxious input.
ABBREVIATIONS
- MR
magnetic resonance
- MRI
MR imaging
- fMRI
functional MRI
- BOLD contrast
blood oxygen level-dependent contrast
- RARE
rapid acquisition with relaxation enhancement
- AUC
area under the curve
- DRG
dorsal root ganglion
- ROI
region of interest
Footnotes
Lee, J. H., Wike, J., Merkle, H., Fox, K., Wilcox, G. L. & Ugurbil, K., Second Annual Meeting of the Society for Magnetic Resonance, Proceedings, August 6–12, 1994, San Francisco, p. 705.
References
- 1.Kwong K K, Belliveau J W, Chesler D A, Goldberg I E, Weisskoff R M, Poncelet B P, Kennedy D N, Hoppel B E, Cohen M S, Turner R, Cheng H M, Brady T J, Rosen B R. Proc Natl Acad Sci USA. 1992;89:5675–5679. doi: 10.1073/pnas.89.12.5675. [DOI] [PMC free article] [PubMed] [Google Scholar]
- 2.Ogawa S, Tank D W, Menon R, Ellermann J M, Kim S G, Merkle H, Ugurbil K. Proc Natl Acad Sci USA. 1992;89:5951–5955. doi: 10.1073/pnas.89.13.5951. [DOI] [PMC free article] [PubMed] [Google Scholar]
- 3.Ogawa S, Lee T M, Kay A R, Tank D W. Proc Natl Acad Sci USA. 1990;87:9868–9872. doi: 10.1073/pnas.87.24.9868. [DOI] [PMC free article] [PubMed] [Google Scholar]
- 4.Hyder F, Behar K L, Martin M A, Blamire A M, Shulman R G. J Cereb Blood Flow Metab. 1994;14:649–655. doi: 10.1038/jcbfm.1994.81. [DOI] [PubMed] [Google Scholar]
- 5.Kerskens C M, Hoehn-Berlage M, Schmitz B, Busch E, Bock C, Gyngell M L, Hossmann K-A. NMR Biomed. 1996;8:20–23. doi: 10.1002/(SICI)1099-1492(199602)9:1<20::AID-NBM381>3.0.CO;2-R. [DOI] [PubMed] [Google Scholar]
- 6.Urban L, Thompson S W N, Dray A. Trends Neurosci. 1994;17:432–438. doi: 10.1016/0166-2236(94)90018-3. [DOI] [PubMed] [Google Scholar]
- 7.Freedman J, Post C, Kåhrstöm J, Öhlen A, Mollenholt P, Owman C, Alari L, Hökfelt T. Neuroscience. 1988;27:267–278. doi: 10.1016/0306-4522(88)90236-9. [DOI] [PubMed] [Google Scholar]
- 8.Dickenson A H, Sullivan A. Pain. 1987;30:349–360. doi: 10.1016/0304-3959(87)90023-6. [DOI] [PubMed] [Google Scholar]
- 9.Tjølsen A, Berge O-G, Hunskaar S, Rosland J H, Hole K. Pain. 1992;51:5–17. doi: 10.1016/0304-3959(92)90003-T. [DOI] [PubMed] [Google Scholar]
- 10.McCall W D, Tanner K D, Levine J D. Neurosci Lett. 1996;208:45–48. doi: 10.1016/0304-3940(96)12552-0. [DOI] [PubMed] [Google Scholar]
- 11.Dallel R, Raboisson P, Clavelon P, Saade M, Woda A. Pain. 1995;61:11–16. doi: 10.1016/0304-3959(94)00212-W. [DOI] [PubMed] [Google Scholar]
- 12.Alderman D W, Grant D M. J Magn Reson. 1979;36:447–451. [Google Scholar]
- 13.Hennig J, Nauerth A, Friedburg H. Magn Reson Med. 1986;3:823–833. doi: 10.1002/mrm.1910030602. [DOI] [PubMed] [Google Scholar]
- 14.Haase A. Magn Reson Med. 1990;13:77–89. doi: 10.1002/mrm.1910130109. [DOI] [PubMed] [Google Scholar]
- 15.Collins, J. G., Kennan, R., Kaneko, M. & Tsukamoto, T. (1994) Soc. Neurosci. Abstr. 20 (Part 1), p. 306.
- 16.Grinvald A, Frostig R D, Siegel R M, Bartfeld E. Proc Natl Acad Sci USA. 1991;88:11559–11563. doi: 10.1073/pnas.88.24.11559. [DOI] [PMC free article] [PubMed] [Google Scholar]
- 17.Schaible H-G, Jarrott B, Hope P J, Duggan A W. Brain Res. 1990;529:214–223. doi: 10.1016/0006-8993(90)90830-5. [DOI] [PubMed] [Google Scholar]
- 18.Duggan A W. In: Progress in Brain Research: Neuropeptides in the Spinal Cord. Nyberg F, Sharma H S, Wiesenfeld-Hallin Z, editors. Vol. 104. Amsterdam: Elsevier; 1995. pp. 198–223. [Google Scholar]
- 19.Jeftinija S, Urban L. J Neurophysiol. 1994;71:216–228. doi: 10.1152/jn.1994.71.1.216. [DOI] [PubMed] [Google Scholar]
- 20.Thompson S W N, Woolf C J, Sivilotti L G. J Neurophysiol. 1993;69:2116–2128. doi: 10.1152/jn.1993.69.6.2116. [DOI] [PubMed] [Google Scholar]
- 21.Coderre T J, Vaccarino A L, Melzack R. Brain Res. 1990;535:155–158. doi: 10.1016/0006-8993(90)91835-5. [DOI] [PubMed] [Google Scholar]


