Abstract
Background
This study compared the effects of two commonly used resuscitation fluids on whole blood coagulation.
Methods
1000 ml of two resuscitation fluids each (saline and Gelofusine) were given to eight volunteers in a crossover design with a 2‐week washout period. The effect on whole blood coagulation was assessed using the Sonoclot analyzer, a conventional coagulation screen and coagulation markers.
Results
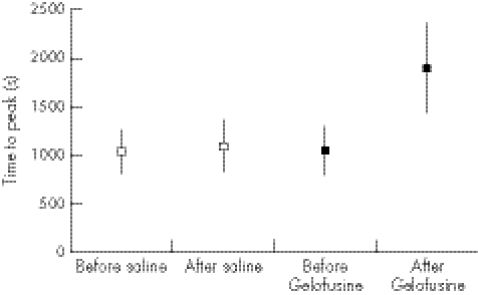
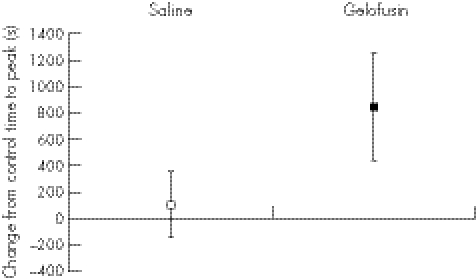
No significant effect was found on whole blood coagulation by giving saline (time to peak clot increased by a mean of 106 s; (95% confidence interval (CI) –140 to 354), whereas Gelofusine delayed the time to peak by a mean of 845 s (95% CI 435 to 1255). By contrast, there was no change in the conventional coagulation screen with either fluid.
Conclusion
It was concluded that some resuscitation fluids have an effect on clot formation that is not shown by the conventional coagulation screen, but is disclosed only if the whole coagulation process is studied.
There is an ongoing controversy about the relative merits of different types of resuscitation fluid.1 In this discussion, the effects of different fluids on coagulation is rarely mentioned, despite coagulopathy often being a problem after large‐volume fluid resuscitation. The origin of this coagulopathy is multifactorial,2 and it is usually assumed that resuscitation fluids contribute by cooling the patient and diluting clotting factors. However, there may also be a direct effect owing to an interaction between resuscitation fluid molecules and the coagulation system.
Using whole blood coagulation analysis, we have already found a wide variation in the in vitro effects of resuscitation fluids on coagulation, with no simple crystalloid or colloid difference.3 We know that in vitro 0.9% saline has a procoagulant effect at lower dilutions and an anticoagulant effect at higher dilutions, and that Gelofusine has a marked anticoagulant effect.4 If this direct effect of a resuscitation fluid on coagulation was also present in vivo, it would influence the choice of fluid given to the bleeding patient in emergency care. This study compares the effects of saline and Gelofusine on whole blood coagulation in human volunteers.
Participants and methods
Approval was obtained from the local research ethics committee. The study was carried out in a teaching hospital with a particular interest in trauma management. Advertising posters and personal contacts were used to obtain the volunteers for the study.
Coagulation was evaluated using the Sonoclot Coagulation & Platelet Function Analyser5 (Sonoclot Analyzer, Scienco, Colorado, USA), a viscoelastic test of whole blood coagulation closely related to the thromboelastogram.6,7 The Sonoclot is well validated8 and measures the change in impedance created by the developing blood clot as a small probe is vibrated at an ultrasonic frequency in a coagulating blood sample9 at 37°C.
The parameters measured were (1) the activated clotting time (ACT), which is the time to first fibrin formation and represents the initiation phase of clot formation, being similar to the conventional coagulation screen (activated partial thromboplastin time (APTT)); (2) the clot rate, which is the initial slope of the graph and is a measure of the rate of fibrin formation; and (3) the time to peak, which is the overall time taken for the clot to form and achieve maximum clot weight (when there is maximum impedance of probe vibration in the blood sample). The time to peak was used as the primary outcome variable, with sample sizes calculated assuming a minimum clinically significant change of 300 s (derived from normal values10,11 and the use of the Sonoclot in haemodialysis12) with a power of 80% and an α value of 0.05. Changes from controls were compared using a paired t test. Each volunteer had an 18‐G cannula placed in an arm. 5 ml of blood was withdrawn and discarded, and then a 5 ml sample was taken (the “before” or “control” sample). The fluid infusion was then given over 30 min. At the end of the infusion, a further 10 ml of blood was withdrawn from the cannula and discarded. The second 5‐ml sample (the “after” or “test” sample) was then taken. The standard Sonoclot technique using cellite activation cuvettes was used at a temperature of 37°C (http://www.scienco.com/sonooverview.html).
Eight human volunteers, who gave informed consent, were infused with 1000 ml of 0.9% saline or 1000 ml of Gelofusine (B Braun, Melsungen, Germany) in a crossover design, with a 2‐week washout period between infusions. Blood samples were taken immediately before and after the 30‐min fluid infusions. The initial (pre‐infusion) sample acted as a control. Haematocrit level was measured before and after each infusion to assess the intravascular dilution achieved. Both a Sonoclot profile and a conventional coagulation profile—international normalised ratio (INR), APTT and thrombin time—were measured. Assays were also made of the levels of D‐dimer (AGEN Gold, New Jersey, USA), tissue factor antigen (American Diagnostica, Connecticut USA), antithrombin III activity (Chromostrate ATIII, Organon Teknika, UK), von‐Willebrand factor antigen (Laurell electroimmunoassay using antibodies supplied by Dako, California, USA) and fibrinogen (Clauss method).
Results
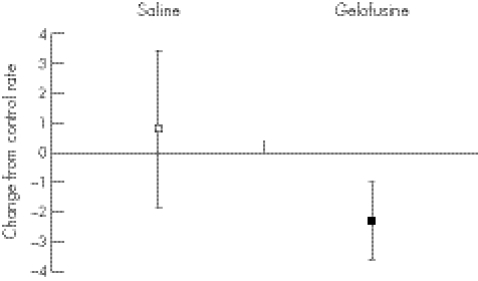
Gelofusine gave a greater dilution of the volunteer's intravascular space than saline, with a mean drop in haemoglobin concentration of 2.35 g/dl (95% confidence interval (CI) 2.05 to 2.6) compared with 1.25 g/dl (95% CI 1.03 to 1.5) after saline infusion. The changes in coagulation parameters are presented in two ways. Figures 1–3 show the blood clotting in the volunteers before and after the infusion of resuscitation fluid. Figures 4–6 show the difference between the control (before infusion) and test (after infusion) measurements, using each volunteer as his or her own control.
Figure 1 Time to peak before and after infusion of normal Saline or Gelofusine (mean and 95%CI).
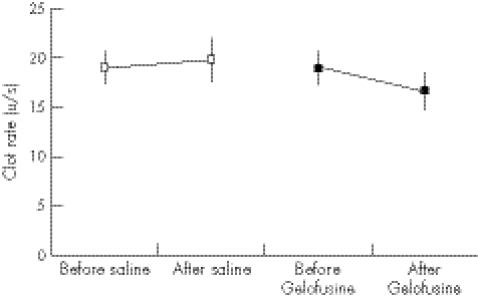
Figure 2 Clot rate before and after infusion of normal saline or Gelofusine (mean and 95% CI).
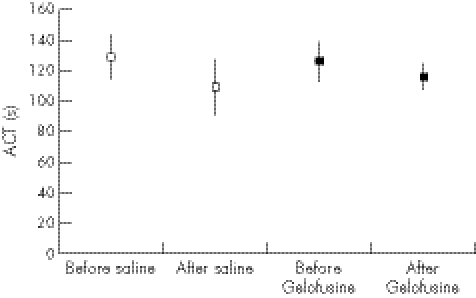
Figure 3 Sonoclot activated clotting time (ACT) before and after infusion of normal saline or gelofusine (mean and 95% CI).
Figure 4 Change in time to peak in human volunteers infused with 1000 ml of 0.9% saline or Gelofusine (mean and 95% CI).
Figure 5 Change in clot rate in human volunteers infused with 1000 ml of 0.9% saline or Gelofusine (mean and 95% CI).
Figure 6 Change in activated clotting time (ACT) in human volunteers infused with 1000 ml of 0.9% saline or Gelofusine (mean and 95% CI).
The relatively small dose of Gelofusine given to the volunteers gave a significant impairment of coagulation as measured by the time to peak (figs 1, 3), with no overlap of the 95% CI (p = 0.032). A strong trend was found to a slower clot rate with Gelofusine (figs 2, 5), but no difference in the ACT (figs 3, 6).
Table 1 shows the percentage changes in each of the measured parameters, and table 2 the absolute changes. The most noticeable change was again the increase in time to peak after infusion of Gelofusine. An increasing trend was observed in tissue factor in the Gelofusine group, but no other patterns were seen—although the study was powered to show only a relatively large difference (as a large difference was expected in the primary outcome measure of time to peak). It was also striking that the conventional (plasma‐based) coagulation studies did not show the anticoagulant effect seen in the Sonoclot profile, with either type of fluid changing the INR, APTT or thromboplastin time. This fits with the Sonoclot data, where the ACT (which is a measure comparable to the conventional coagulation screen) was not affected by the type of fluid infused.
Table 1 Percentage changes in blood clotting in normal volunteers infused with 1000 ml of 0.9% saline or Gelofusine.
| Percentage change from control | ||
|---|---|---|
| Saline | Gelofusine | |
| Sonoclot time to peak | −3% (−40% to +34%) | +96% (+42% to +151%) |
| Sonoclot clot rate | 6% (−9% to 21%) | −12% (−19% to –4%) |
| Sonoclot ACT | −15% (−6% to −25%) | −6% (−14% to 2%) |
| INR | +1% (−1% to +4%) | +4% (−1% to +9%) |
| APTT | −2% (−6% to +3%) | +1% (−5% to +6%) |
| TT | 0% (−5% to +5%) | +3% (−2% to +8%) |
| D‐dimer (ng/ml) | +51% (−48% to +150%) | +41% (−28% to +111%) |
| Tissue factor ag (pg/ml) | −1% (−7% to +5%) | +11% (−10% to +32%) |
| Antithrombin III (IU/ml) | 0% (−7% to +6%) | +1% (−11% to +13%) |
| vWF ag (%) | −1% (−3% to +1%) | +4% (−6% to +13%) |
| Fibrinogen (mg/dl) | −4% (−12% to +4%) | −1% (−20% to +18%) |
ACT, activated clotting time; ag, antigen; APTT, activated partial thromboplastin time; INR, international normalised ratio; TT, thromboplastin time; vWF ag; von‐Willebrand factor antigen.
Table 2 Changes in coagulation parameters in normal volunteers infused with 1000 ml of 0.9% saline or Gelofusine.
| Change from control | ||
|---|---|---|
| Saline | Gelofusine | |
| INR | 0.01 (−0.02 to 0.04) | 0.04 (−0.01 to 0.09) |
| APTT | −0.54 (−1.8 to 0.73) | 0.17 (−1.42 to 1.75) |
| TT | −0.03 (−0.71 to 0.65) | 0.41 (−0.26 to 1.75) |
| D‐dimer (ng/ml) | 0.6 (−2.0 to 3.2) | 1.8 (−3.3 to 6.9) |
| Tissue factor ag (pg/ml) | −0.3 (−10.8 to 10.3) | 15 (−16.8 to 46.8) |
| Antithrombin III (IU/ml) | −1.1 (−7.2 to 5.0) | −1.1 (−12.4 to 10.2) |
| vWF ag (%) | −0.5 (−1.6 to 0.7) | 3.3 (−4.3 to 10.8) |
| Fibrinogen (mg/dl) | −11.5 (−28.8 to 5.7) | −9.1 (−46.5 to 28.3) |
ACT, activated clotting time; ag, antigen; APTT, activated partial thromboplastin time; INR, international normalised ratio; TT, thromboplastin time; vWF ag; von‐Willebrand factor antigen.
Discussion
The results of this study suggest the in vivo changes in coagulation mirror and those found in vitro3; however, we do not yet know if the effects found are important in patients. Interestingly, there was no change in the ACT or the standard coagulation screen (INR, thromboplastin time and APTT) in this in vivo study, despite a marked change in the whole blood coagulation profile (the time to peak clot weight). The same effect had been seen in our previous in vitro work,3 where the initiation of coagulation (as measured by the ACT) was normal, yet there was still a marked change in the quality of the clot formed, as measured by the Sonoclot trace.
The ACT is a measure of the time to initiation of fibrin formation in the plasma phase of coagulation; this is the part of coagulation measured by the coagulation screen usually used in clinical care (INR, thromboplastin time and APTT). These tests stop at a relatively early stage of clot formation (the end of the initiation phase, which corresponds to the creation of the first fibrin strands). At this stage, only about 4% of the total thrombin is generated.13,14 The conventional coagulation screen depends on this initial plasma‐based part of coagulation and does not evaluate the later cellular part of the coagulation process, where most of the thrombin is generated and platelet interactions are important.8
In this study, the greatest change with Gelofusine was in the time to peak on the Sonoclot trace. This measure has previously been related to platelet function, fibrinogen levels, and the interaction between platelets and thrombin,15 and represents the cellular or propagation phase of coagulation. This is the time that many pharmacological agents (such as anti‐thrombotics) or blood abnormalities (such as haemophilia) have their most dramatic effect13; so it may be that the Sonoclot, which analyses the whole coagulation process, picks up an effect that is missed by the conventional coagulation screen.
This may be the reason why an impairment of coagulation by Gelofusine is not noticed in routine clinical care, as clinicians are not carrying out a test that shows up the potentially marked iatrogenic effect. Changing to a whole blood functional analysis (such as thromboelastogram or Sonoclot) might allow clinicians to appreciate these abnormalities, and this strategy has been suggested in surgical haemorrhage8,16,17,18 and for procedures under heparinisation such as haemodialysis.12
A possible rise in tissue factor in the volunteers given Gelofusine is interesting. The increase was too rapid to have been caused by up regulation of tissue factor synthesis, and therefore probably represents release of preformed tissue factor from sites such as circulating microparticles or endothelial cells. The cause of the tissue factor rise is uncertain. Gelofusine, which is based on bovine collagen, is known to cause anaphylactic reactions19 and immune system activation; hence the rise in tissue factor could be associated with an inflammatory response. The role of circulating tissue factor in haemostasis and thrombosis is controversial, with uncertainty about the relative contributions of extravascular cell surface‐bound, circulating microparticle and soluble tissue factor.20 The mechanism by which resuscitation fluids influence the coagulation system requires further investigation.
The clinical significance of the results is uncertain. In a recent meta‐analysis of survival after colloid or crystalloid resuscitation, survival seemed to be worse after the colloid resuscitation.21 This effect was seen particularly in the subgroup of injured patients,22 raising the possibility that it could be coagulation related.
The changes found in human volunteers after Gelofusine or saline infusion seem to mirror the changes seen in an in vitro analysis. These results also suggest that important changes in coagulation caused by a resuscitation fluid may be unrecognised if clinicians rely on the conventional coagulation screen.
Acknowledgements
This work was supported by the Anthony Hopkins Memorial Fund, and Barts and the London Charitable Foundation. The Sonoclot Analyzer was loaned by Scienco.
Abbreviations
ACT - activated clotting time
APTT - activated partial thromboplastin time
INR - international normalised ratio
Footnotes
Competing interests: None declared.
References
- 1.Alderson P, Schierhout G, Roberts I.et al Colloids versus crystalloids for fluid resuscitation in critically ill patients. Cochrane Library. Oxford: Update Software, 2002 [DOI] [PubMed]
- 2.Martinowitz U, Kenet G, Segal E.et al Recombinant activated factor VII for adjunctive haemorrhage control in trauma. J Trauma 200151431–438. [DOI] [PubMed] [Google Scholar]
- 3.Coats T J, Brazil E V, Heron M. The effects of commonly used resuscitation fluids on whole blood coagulation. Emer Med J 200623546–549. [DOI] [PMC free article] [PubMed] [Google Scholar]
- 4.Brazil E V, Coats T J. Sonoclot coagulation analysis of in‐vitro haemodilution with resuscitation solutions. J R Soc Med 200093507–510. [DOI] [PMC free article] [PubMed] [Google Scholar]
- 5.Hett D A, Walker D, Pilkington S N.et al Sonoclot analysis. Br J Anaesth 199575771–776. [DOI] [PubMed] [Google Scholar]
- 6.Mallett S V, Cox D J A. Thromboelastography. Br J Anaesth 199269307–313. [DOI] [PubMed] [Google Scholar]
- 7.Shih R, Cherng Y, Chao A.et al Prediction of bleeding diathesis in patients undergoing cardiopulmonary bypass during cardiac surgery: viscoelastic measures versus routine coagulation test. Acta Anaesthesiol Sin 199735133–139. [PubMed] [Google Scholar]
- 8.Tuman K.et al Comparison of viscoelastic measures of coagulation after cardio‐pulmonary bypass. Anaesth Analg 19896969–75. [PubMed] [Google Scholar]
- 9.Liszka‐Hackzell J J, Ekback G. Analysis of the information content in Sonoclot data and reconstruction of coagulation test variables. J Med Syst 200226 [DOI] [PubMed] [Google Scholar]
- 10.Pivalizza E G, Pivalizza P J, Kee S.et al Sonoclot analysis in healthy children. Anaesthesia Analgesia 200192904–906. [DOI] [PubMed] [Google Scholar]
- 11.Horlocker T, Schroeder D. Effect of age, gender, and platelet count on Sonoclot coagulation analysis in patients undergoing orthopaedic operations. Mayo Clin Proc 199772214–219. [DOI] [PubMed] [Google Scholar]
- 12.Furuhashi M, Ura N, Hasegawa K.et al Sonoclot coagulation analysis: new bedside monitoring for determination of the appropriate heparin dose during haemodialysis. Nephrol Dial Transplant 2002171457–1462. [DOI] [PubMed] [Google Scholar]
- 13.Mann K G, Butenas S, Brumme l K. The dynamics of thrombin formation. Arterioscler Thromb Vasc Biol 20032317–25. [DOI] [PubMed] [Google Scholar]
- 14.Brummel K E, Paradis S G, Butenas S.et al Thrombin functions during tissue factor‐induced blood coagulation. Blood 2002100148–153. [DOI] [PubMed] [Google Scholar]
- 15.Miyashita T, Kuro M. Evaluation of platelet function by sonoclot analysis compared with other hemostatic variables in cardiac surgery. Anesth Analg 1998871228–1233. [DOI] [PubMed] [Google Scholar]
- 16.Ekback G, Schott U, Axelsson K.et al Perioperative autotransfusion and functional coagulation analysis in total hip replacement. Acta Anaesthesiol Scand 199539390–395. [DOI] [PubMed] [Google Scholar]
- 17.Chapin J, Becker G, Hurlbert J. Comparison of thromboelastograph and Sonoclot coagulation analyser for assessing coagulation status during orthotopic liver transplantation. Transplant Proc 19892135–39. [PubMed] [Google Scholar]
- 18.Nuttall G A, Oliver W C, Ereth M H.et al Coagulation tests predict bleeding after cardiopulmonary bypass. J Cardiothorac Vasc Anesth 199711815–823. [DOI] [PubMed] [Google Scholar]
- 19.Russell W, Fenwick D. Anaphylaxis to Haemaccel and cross reactivity to Gelofusin. Anaesth Inten Care 200230418–483. [DOI] [PubMed] [Google Scholar]
- 20.Steffel J, Lüscher T, Tanner F. Tissue factor in cardiovascular diseases. Molecular mechanisms and clinical implications. Circulation 2006113722–731. [DOI] [PubMed] [Google Scholar]
- 21.Bunn F, Alderson P, Hawkins V. Colloid solutions for fluid resuscitation . Cochrane Library. Oxford: Update Software, 2002
- 22.Choi P, Yip G, Quinonez L.et al Crystalloids vs colloids in fluid resuscitation: a systematic review. Crit Care Med 199927200–210. [DOI] [PubMed] [Google Scholar]


