

Abstract
The increasing pressure on health resources has led to the emergence of risk assessment as an essential tool in the management of cardiovascular disease (CVD). Concern exists regarding the validity of their generalization to all populations. Existing risk scoring models do not incorporate emerging ‘novel’ risk factors. In this context, the aim of the study was to examine the relevance of British, European, and Framingham predictive CVD risk scores to the asymptomatic high risk Indian population. Blood samples drawn from the participants were analyzed for various ‘traditional’ and ‘novel’ biomarkers, and their CVD risk factor profiling was also done. The Framingham model defined only 5% of the study cohort to be at high risk, which appears to be an underestimation of CVD risk in this genetically predisposed population. These subjects at high risk had significantly elevated levels of lipid, pro-inflammatory, pro-thrombotic, and serological markers. It is more relevant to develop risk predictive scores for application to the Indian population. This study substantiates the argument that alternative approaches to risk stratification are required in order to make them more adaptable and applicable to different populations with varying risk factor and disease patterns.
Keywords: atherosclerosis, risk factors, risk score, Framingham, plasma biomarkers
Introduction
Atherosclerotic cardiovascular disease (CVD) resulted in 17.5 million deaths in 2005, representing 30% of all the global deaths (WHO 2005). Despite major advances in treatment of ischemic heart disease (IHD) patients, a large number of victims of the disease who are apparently healthy die suddenly without prior symptoms. Available screening and diagnostic methods are insufficient to identify the victims before the event occurs. The first detectable clinical manifestation of atherosclerosis is often a clinical event: a stroke or myocardial infarction (MI). Atherosclerosis, being a chronic process, undergoes a series of changes in the arterial walls before the clinical endpoints set in. This includes endothelial damage, lipid infiltration, followed by intimal thickening, platelet adherence, smooth muscle cell proliferation and plaque formation. Rupture of the plaque is the final event that results in a clinical endpoint (Ross 1993, 1999).
The World Health Organization has projected that CVD will become the greatest cause of morbidity and mortality in the world by the year 2015 (WHO 2000); and it is expected that Indians would be the most affected amongst all ethnic populations (Murray and Lopez 1996). Primary prevention in terms of risk stratification is pivotal in order to accurately determine and intervene early in the natural history of disease. One goal in risk factor research is to move ever closer to the proximal direct causes of disease (Stampfer et al 2004). A complementary goal is to improve prediction to identify individuals who are more likely to develop CVD and who therefore should be receiving more intensive interventions where possible. The focus is on maximizing the benefit/cost ratio of treatments (Stampfer et al 2004). To this effect, the risk assessment defined by the Framingham Study researchers was a great leap forward (Wilson et al 1998). This lead to the development of multiple predictive CVD risk score calculators, such as the Munster Heart Study (PROCAM) Risk Score (Greenland et al 2001), Sheffield Coronary Risk Tables (Ramsay et al 1996), National Heart Foundation of New Zealand Guidelines (Greenland et al 2001), Dundee Coronary Risk Disc (Greenland et al 2001), and the SCORE project (Conroy et al 2003) among others. While there is some evidence that risk estimates based on Framingham data generalize well to other populations in the US (D’Agostino et al 2001) and in Europe (Haq et al 2001), many studies in the US and Europe have shown that Framingham risk factors overestimate the risk of CAD in Hispanics and northern Europeans, some Asians (Japanese, Chinese) (Cappuccio et al 2002; Thomsen et al 2002; Hense et al 2003). A recent study on the Chinese cohort found the Framingham model overestimated the CAD risk (Liu et al 2004; Asia Pacific Cohort Studies Collaboration 2007). Similarly, the application of the Framingham risk score on the Danish population lead to an overestimation of coronary risk (Thomsen et al 2002; de Visser et al 2003). There are also many studies which show underestimation of CAD risk by the Framingham model (Brindle et al 2005; Reissigova and Zvarova 2007). Thus, it is evident that prevalence of risk varies between ethnic groups and thus there is a need for population specific risk estimations.
Although risk-scoring systems that evaluate ‘traditional’ risk factors such as lipids, hypertension, diabetes, and smoking greatly improve risk prediction, multiple studies demonstrate that 20% to 25% of all future events occur in individuals with only 1 of these factors (Ridker et al 2004). Moreover, the prevalence of traditional risk factors is almost as high in those without disease as in affected individuals (Ridker et al 2004). There are many emerging risk factors that were not considered in these risk computations. With evolving understanding of the pathophysiology of CAD, it is more than likely that other risk factors may greatly influence an individual’s overall risk burden (Heman et al 2007). Indeed, a series of candidate biomarkers reflecting inflammation, hemostasis, thrombosis, and oxidative stress have been evaluated as potential clinical tools in an effort to improve risk prediction (Ridker et al 2004).
India is now in the middle of a CAD epidemic. The CAD rates among Asian Indians worldwide are 50% to 400% higher than people of other ethnic origin and at least 4 times that of Caucasians (Enas and Senthilkumar 2001). It appears that at a given level of any single or combination of conventional risk factors, the CAD rates among Asian Indians are at least double that of Caucasians. Asian Indians, compared with other subpopulations, are at more risk for developing CAD and Diabetes at a younger age (approximately 10 years) (see www.aapio.org; McKeigue et al 1989, 1991). Observational studies from Singapore, Malaysia, UK, and US have shown that differences in age-standardized mortality in Asian Indians is highest in patients under 40 yrs of age compared with other populations (Lee et al 2001). The low prevalence of standard risk factors in Indians seems to be negated by a higher prevalence of several emerging risk factors (see www.aapio.org; Anand et al 2000). Therefore, a more aggressive approach to prevention and treatment of both conventional and emerging risk factors is warranted in the Asian Indians (see www.aapio.org; Enas and Senthilkumar 2001). No predictive CVD risk score is currently available for the Indians considered to be a high-risk population. In this context the aim of this study was: 1. To apply three different ten year predictive CVD risk scoring systems to a high-risk cohort of Asian Indian families with premature onset of coronary artery disease and to define their quantitative risk; 2. To compare CVD risk prevalence between the different systems; 3. To assess differences in risk factors if any, between subjects that were categorized as high risk and low risk for CVD, and lastly; 4. To evaluate the association of ‘novel’ plasma biomarkers to the calculated risk scores.
Materials and methods
The current study was conducted on a cohort enrolled into the Indian Atherosclerosis Research Study (IARS), by the Thrombosis Research Institute-India (TRI-India). The IARS is an ongoing family based genetic epidemiological study, with an aim to investigate the genetic factors associated with CAD, as also their interaction with traditional risk factors in a cohort of Asian Indian population in their home country. The families in the IARS were enrolled from two cities – Bangalore in South India and Mumbai in Western India. The recruitment for this particular study was from March 2003–July 2005. The subjects were ascertained through a proband (males ≤60 years; females ≤65 years at onset of CAD) admitted to Narayana Hrudayalaya, a multi-specialty hospital and other tertiary care hospitals in Bangalore and to the Asian Heart Institute in Mumbai for undergoing treatment for CAD and its complications. Only probands with a positive family history of coronary disease or CVD were enrolled into the study. A detailed pedigree of the families of each proband was drawn and their family members (both CVD affected and unaffected) were subsequently enrolled into the study, provided they were 18 years or above in age at the time of recruitment. None of the probands or family members had concomitant or past major illness such as cancer, cardiomyopathy, rheumatic heart disease, liver or renal disease or concomitant infection. In total, five hundred and thirty families comprising of 2316 individuals, 1355 males and 961 females were enrolled, with a mean of 4.37 individuals per family.
Case record form
A detailed case record form containing information on demographics, socio economic status, medical history of diabetes, hypertension, and CVD was recorded for all the subjects. A general physical examination along with anthropometrical measures and vital parameters was also conducted for all participants in this study. Relevant information was obtained by personal interviews and through medical records available with the subjects and/or from the hospital records. The prevalence of diabetes, hypertension, and CVD was ascertained based on self-report of physician’s diagnosis and/or use of prescription medications along with medical records of therapeutics. All participants gave their written informed consent to participate in the study that was approved by the local Ethics Committee.
Laboratory assays
Venous blood was collected in evacuated tubes after an overnight fast of 12 to 14 hours (Vacuette®), Greiner Bio-One GmbH, Vienna, Austria). Serum, EDTA and Citrate plasma samples were separated by centrifugation within 2 hours of sampling and aliquots were preserved at −80 °C until analysis. Fasting venous blood sugar was assayed using a Glucometer (Bayer Diagnostics) for all participants. Serum TG was estimated using reagents, standards and controls from Randox Laboratories Ltd., Antrim, UK. Estimation of high density lipoprotein-cholesterol (HDL-C) levels was carried out by the Phosphotungstate method using precipitating agents and buffer from Bayer Diagnostics, control from Randox Labs, and standards from Dade-Behring Limited, UK. The Standards, reagents and controls for measuring total cholesterol (TC) and Lp (a) were procured from Randox Laboratories. ApoA1, ApoB100 (Orion diagnostics), Fibrinogen, FVII (Instrumentation Laboratories), and high sensitivity C-reactive protein (hsCRP) (Roche Diagnostics). Levels of oxidized-low density lipoprotein (LDL) (Mercodia), PAI-1 (Diagnostoica Stago), CRP (IBL), interleukin (IL)-6, sICAM, P-selectin, adiponectin (R&D Systems), and Leptin (Bioline) were assayed by ELISA. The lipid assays were carried out on Cobas-Fara II Clinical Chemistry Auto analyzer (F. Hoffman La Roche Ltd., Basel, Switzerland). LDL was calculated using Friedwald’s formula in all samples with a TG <400 mg/dl. The coagulation parameters were analyzed on ACL 300 (IL systems, Milano, Italy). The hsCRP was assayed by the Latex method on the Cobas-Fara II analyser. The serological assays were ELISA-based. The CMV kits were procured from Adaltis (Italy), C.pneumoniae and HSV1 kits from Calbiotech (USA) and Helicobacter pylori kits from Medical Biological Services (Italy). ELISA-based HSP 60 and 70 were assayed with kits from Stressgen Biotechnologies (UK). Antibodies to HSP 65 were measured by in house ELISA.
CVD risk assessment
Risk score computations were based on estimates for the occurrence of fatal and non-fatal CVD within 10 years for all systems. Subjects with diagnosed CHD have a 20% 10-year risk for developing future cardiac events including acute myocardial infarction and cardiac death and thus are at high risk (Cobb et al 2003). Hence, risk scores were calculated for only the CVD-unaffected individuals in our cohort. Three different risk calculation tools along with their subsets, representing some of the most widely used tools and a spectrum of different formats (risk chart or electronic calculator), were selected for risk stratification. The tools were the Framingham risk score (a paper chart) (Wilson et al 1998), the Joint British societies’ [BHS/BHA/BCS] recommendations (1998) on the prevention of CHD in clinical practice (a computer program) and the SCORE project estimations (chart) developed for risk scoring in the clinical management of CVD in European clinical practice (Conroy et al 2003). The risks obtained with each of the tools in accordance to published instructions on their use were divided into High risk (≥20%), Intermediate risk (10%–<20%), and Low risk (<10%). The nearest equivalent risk value was taken as the risk score from each scoring system. Listed below are the variables used for risk score computation by the different models used:
Framingham Risk Score: Gender, age, total cholesterol (TC), HDL, systolic blood pressure (SBP), diastolic blood pressure (DBP), diabetes mellitus (DM), and smoking.
The Joint British Cardiac Society (BCS)/British Hypertension Society (BHS)/British Hyperlipidemia Association (BHA) Risk Score: Gender, age, TC, HDL, SBP, DBP, DM, Smoking, ECG-LVH if available.
The European SCORE: Gender, age, TC, TC/HDL, SBP and smoking. The SCORE project has separate charts based on TC and TC/HDL, as also ones for high risk (Denmark, Finland, Norway) and low risk (Belgium, Italy, Spain) regions of Europe. We used all the above charts for computation.
Prevalence of metabolic syndrome amongst the cohort was assessed on the basis of the 2001 NCEP-ATP III (National Cholesterol Education Program – Adult Treatment Panel III) guidelines, wherein any three of the following traits in the same individual meet the criteria for the metabolic syndrome: abdominal obesity–waist circumference >102 cm (40 in) in men; >88 cm (35 in) in women; serum triglycerides ≥150 mg/dL (1.7 mmol/L); HDL-C ≤40 mg/dl in men (1.03 mmol/L); ≤50 mg/dl (1.29 mmol/L) in women; blood pressure of ≥130/85 mm Hg; fasting blood glucose ≥110 mg/dL (6.1 mmol/L).
Statistical analysis
The results are expressed as mean ± standard deviation for all continuous variables. Pearson’s partial correlation was carried out to investigate the inter-relationship amongst the various risk score calculating tools after adjustment for gender and age. Chi Square test with Yates correction was utilized to analyze the differences in the prevalence of high risk subjects as identified using the various risk score calculators. While the mean levels for the various phenotypes were calculated from the observed data, phenotypes that didn’t show normal distribution were log-transformed before performing statistical analyses. Independent samples Student T-test was employed to evaluate the difference in the means of various phenotypes between those at high risk and low risk for CVD as calculated by the Framingham risk score charts. For statistical comparison of the continuous variables, ANCOVA was used with adjustment for age, sex and BMI. A nominal two-sided p-value <0.05 was considered significant. All of the above statistical tests were computed on SPSS v10 software.
Results
Five hundred and thirty one families comprising of 171 nuclear and 337 extended families were recruited in the IARS. These families yielded 2313 individuals with 774 (632 males and 142 females) CVD affected and 1542 (723 males and 819 females) unaffected people with regard to CVD. The mean age at onset of CVD of the affected people was 50.3 ± 8.4 years for males and 53 ± 8.8 for females respectively, whilst the mean age at recruitment of unaffected subjects into IARS was 37.2 ± 14 years for males and 43.2 ± 13.7 years for females. 1285 of the unaffected subjects had a family history of premature onset CVD.
Risk scores were calculated for the 1542 unaffected individuals applying:
Framingham risk charts for males and females
Low risk Framingham charts for the 2 sexes.
The Joint British Societies’ SBP based CHD risk score.
The Joint British Societies’ DBP based CHD risk score.
The Joint British Societies’ SBP based Stroke risk score.
The Joint British Societies’ DBP based Stroke risk score.
SCORE for high risk European countries based on TC.
SCORE for high risk European countries based on TC/HDL.
SCORE for low risk European countries based on TC.
SCORE for low risk European countries based on TC/HDL.
(All the risk scoring systems are denoted by the preceding alphabets mentioned above).
All the above Risk scores displayed a statistically significant correlation with one another (p = 0.000) due to near common variables used in their computation. Most of the subjects are defined to be at low risk for CHD in the next 10 years as is evident from the Table 1 with the Framingham (A), Joint British Societies’ CHD scores (C and D) and European SCORE for high risk regions (G and H). Only the Framingham (A) and the joint British Societies’ (C and D) CHD risk scoring systems define 5.32%, 3.7%, and 4.41% of the cohort to be at high risk and 14.85%, 12.78%, and 13.42% of people respectively, to be at intermediate risk for CVD in the forthcoming 10 years.
Table 1A.
Risk score computations
| Total unaffected | 1542 | |||||
|---|---|---|---|---|---|---|
| Risk scoring tools | High risk (≥ 20%) | Intermediate risk (10%–<20%) | Low risk (<10%) | |||
| N | % | N | % | N | % | |
| A | 82 | 5.32 | 229 | 14.85 | 1231 | 79.83 |
| B | 0 | 0 | 33 | 2.14 | 1057 | 68.55 |
| C | 57 | 3.7 | 197 | 12.78 | 1267 | 82.17 |
| D | 68 | 4.41 | 207 | 13.42 | 1246 | 80.8 |
| E | 0 | 0 | 10 | 0.65 | 1511 | 98 |
| F | 2 | 0.13 | 9 | 0.58 | 1510 | 97.92 |
| G | 1 | 0.06 | 12 | 0.78 | 1513 | 98.12 |
| H | 0 | 0 | 1 | 0.06 | 1525 | 98.9 |
| I | 4 | 0.26 | 17 | 1.1 | 1505 | 97.6 |
| J | 1 | 0.06 | 5 | 0.32 | 1520 | 98.57 |
The Framingham score defines significantly higher number of people at high risk when compared with all the other risk scoring tools used (Table 1B) and hence has been utilized for all further analysis. Of the high risk subjects defined by Framingham charts 61% are males as against 39% females. The Joint British Societies’ systems also define 82% and 75% males amongst the high risk subjects (Figure 2A). The gender distribution of people defined at intermediate risk by all the scoring systems was similar (Figure 2B). More women than men are found to be at low risk for CVD by all the risk scoring tools (Figure 2C). In males, age related increase of CHD risk is noted across all the above depicted systems (Figure 1A). A similar trend is witnessed amongst the females being significantly lower than the male cohort in each of the corresponding age groups (Figure 1B).
Table 1B.
Significant high risk categorization
| Risk score tool | Chi square | p |
|---|---|---|
| A vs C | 4.339 | 0.0372 |
| A vs D | 1.184 | 0.2765 |
| D vs C | 0.8338 | 0.3612 |
| A vs G | 79.241 | <0.0001 |
| A vs H | 70.92 | <0.0001 |
| D vs H | 56.443 | <0.0001 |
Figures 2.
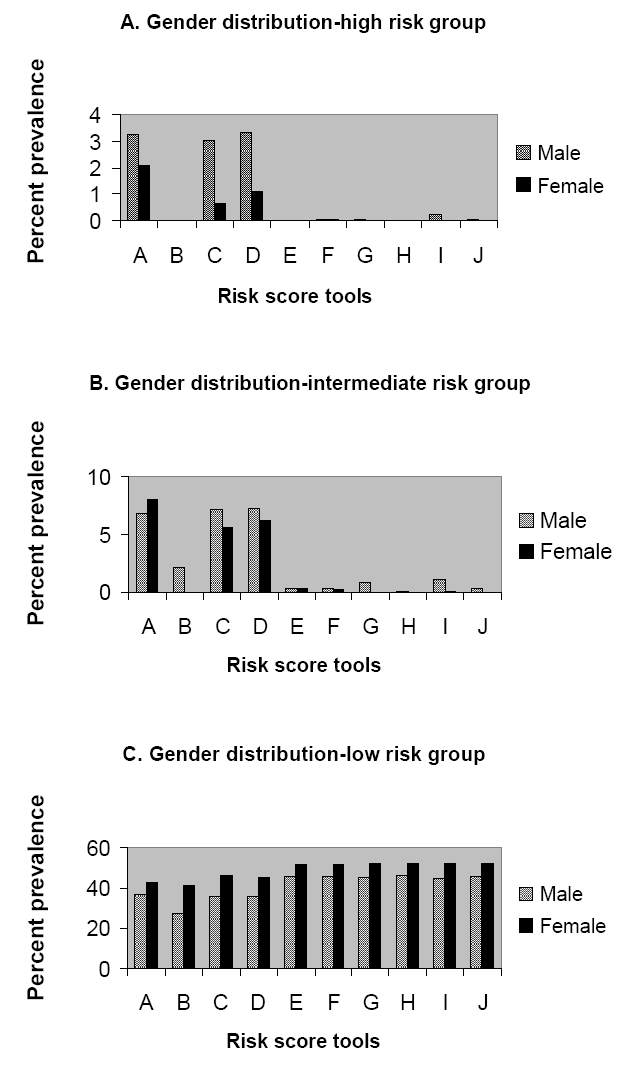
A, 2B, 2C illustrate the gender distribution in the high, intermediate and low risk categories.
Figures 1.
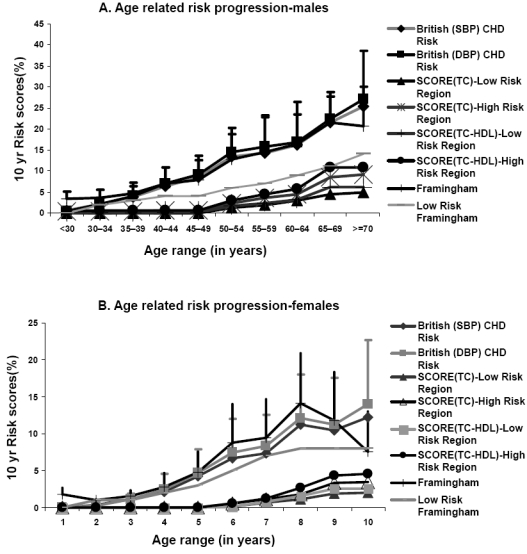
A and 1B depict graphically the age distribution of CHD risk scores in males and females respectively.
We have used the term ‘traditional risk factors’ for all those factors that have been used to calculate the CVD risk scores. Table 2A does show significantly higher levels of total cholesterol (TC) and TC/HDL in the high risk group as compared to the low risk group. HDL is significantly lower in the high risk group of subjects. Similarly age, SBP, and DBP are much higher in the high risk group in relation to the low risk group (Table 2A). In view of the difference in the numbers between the two groups, all variables were log transformed and the p value calculated after adjusting for age, sex, and body mass index (BMI). Within the groups, there were more diabetics, smokers, and hypertensives in the high risk in comparison to the low risk group (Table 2A). Table 3A illustrates the comparison of traditional risk factors between the high and intermediate risk groups calculated using the Framingham model. We found significantly lower levels of HDL cholesterol, higher TC/HDL ratio, higher systolic blood pressure recordings and higher prevalence of diabetes, hypertension and smoking in the high risk group when compared to the intermediate risk group. All the traditional risk factors utilized in the computation of the risk scores were significantly higher in the intermediate risk group in comparison to the low risk group, except for HDL cholesterol which was found to be significantly lower in the intermediate risk group (Table 4A).
Table 2A.
Comparison of traditional risk factors between high and low risk groups
| Risk factor | High risk (N = 82) | Low risk (N = 1231) | p | ||
|---|---|---|---|---|---|
| N | Mean ± SD | N | Mean ± SD | ||
| TC (mg/dl) | 82 | 195 ± 34.57 | 1231 | 173.39 ± 38.76 | 0.000 |
| HDL (mg/dl) | 82 | 36.92 ± 8.22 | 1231 | 43.36 ± 10.88 | 0.000 |
| TC/HDL | 82 | 5.52 ± 1.56 | 1231 | 4.2 ± 1.23 | 0.000 |
| Age | 82 | 60.27 ± 6.7 | 1223 | 36.41 ± 12.45 | 0.000 |
| SBP | 81 | 141.25 ± 19.27 | 1225 | 118.8 ± 12.76 | 0.000 |
| DBP | 81 | 87.85 ± 12 | 1225 | 79.48 ± 8.48 | 0.002 |
| DM | 52 | 47 | <0.0001 | ||
| HTN | 45 | 131 | <0.0001 | ||
| Smoking | 24 | 117 | <0.0001 | ||
Table 3A.
Comparison of traditional risk factors between high and intermediate risk groups
| Risk factors | High risk (82) | Intermediate risk (229) | p value | ||
|---|---|---|---|---|---|
| N | Mean ± SD | N | Mean ± SD | ||
| TC (mg/dl) | 82 | 195.00 ± 34.57 | 229 | 198.51 ± 42.71 | 0.504 |
| HDL (mg/dl) | 82 | 36.91 ± 8.22 | 229 | 39.58 ± 8.51 | 0.015 |
| TC/HDL | 82 | 5.52 ± 1.56 | 229 | 5.17 ± 1.27 | 0.050 |
| Age | 82 | 60.27 ± 6.70 | 228 | 54.50 ± 8.63 | 0.000 |
| SBP | 81 | 141.25 ± 19.27 | 229 | 133.49 ± 16.25 | 0.001 |
| DBP | 81 | 87.85 ± 11.99 | 229 | 86.72 ± 8.89 | 0.370 |
| DM | 52 | 62 | 0.0001 | ||
| HTN | 45 | 86 | 0.0089 | ||
| Smoking | 24 | 42 | 0.0419 | ||
Table 4A.
Comparison of traditional risk factors between intermediate and low risk groups
| Risk factors | Intermediate risk (229) | Low risk (1231) | p value | ||
|---|---|---|---|---|---|
| N | Mean ± SD | N | Mean ± SD | ||
| TC (mg/dl) | 229 | 198.51 ± 42.71 | 1231 | 173.39 ± 38.76 | 0.000 |
| HDL (mg/dl) | 229 | 39.58 ± 8.51 | 1231 | 43.36 ± 10.88 | 0.000 |
| TC/HDL | 229 | 5.17 ± 1.27 | 1231 | 4.19 ± 1.23 | 0.000 |
| Age | 228 | 54.50 ± 8.63 | 1223 | 36.41 ± 12.45 | 0.000 |
| SBP | 229 | 133.49 ± 16.25 | 1225 | 118.49 ± 12.76 | 0.000 |
| DBP | 229 | 86.72 ± 8.89 | 1225 | 79.48 ± 8.48 | 0.000 |
| DM | 62 | 47 | 0.0001 | ||
| HTN | 86 | 131 | 0.0001 | ||
| Smoking | 42 | 117 | 0.0002 | ||
Novel biomarkers listed in Table 2B are those not used by the risk scoring tools. triglyceride (TG), LDL, Apolipoproteins A1 and B100, lipoprotein (a), CRP, hsCRP, oxidized LDL, P-selectin, Plasminogen activator inhibitor-1 (PAI-1) and Fibrinogen levels were found to be significantly higher in the high risk group when compared with the low risk group. A similar trend was observed in the factor VII activity, leptin levels as also in the adiponectin levels (Table 2B). Significantly higher levels of antibody titers against cytomegalovirus, Chlamydia pneumoniae and herpes simplex virus-1 were prevalent in the high risk in comparison with the low risk cohort. Heat shock protein 65 (HSP65) levels also showed a similar distribution. Table 2C summarizes our inference with regard to factors not used in calculation of the novel risk scores. BMI, waist circumference (WC), and waist-to-hip ratio (WHR) are significantly higher in the high risk group. Large number of subjects in the low risk group also had family history of CVD. Good numbers of subjects at high risk were found to be exercising when compared with the low risk group. Diet and alcohol intake did not show a significant difference in distribution in between the two groups. A significantly high number of people in the high-risk group had metabolic syndrome as defined by the NCEP–ATPIII 2001 criteria. Comparison of the novel plasma biomarkers between the high risk and the intermediate risk group revealed significantly higher levels of triglycerides, LDL cholesterol, Apolipoprotein A1 and Apolipoprotein B100 in the high risk group. Inflammatory markers like CRP, hsCRP, IL6, and prothrombotic biomarkers like fibrinogen, PAI-1 and factor VII activity were significantly higher in the high risk group. The adipocytokines adiponectin and leptin as well as the antibody titers against C. pneumoniae were significantly higher in the high risk in comparison with the intermediate risk group. HSP65 titers were also significantly higher in the high risk group (Table 3B). Table 4B illustrates that all the novel lipoprotein, pro-inflammatory, cell adhesion molecules, prothrombotic, adipocytokines, immune as well as serological plasma biomarkers were significantly higher in the intermediate risk group when compared to the low risk group, except for the antibody titers to H. pylori.
Table 2B.
Comparison of novel pasma biomarkers between high and low risk groups
| Biomarker | High risk | Low risk | Age, sex and BMI adjusted p value | ||
|---|---|---|---|---|---|
| N | Mean ± SD | N | Mean ± SD | ||
| TG (mg/dl) | 82 | 179.23 ± 133.8 | 1231 | 122.89 ± 79.3 | 0.000 |
| LDL (mg/dl) | 79 | 125.09 ± 29.4 | 1216 | 106.13 ± 33.3 | 0.000 |
| Apo A1 (g/l) | 82 | 1.21 ± 0.25 | 1231 | 1.17 ± 0.23 | 0.000 |
| Apo B100 (g/l) | 82 | 1.12 ± 0.29 | 1231 | 0.94 ± 0.26 | 0.000 |
| Lp(a) (mg/dl) | 76 | 29.57 ± 27.8 | 1123 | 23.22 ± 26.08 | 0.001 |
| CRP (ug/dl) | 52 | 5.94 ± 7.4 | 500 | 2.89 ± 3.96 | 0.001 |
| hsCRP (μg/dl) | 19 | 3.62 ± 4.31 | 333 | 2.59 ± 3.29 | 0.020 |
| IL6 (pg/ml) | 42 | 4.36 ± 2.36 | 399 | 2.83 ± 2.5 | 0.068 |
| OxLDL (mu/l) | 53 | 64742.87 ± 20878.29 | 486 | 54282.14 ± 16483.23 | 0.000 |
| sICAM (ng/ml) | 28 | 273.35 ± 127.37 | 339 | 218.35 ± 54.64 | 0.104 |
| P-selectin (ng/ml) | 32 | 51.66 ± 18.17 | 356 | 44.18 ± 14.82 | 0.001 |
| PAI-1 (ng/ml)) | 54 | 69.6 ± 62.6 | 664 | 47.54 ± 34.2 | 0.027 |
| Fibrinogen (g/L) | 82 | 4.11 ± 1.03 | 1226 | 3.62 ± 0.85 | 0.000 |
| FVII.c (%) | 82 | 112.4 ± 28.04 | 1226 | 107.02 ± 23.99 | 0.000 |
| Adiponectin (ng/ml) | 28 | 6138.45 ± 4174.46 | 317 | 5966.47 ± 3481.92 | 0.000 |
| Leptin (ng/ml) | 27 | 30.53 ± 21.84 | 309 | 23.47 ± 19.95 | 0.000 |
| CMV (IU/ml) | 81 | 14.52 ± 18.07 | 1227 | 9.55 ± 8.56 | 0.000 |
| C.pneumoniae (AI) | 82 | 0.7071 ± 0.33 | 1223 | 0.59 ± 0.37 | 0.026 |
| H.pylori (Uarb/ml) | 25 | 31.82 ± 59.7 | 267 | 22.83 ± 30.82 | 0.137 |
| HSV 1 (IU/ml) | 25 | 1.23 ± 1 | 274 | 1.01 ± 0.98 | 0.001 |
| HSP 65 (mg/ml) | 28 | 4.14 ± 7.89 | 338 | 1.71 ± 4.56 | 0.048 |
Table 2C.
Comparison of novel risk factors between high and low risk groups
| Risk factor | High risk | Low risk | p | ||
|---|---|---|---|---|---|
| N | Mean ± SD | N | Mean ± SD | ||
| BMI | 81 | 26.97 ± 4.66 | 1226 | 25.29 ± 4.79 | 0.000 |
| WC | 81 | 94.41 ± 10.32 | 1228 | 85.44 ± 11.85 | 0.000 |
| WHR | 81 | 0.94 ± 0.006 | 1228 | 0.89 ± 0.0078 | 0.000 |
| F/h/o CVD | 55 | 1060 | <0.0001 | ||
| Metabolic Syndrome | |||||
| (ATPIII) | 66 | 301 | <0.0001 | ||
| Exercise | 42 | 461 | 0.018 | ||
| Diet-Veg | 43 | 663 | 0.892 | ||
| Diet-Non-Veg | 39 | 562 | 0.825 | ||
| Alcohol | 14 | 123 | 0.065 | ||
Table 3B.
Comparison of novel plasma biomarkers between high and intermediate risk groups
| Biomarker | High risk | Intermediate risk | Age, sex and BMI adjusted p value | ||
|---|---|---|---|---|---|
| N | Mean ± SD | N | Mean ± SD | ||
| TG (mg/dl) | 81 | 179.12 ± 134.63 | 227 | 164.52 ± 79.90 | 0.000 |
| LDL (mg/dl) | 78 | 125.664 ± 29.129 | 224 | 126.622 ± 38.392 | 0.033 |
| Apo A1 (g/l) | 81 | 1.211 ± 0.246 | 226 | 1.210 ± 0.239 | 0.042 |
| Apo B 100 (g/l) | 81 | 1.122 ± 0.292 | 226 | 1.118 ± 0.284 | 0.000 |
| Lp(a) (mg/dl) | 75 | 29.15 ± 27.75 | 201 | 23.52 ± 29.34 | 0.139 |
| CRP (ug/dl) | 51 | 5.363 ± 6.197 | 96 | 4.474 ± 5.804 | 0.000 |
| hsCRP (μg/dl) | 34 | 4.340 ± 4.370 | 100 | 4.104 ± 5.654 | 0.000 |
| IL6 (pg/ml) | 41 | 4.270 ± 2.309 | 77 | 4.231 ± 7.7457 | 0.020 |
| OxLDL (mu/l) | 52 | 64878.549 ± 21058.379 | 93 | 64200.956 ± 17056.390 | 0.673 |
| sICAM (ng/ml) | 28 | 273.349 ± 127.368 | 56 | 241.891 ± 64.331 | 0.334 |
| p-selectin (ng/ml) | 31 | 51.810 ± 18.444 | 64 | 52.090 ± 17.807 | 0.375 |
| PAI-1 (ng/ml) | 54 | 68.490 ± 62.923 | 138 | 63.096 ± 41.998 | 0.000 |
| Fibrinogen (g/l) | 81 | 4.081 ± 1.014 | 225 | 3.881 ± 0.863 | 0.000 |
| FVII.c (%) | 81 | 112.30 ± 28.20 | 225 | 117.79 ± 23.59 | 0.000 |
| Adiponectin (ng/ml) | 28 | 6138.446 ± 4174.458 | 52 | 5798.520 ± 3044.120 | 0.001 |
| Leptin (ng/ml) | 27 | 30.530 ± 21.842 | 52 | 25.3465 ± 17.494 | 0.000 |
| CMV (IU/ml) | 80 | 14.603 ± 18.162 | 223 | 12.961 ± 11.709 | 0.069 |
| C.pneumoniae (Al) | 81 | 0.7048 ± 0.3276 | 226 | 0.6714 ± 0.4017 | 0.034 |
| H.pylori (Uarb/ml) | 25 | 31.817 ± 59.700 | 49 | 26.735 ± 35.417 | 0.911 |
| HSV 1 (IU/ml) | 25 | 1.234 ± 0.998 | 49 | 1.189 ± 1.019 | 0.456 |
| HSP 65 (mg/ml) | 81 | 3.462 ± 6.083 | 227 | 2.115 ± 4.946 | 0.043 |
Table 4B.
Comparison of novel plasma biomarkers between intermediate and low risk groups
| Biomarker | Intermediate risk | Low risk | Age, sex and BMI adjusted p value | ||
|---|---|---|---|---|---|
| N | Mean ± SD | N | Mean ± SD | ||
| TG (mg/dl) | 227 | 164.52 ± 79.90 | 1218 | 122.77 ± 79.59 | 0.000 |
| LDL (mg/dl) | 224 | 126.622 ± 38.392 | 1203 | 106.061 ± 33.274 | 0.000 |
| Apo A1 (g/l) | 226 | 1.210 ± 0.239 | 1218 | 1.171 ± 0.230 | 0.000 |
| Apo B 100 (g/l) | 226 | 1.118 ± 0.284 | 1218 | 0.941 ± 0.264 | 0.000 |
| Lp(a) (mg/dl) | 201 | 23.52 ± 29.34 | 1110 | 23.15 ± 26.09 | 0.001 |
| CRP (ug/dl) | 96 | 4.474 ± 5.804 | 493 | 2.802 ± 3.709 | 0.000 |
| HsCRP (μg/dl) | 100 | 4.104 ± 5.654 | 489 | 2.696 ± 3.248 | 0.000 |
| IL6 (pg/ml) | 77 | 4.231 ± 7.7457 | 393 | 2.810 ± 2.503 | 0.000 |
| OxLDL (mu/l) | 93 | 64200.956 ± 17056.390 | 478 | 54211.026 ± 16474.810 | 0.000 |
| Sicam (ng/ml) | 56 | 241.891 ± 64.331 | 336 | 217.867 ± 54.391 | 0.002 |
| p-selectin (ng/ml) | 64 | 52.090 ± 17.807 | 351 | 44.261 ± 14.854 | 0.000 |
| PAI-1 (ng/ml) | 138 | 63.096 ± 41.998 | 723 | 50.770 ± 47.485 | 0.000 |
| Fibrinogen (g/l) | 225 | 3.881 ± 0.863 | 1213 | 3.613 ± 0.847 | 0.000 |
| FVII.c (%) | 225 | 117.79 ± 23.59 | 1213 | 106.95 ± 23.88 | 0.000 |
| Adiponectin (ng/ml) | 52 | 5798.520 ± 3044.120 | 314 | 5970.116 ± 3492.736 | 0.000 |
| Leptin (ng/ml) | 52 | 25.3465 ± 17.494 | 306 | 23.484 ± 19.996 | 0.000 |
| CMV (IU/ml) | 223 | 12.961 ± 11.709 | 1214 | 9.538 ± 8.572 | 0.000 |
| C.pneumoniae (Al) | 226 | 0.6714 ± 0.4017 | 1210 | 0.5845 ± 0.3659 | 0.000 |
| H.pylori (Uarb/ml) | 49 | 26.735 ± 35.417 | 264 | 22.590 ± 30.363 | 0.179 |
| HSV 1 (IU/ml) | 49 | 1.189 ± 1.019 | 271 | 1.010 ± 0.983 | 0.001 |
| HSP 65 (mg/ml) | 227 | 2.115 ± 4.946 | 1218 | 1.542 ± 2.964 | 0.038 |
Discussion
Current recommendations on the prevention of CHD stress the need to base intervention on an assessment of the individual’s total burden of risk rather than on the level of any particular risk factor (Pyorala et al 1994; Grundy et al 1998; Pearson et al 2002). This follows that most people with CVD have several risk factors which interplay multiplicatively to produce their total risk burden which clinicians need to estimate for efficient prevention and management. A number of clinical tools are available for estimation of absolute CVD risk and most are based upon data derived from the Framingham Heart Study (FHS), the participants of which were white Americans (Anderson et al 1991). Baseline absolute risk of this most intensively studied population is dissimilar to the risk estimated in other studies (Cappuccio et al 2002; Thomsen et al 2002; de Visser et al 2003; Liu et al 2004; Reissigova and Zvarova 2007). Available evidence suggests that the absolute risk varies among different populations independent of the major risk factors (Grundy et al 1999; Lee et al 2001; Thomsen et al 2002; de Visser et al 2003; Asia Pacific Cohort Studies Collaboration 2007). To date, there aren’t sufficient comparative studies which can quantitatively define the adjustment required in the various risk scoring tools for application to different populations. Only some like the Jakarta Cardiovascular score (a modified Framingham score developed in Indonesia) come to mind and neither are there too many prospective studies like the Framingham study in most countries that exhibit transforming trends in the disease epidemiology.
To our knowledge, no other study has applied and compared different CVD risk predictive systems to Asian Indians residing in the Indian subcontinent (studied cohort also contains Bangladeshi subjects). In this study we subjected the data generated from a cohort of unaffected Asian Indians high at risk for development of CVD with a strong family history of the same, to three main predictive risk scoring systems. The Joint British societies’ system (1998) is based upon the Framingham function. All of these risk models were developed in a general population. Only the European SCORE system is derived from an assembly pool of datasets from 12 European cohort studies (Conroy et al 2003) and had a computation for high and low risk regions, which were uniformly applied to our study population. The TC/HDL model of Euro SCORE was also calculated in spite of the authors’ mention of there being no difference between the above and the TC model (Conroy et al 2003). This was done in view of the observed low levels of HDL-C in our cohort.
We noticed an obvious age related increase of CHD risk across all the utilized scoring systems and in both sexes. Most of the subjects (94.68%) were computed to be at low risk for CVD in the next ten years as mentioned in the Results section. These numbers of people at high risk (5.32%) appear to be deceivingly small for a population notoriously known for high prevalence of premature onset CVD. The results of our study are even lower than that observed by Cappuccio and colleagues (2002) when they applied the Framingham risk estimates to ethnic minorities in the UK. They found a high risk prevalence of 13.4% in Asian Indians which was higher than both whites and people of African origin. A study of first generation immigrant Indian physicians in the USA found that the age-adjusted prevalence of MI or angina was 3 times more in Indian men (mean age 46.4 years) compared with the men in the Framingham Offspring study (7.2% vs 2.5%) (Enas et al 1996). Bhopal and colleagues (2005) also demonstrated by their study of South Asians in the UK that the European SCORE showed relatively low 10 year risk when compared with the Framingham model.
Although we are not aware of other studies that have examined the relevance of emerging risk factors to risk stratification as applied to risk score models, several studies have shown the importance of newer risk factors in the pathophysiology of atherothrombosis (Ross 1999; Grundy et al 1998; Enas and Senthilkumar 2001; Greenland et al 2001; Albert et al 2003; Ridker et al 2004a, 2004b; Cushman et al 2005). Shaukat and colleagues (1995) analyzed the risk factor profiles of young siblings of UK-based Asians. When compared with their European counterparts, the young Asians (mean age 22 years) were more sedentary, centrally obese, insulin resistant, had higher levels of Lp(a), showed a prothrombotic tendency with elevated levels of PAI-1, and reduced tPA activity.
Findings from our study certainly seem to imply that novel risk factors can make a significant contribution to CVD risk prediction in addition to the traditional risk factors used by the various models. In this study we observed, as expected, significantly higher prevalence of the traditional risk factors in the high risk group as compared with the low risk group. On examination of the novel plasma biomarkers (Table 2B) that are not used by the risk scoring models, our findings were very interesting, as revelation of their distribution between the high risk and low risk group (Framingham model) became apparent. We analyzed various phenotypes: lipid, pro-inflammatory, pro-thrombotic, fibrinolytic, adipocytokines, cell adhesion molecules, and serological markers, which serve as injurious stimuli to the endothelium and/or are constituents of the atherosclerotic plaques, or lead to the instability of a plaque. As mentioned in the results section, we found significantly higher levels of these ‘novel’ biomarkers in the high risk group. The order of prevalence of traditional risk factors and novel plasma biomarkers was descending from the intermediate to the low risk groups (Tables 3A, 3B, 4A, and 4B).
The AHA defines obesity as a major risk factor for CVD (Grundy et al 1999). We found significantly higher BMI in the high risk group as against the low risk one. Risk is further accentuated when obesity has a predominant abdominal component (Raji et al 2001; Misra et al 2005; Deepa et al 2006). In lieu with this concept we found significantly higher WC and WHR in the high risk cohort when compared to the low risk cohort. The Metabolic syndrome as first defined by Reaven (1988) is a cluster of insulin resistance with hypertension, dyslipidemia and obesity. MS is a significant risk factor for development of CVD and is found to be highly prevalent in the Asian Indian population (Misra and Vikram 2002; Shah et al 2005; Chow et al 2007; Deepa et al 2007; Ramachandran et al 2007). In our study we have designated MS to the participants using the NCEP–ATPIII guidelines (1998) and find significantly larger number of people with MS in the CVD high risk group.
Limitations
This study applies the risk functions and calculates a total risk burden at a single point in time and does not offer any information on the progression of risk in an individual over a period of time. While thresholds for risk factors are useful in clinical decision making, it is also recognized that risk factors operate in continuum rather than an all or none phenomenon (Bhal et al 2001). Ideally, prospective validation of the risk functions should be performed and until a cohort study like ours produces results, consideration should be given to whether an adjustment factor should be applied to the calculated risk scores of Asian Indians (Quirke et al 2003).
Conclusion
The key to combating the globally rising incidence of CVD lies in the identification and control of known and emerging risk factors by a population based strategy aimed at comprehensive risk reduction. This study shows that the Framingham-based risk scores (Framingham and the Joint British Societies) and the European SCORE underestimates the risk of cardiovascular disease morbidity/mortality in men and women from an estimated high risk cohort of Asian Indians. Disproportionate underestimation of risk may contribute to health inequalities and more significantly may mean that risk-reducing treatments are not being offered to those who need them the most. We realize however, the validity of the calculated risk scores can only be assessed by a follow up process of our cohort that is under way. Our findings also illustrate that ‘Novel’ risk factors and plasma biomarkers not used in the risk scoring systems show significant association with high CVD risk scores for Asian Indians. It is of utmost importance to determine the independent predictive power of emerging risk factors. Thus, it may be more relevant to develop an indigenous predictive risk scoring model for people of Indian origin, with inclusion of their unique risk profiles.
Acknowledgments
We would like to express our profound gratitude to all the participants for their cooperation and contribution towards this study. This work is a part of the ongoing Indian Atherosclerosis Research study supported by our parent institute, Thrombosis Research Institute, London, and Tata Social Welfare trust. We would also like to thank the Trustees of Thrombosis Research Institue, London and Thrombosis Research Institute, Bangalore for their support. We thank Ms. Dhanalakshmi B and Ms Asimani for enrolling patients in Bangalore and Ms.Sheetal S, Mr. Shailesh K and Ms. Sunita L at Asian Heart Institute, Mumbai. We also thank Ms. Rekha KR and Mr. Prasad S for managing the IARS database.
References
- Anderson KM, Odell PM, Wilson PW, et al. Cardiovascular disease risk profiles. Am Heart J. 1991;121:293–8. doi: 10.1016/0002-8703(91)90861-b. [DOI] [PubMed] [Google Scholar]
- Anand SS, Yusuf S, Vuksan V, et al. Differences in risk factors, atherosclerosis, and cardiovascular disease between ethnic groups in Canada: the Study of Health Assessment and Risk in Ethnic Groups (SHARE) Lancet. 2000;356:279–4. doi: 10.1016/s0140-6736(00)02502-2. [DOI] [PubMed] [Google Scholar]
- Albert MA, Glynn RJ, Ridker PM. Plasma concentration of C-reactive protein and the calculated Framingham Coronary Heart Disease Risk Score. Circulation. 2003;108:161–5. doi: 10.1161/01.CIR.0000080289.72166.CF. [DOI] [PubMed] [Google Scholar]
- Asia Pacific Cohort Studies Collaboration. Cardiovascular risk prediction tools for populations in Asia. J Epidemiol Community Health. 2007;61:115–21. doi: 10.1136/jech.2005.044842. [DOI] [PMC free article] [PubMed] [Google Scholar]
- Bhopal R, Fischbacher C, Vartiainen E, et al. Predicted and observed cardiovascular disease in South Asians: application of FINRISK, Framingham and SCORE models to Newcastle Heart Project data. J Public Health. 2005;27:93–100. doi: 10.1093/pubmed/fdh202. [DOI] [PubMed] [Google Scholar]
- Bahl VK, Prabhakaran D, Karthikeyan G. Coronary artery disease in Indians. Indian Heart J. 2001;53:707–13. [PubMed] [Google Scholar]
- Brindle P, Emberson J, Lampe F, et al. Predictive accuracy of the Framingham coronary risk score in British men: prospective cohort study. BMJ. 2003;327:1267–72. doi: 10.1136/bmj.327.7426.1267. [DOI] [PMC free article] [PubMed] [Google Scholar]
- Brindle PM, McConnachie A, Upton MN, et al. The accuracy of the Framingham risk-score in different socioeconomic groups: a prospective study. Br J Gen Pract. 2005;55:838–45. [PMC free article] [PubMed] [Google Scholar]
- Conroy RM, Pyorala K, Fitzgerald AP, et al. Estimation of ten-year risk of fatal cardiovascular disease in Europe: the SCORE project. Eur Heart J. 2003;24:987–03. doi: 10.1016/s0195-668x(03)00114-3. [DOI] [PubMed] [Google Scholar]
- Cappuccio FP, Oakeshott P, Strazzullo P, et al. Application of Framingham risk estimates to ethnic minorities in United Kingdom and implications for primary prevention of heart disease in general practice: cross sectional population based study. BMJ. 2002;325:1271. doi: 10.1136/bmj.325.7375.1271. Erratum in: BMJ, 2003; 327(7420):919. [DOI] [PMC free article] [PubMed] [Google Scholar]
- Cobb FR, Kraus WE, Root M, et al. Assessing risk for coronary heart disease: beyond Framingham. Am Heart J. 2003;146:572–80. doi: 10.1016/S0002-8703(03)00500-3. [DOI] [PubMed] [Google Scholar]
- Chow CK, Naidu S, Raju K, et al. Significant lipid, adiposity and metabolic abnormalities amongst 4535 Indians from a developing region of rural Andhra Pradesh. Atherosclerosis. 2007 doi: 10.1016/j.atherosclerosis.2007.02.027. Epub ahead of print. [DOI] [PubMed] [Google Scholar]
- Cushman M, Arnold AM, Psaty BM, et al. C-reactive protein and the 10-year incidence of coronary heart disease in older men and women: the cardiovascular health study. Circulation. 2005;112:25–31. doi: 10.1161/CIRCULATIONAHA.104.504159. [DOI] [PubMed] [Google Scholar]
- D’Agostino RB, Sr, Grundy S, Sullivan LM, et al. Validation of the Framingham coronary heart disease prediction scores: results of a multiple ethnic groups investigation. JAMA. 2001;286:180–7. doi: 10.1001/jama.286.2.180. [DOI] [PubMed] [Google Scholar]
- Deepa R, Sandeep S, Mohan V. Abdominal obesity, visceral fat and type 2 diabetes– “Asian Indian phenotype. In: Mohan V, Rao GHR, editors. Type 2 diabetes in South Asians: Epidemiology, risk factors and prevention. New Delhi: Jaypee Brothers Medical Publishers (P) Ltd; 2006. pp. 138–52. [Google Scholar]
- Deepa M, Farooq S, Datta M, et al. Prevalence of metabolic syndrome using WHO, ATPIII and IDF definitions in Asian Indians: the Chennai Urban Rural Epidemiology Study (CURES-34) Diabetes Metab Res Rev. 2007;23:127–34. doi: 10.1002/dmrr.658. [DOI] [PubMed] [Google Scholar]
- Enas EA, Garg A, Davidson MA, et al. Coronary heart disease and its risk factors in first-generation immigrant Asian Indians to the United States of America. Indian Heart J. 1996;48:343–53. [PubMed] [Google Scholar]
- Enas EA, Senthilkumar A. Coronary artery disease in Asian Indians: An update and review. Int J Card. 2001;1:2. [Google Scholar]
- [NCEP-ATPIII] National Cholesterol Education Program – Adult Treatment Panel III. Expert Panel on Detection, Evaluation, and Treatment of High Blood Cholesterol in Adults. Executive Summary of the Third Report of the National Cholesterol Education Program (NCEP) Expert Panel on Detection, Evaluation, and Treatment of High Blood Cholesterol In Adults (Adult Treatment Panel III) JAMA. 2001;285:2486–97. doi: 10.1001/jama.285.19.2486. [DOI] [PubMed] [Google Scholar]
- Greenland P, Smith SC, Grundy SM. Improving Coronary Heart Disease risk Assessment in Asymptomatic People: Role of Traditional Risk Factors and Noninvasive Cardiovascular Tests. Circulation. 2001;104:1863–7. doi: 10.1161/hc4201.097189. [DOI] [PubMed] [Google Scholar]
- Grundy SM, Balady GJ, Criqui MH, et al. Primary prevention of coronary heart disease: guidance from Framingham: a statement for healthcare professionals from the AHA Task Force on Risk Reduction. American Heart Association. Circulation. 1998;97:1876–87. doi: 10.1161/01.cir.97.18.1876. [DOI] [PubMed] [Google Scholar]
- Grundy SM, Pasternak R, Greenland P, et al. Assessment of cardiovascular risk by use of multiple-risk-factor assessment equations: A statement for healthcare professionals from the American Heart Association and American College of Cardiology. J Am Coll Cardiol. 1999;34:1348–59. doi: 10.1016/s0735-1097(99)00387-3. [DOI] [PubMed] [Google Scholar]
- Haq IU, Ramsay LE, Yeo WW, et al. Is the Framingham risk function valid for northern European populations? A comparison of methods for estimating absolute coronary risk in high risk men. Heart. 1999;81:40–6. doi: 10.1136/hrt.81.1.40. [DOI] [PMC free article] [PubMed] [Google Scholar]
- Hemann BA, Bimson WF, Taylor AJ. The Framingham Risk Score: an appraisal of its benefits and limitations. Am Heart Hosp J. 2007;5:91–6. doi: 10.1111/j.1541-9215.2007.06350.x. [DOI] [PubMed] [Google Scholar]
- Hense HW, Schulte H, Löwel H, et al. Framingham risk function overestimates risk of coronary heart disease in men and women from Germany – results from the MONICA Augsburg and the PROCAM cohorts. Eur Heart J. 2003;24:937–45. doi: 10.1016/s0195-668x(03)00081-2. [DOI] [PubMed] [Google Scholar]
- [BCS,BHA,BHS,BDA] British Cardiac Society, British Hyperlipidaemia Association, British Hypertension Society, British Diabetic Association. Joint British recommendations on prevention of coronary heart disease in clinical practice 1998. British Cardiac Society, British Hyperlipidaemia Association, British Hypertension Society, endorsed by the British Diabetic Association. Heart. 1998;80(Suppl 2):S1–29. [PMC free article] [PubMed] [Google Scholar]
- Lee J, Heng D, Chia KS, et al. Risk factors and incident coronary heart disease in Chinese, Malay and Asian Indian males: the Singapore Cardiovascular Cohort Study. Int J Epidemiol. 2001;30:983–8. doi: 10.1093/ije/30.5.983. [DOI] [PubMed] [Google Scholar]
- Mission statement. American Association of Physicians of Indian Origin Coronary Artery Disease Committee. 2002 [Google Scholar]
- Misra A, Vikram NK. Insulin Resistance Syndrome (Metabolic Syndrome) and Asian Indians. Current Science. 2002;83:1483–96. [Google Scholar]
- Misra A, Wasir JS, Pandey RM. An Evaluation of candidate definitions of the Metabolic syndrome in adult Asian Indians. Diabetes Care. 2005;28:398–403. doi: 10.2337/diacare.28.2.398. [DOI] [PubMed] [Google Scholar]
- McKeigue P, Miller GJ, Marmot MG. Coronary heart disease in South Asian overview: a review. J Clin Epidemiol. 1989;42:597–9. doi: 10.1016/0895-4356(89)90002-4. [DOI] [PubMed] [Google Scholar]
- McKeigue PM, Shah B, Marmott MG. Relationship of central obesity and insulin resistance with high diabetes prevalence and cardiovascular risk in South Asians. Lancet. 1991;337:382–6. doi: 10.1016/0140-6736(91)91164-p. [DOI] [PubMed] [Google Scholar]
- Murray JL, Lopez AD. The Global Burden of Disease: A Comprehensive Assessment of Mortality and Disability from Diseases, Injuries, and Risk Factors in 1990 and Projected to 2020. Boston, MA: The Harvard School of Public Health; 1996. [Google Scholar]
- Pyorala K, De Backer G, Graham I, et al. Prevention of coronary heart disease in clinical practice: recommendations of the Task Force of the European Society of Cardiology, European Atherosclerosis Society and European Society of Hypertension. Atherosclerosis. 1994;110:121–61. doi: 10.1016/0021-9150(94)90200-3. [DOI] [PubMed] [Google Scholar]
- Pearson TA, Blair SN, Daniels SR, et al. AHA Guidelines for Primary Prevention of Cardiovascular Disease and Stroke: 2002 Update: Consensus Panel Guide to Comprehensive Risk Reduction for Adult Patients Without Coronary or Other Atherosclerotic Vascular Diseases. American Heart Association Science Advisory and Coordinating Committee. Circulation. 2002;106:388–91. doi: 10.1161/01.cir.0000020190.45892.75. [DOI] [PubMed] [Google Scholar]
- Quirke TP, Gill PS, Mant JW, et al. The applicability of the Framingham coronary heart disease prediction function to black and minority ethnic groups in the UK. Heart. 2003;89:785–6. doi: 10.1136/heart.89.7.785. [DOI] [PMC free article] [PubMed] [Google Scholar]
- Ramsay LE, Haq IU, Jackson PR, et al. Targeting lipid-lowering drug therapy for primary prevention of coronary disease: an updated Sheffield table. Lancet. 1996;348:387–8. doi: 10.1016/s0140-6736(96)05516-x. [DOI] [PubMed] [Google Scholar]
- Ramachandran A, Snehalatha C, Satyavani K, et al. Metabolic syndrome does not increase the risk of conversion of impaired glucose tolerance to diabetes in Asian Indians – Result of Indian diabetes prevention programme. Diabetes Res Clin Pract. 2007;76:215–18. doi: 10.1016/j.diabres.2006.08.009. [DOI] [PubMed] [Google Scholar]
- Ross R. The pathogenesis of atherosclerosis, a perspective for the 1990s. Nature. 1993;362:801–9. doi: 10.1038/362801a0. [DOI] [PubMed] [Google Scholar]
- Ross R. Atherosclerosis--an inflammatory disease. N Engl J Med. 1999;340(2):115–26. doi: 10.1056/NEJM199901143400207. [DOI] [PubMed] [Google Scholar]
- Raji A, Seely EW, Arky RA, et al. Body fat distribution and insulin resistance in healthy Asian Indians and Caucasians. J Clin Endocrinol Metab. 2001;86:5366–71. doi: 10.1210/jcem.86.11.7992. [DOI] [PubMed] [Google Scholar]
- Reissigova J, Zvarova J. The Framingham risk function underestimated absolute coronary heart disease risk in Czech men. Methods Inf Med. 2007;46:43–9. [PubMed] [Google Scholar]
- Ridker PM, Wilson PW, Grundy SM. Should C-reactive protein be added to metabolic syndrome and to assessment of global cardiovascular risk? Circulation. 2004a;109:2818–25. doi: 10.1161/01.CIR.0000132467.45278.59. [DOI] [PubMed] [Google Scholar]
- Ridker PM, Wilson PW, Grundy SM. Should C-reactive protein be added to metabolic syndrome and to assessment of global cardiovascular risk? Circulation. 2004b;109:2818–25. doi: 10.1161/01.CIR.0000132467.45278.59. [DOI] [PubMed] [Google Scholar]
- Reaven GM. Banting lecture 1988. Role of insulin resistance in human disease. Diabetes. 1988;37:1595–607. doi: 10.2337/diab.37.12.1595. [DOI] [PubMed] [Google Scholar]
- Shaukat N, de Bono DP, Jones DR. Like father like son? Sons of patients of European or Indian origin with coronary artery disease reflect their parents’ risk factor patterns. Br Heart J. 1995;74:318–23. doi: 10.1136/hrt.74.3.318. [DOI] [PMC free article] [PubMed] [Google Scholar]
- Shah T, Jonnalagadda SS, Kicklighter JR, et al. Prevalence of metabolic syndrome risk factors among young adult Asian Indians. J Immigr Health. 2005;7:117–26. doi: 10.1007/s10903-005-2645-5. [DOI] [PubMed] [Google Scholar]
- Stampfer MJ, Ridker PM, Dzau VJ. Risk Factor Criteria. Circulation. 2004;109:IV3–5. doi: 10.1161/01.CIR.0000133446.69171.7d. [DOI] [PubMed] [Google Scholar]
- Thomsen TF, McGee D, Davidsen M, et al. A cross-validation of risk-scores for coronary heart disease mortality based on data from the Glostrup Population Studies and Framingham Heart Study. Int J Epidemiol. 2002;31:817–22. doi: 10.1093/ije/31.4.817. [DOI] [PubMed] [Google Scholar]
- [WHO] World Health Organization. World Health Statistics Annual 2005 [online] Geneva: World Health Organization; 2005. Accessed on 10 August, 2007 URL: http://www.who.int/en/ [Google Scholar]
- [WHO] World Health Organization. WHO: World Health Survey 2000. CVD Infobase [online] 2000 Accessed on 10 August, 2007. URL: http://www.who.int/en/
- Wilson PW, D’Agostino RB, Levy D, et al. Prediction of coronary heart disease using risk factor categories. Circulation. 1998;97:1837–47. doi: 10.1161/01.cir.97.18.1837. [DOI] [PubMed] [Google Scholar]