Abstract
The D-bar algorithm based on A Nachman's 2D global uniqueness proof for the inverse conductivity problem is implemented on an elliptical domain. The scattering transform is computed on an ellipse and the complete electrode model (CEM) for the forward problem is computed with the finite element method (FEM) in order to obtain static conductivity reconstructions of conductive and insulating targets in a saline-filled tank. It is demonstrated that the spatial artifacts in the image are significantly reduced when the domain is properly modeled in the reconstruction, as opposed to being modeled as a disk.
Keywords: electrical impedance tomography, reconstruction algorithm, D-bar method, elliptical tank
1. Introduction
Electrical impedance tomography (EIT) has shown great promise as a new imaging modality. The general idea of the problem of EIT is to determine the conductivity in the interior of a body given the voltages on the surface arising from a basis of current patterns applied on the boundary. It has many applications in the medical fields such as monitoring ventilation and perfusion, diagnosis of pulmonary edema and pulmonary embolus, and breast cancer detection. The problem also has several industrial applications including subsurface flow monitoring and remediation, underground contaminant detection, and nondestructive evaluation.
The 2D geometry is a particularly suitable model for imaging cross-sections of a 3D region, such as the torso when imaging heart and lung function. Such cross-sectional images have been used for obtaining cross-sectional difference images of regional lung inflation (Borges et al 2001, Frerichs et al 2002, 1998, Kunst et al 2000a, 2000b, 1998, Victorino et al 2004). Such images could provide clinicians with a valuable tool for setting and controlling airflow and pressure settings for mechanically ventilated patients (Trigo et al 2004, Victorino et al 2004). In such applications, the shape of the boundary is initially unknown (and is changing as the patient moves and breathes), but can be estimated apriori from a patient's CT scan, for instance. Previous works in EIT have studied the importance of correctly modeling the shape of the boundary in the reconstruction algorithm (Adler et al 1996, Borsic et al 2001, Gersing et al 1996, Jain et al 1997, Kolehmainen et al 2005, Kotre 1996). The results are very dependent upon the design of the EIT system and the reconstruction algorithm being used. For instance, Jain et al (1997) found conductivity value errors of as much as 20% in the center of the domain with an axis ratio of 0.73 when the problem was modeled with a circle, and artifacts were dramatically reduced with proper domain representation. In Kolehmainen et al (2005) severe errors in spatial resolution are demonstrated with numerically simulated data for a 16-electrode adjacent current injection system. In that work, an algorithm based on the theory of Teichmüller spaces is presented and used to find a deformed image of the original conductivity; that is, an improved reconstruction of the conductivity in a noncircular domain is produced on a circular domain. Here, we show using elliptical tank data collected on the ACT 3 imaging system (Edic et al 1995) that correctly incorporating boundary shape in the D-bar algorithm significantly reduces artifacts in the reconstructed image.
In this paper we refer to the D-bar method as the method described in Nachman's 1996 constructive proof of global uniqueness for the inverse conductivity problem in 2D (Nachman 1996) and implemented numerically in Siltanen et al (2000), Mueller and Siltanen (2003), Isaacson et al (2004, 2006). A history of theoretical advances in the inverse conductivity problem can be found in the celebrated uniqueness proof of Astala and Päivärinta (2006). The reader is referred to Borcea (2002), Hanke and Brühl (2003), Holder (2005) for surveys of reconstruction methods for EIT. The D-bar method is a direct reconstruction algorithm based on techniques of inverse scattering to solve the full nonlinear inverse problem of reconstructing γ from knowledge of the Dirichlet-to-Neumann map. The equations to be solved are stated in Nachman (1996). It does not require any intermediate estimation of the conductivity from a forward model. The first numerical implementation for simulated data is found in Siltanen et al (2000), which has since been extended to experimental data and has been found to produce static images of tank data (Isaacson et al 2004) and difference images of human chest data in Isaacson et al (2006).
In this paper we present a method of reconstructing the conductivity distribution within an elliptical domain with the D-bar method. In each step of the algorithm we assume the domain to be an ellipse and take approximations with respect to this assumption. We illustrate the quality of the reconstructions with the use of experimental data provided by the ACT 3 system at RPI. The conductivity reconstructions are compared to those computed by the D-bar method on a circular domain described in Isaacson et al (2004).
2. The D-bar method
The EIT problem is modeled by the conductivity equation,
| (1) |
where Ω denotes a 2D simply connected domain, γ represents the conductivity of the domain and u is the electric potential. Applying a known voltage, f , on the boundary of the domain corresponds to a Dirichlet boundary condition
where ∂Ω is the boundary of the domain. Measuring the resulting current density distribution, j, on the boundary corresponds to knowing the Neumann boundary condition
where ν is the outward normal on the boundary. The mapping takes the given voltage distribution on the boundary to the current density distribution. This mapping is called the voltage-to-current density map and is denoted as Λγ.
An important feature of Nachman's proof is that it gives a constructive procedure for recovering γ from knowledge of Λγ . We will describe it very briefly here, and the reader can refer to Nachman (1996), Siltanen et al (2000), Mueller and Siltanen (2003) for more detail. The first step of the algorithm is to transform the conductivity equation to the Schrödinger equation,
| (2) |
The exponentially growing solutions, ψ(x, k), introduced by Faddeev (1966) are the key to the reconstruction. These solutions are asymptotic to eikx for large |x| and large |k|, where the product in the exponent is complex multiplication, and the point x in the plane is associated with the complex number x1 + ix2. The trace on ∂Ω of these solutions from the boundary data is required for the computation of the scattering transform. On the boundary, these solutions satisfy the integral equation (Nachman 1996)
| (3) |
for any , where Sk is a single-layer operator defined as
and Gk(x) is the Faddeev Green's function (Faddeev 1966),
The operator I + Sk(Λγ − Λ1) is invertible (Nachman 1996) and therefore ψ(·,k) can be calculated on the boundary. However, the numerical solution of (3) is not stable if the data are noisy (Mueller and Siltanen 2003). To approximate ψ in a stable way, we take the linearizing approximation ψexp|∂Ω ≡ eikx and thereby avoid solving (3). This approximation was introduced in Siltanen et al (2000) and has been used in the subsequent works (Isaacson et al 2004, 2006) on experimental data.
The scattering transform, t(k), can be viewed as a nonlinear Fourier transform of the Schrödinger potential q as it satisfies
| (4) |
where
| (5) |
The scattering transform, (4), is related to the data by the formula (Nachman 1996)
Under the assumption that γ is a constant in a neighborhood of the boundary, we have that Λγ = Λq. We approximate ψ on the boundary by its large |x| asymptotic behavior ψ|∂Ω ≈ eikx and define the approximate scattering transform texp introduced in Siltanen et al (2000):
| (6) |
Once the scattering transform has been computed the D-bar equation
| (7) |
is solved using the implementation described in Knudsen et al (2004) to solve the integral equation formulation of (7). As proved in Liu (1997), the solution of the D-bar equation is a smoothing process.
The final step is to reconstruct γ(x) using the equation
| (8) |
This step can be understood by noting the limit in (8) shows us by (5) that we have the solution of the Schrödinger equation (2). Since the solution is unique and √γ satisfies (2) we, in fact, have the conductivity.
3. Computing the scattering transform
In this section we will show calculations of the approximate scattering transform texp from current-to-voltage data collected on L electrodes. Before we go into details we will define the continuous inner product 〈f, g〉 by
and the discrete inner product (u(·), w(·))L by
Let denote the voltage measured on the lth electrode corresponding to the kth current pattern Jk and normalized so that . Let jk denote the vector of normalized currents , where . The voltages vk that would result from the normalized currents are then given by .
As in Isaacson et al (2004) the discrete Dirichlet-to-Neumann map Lγ is approximated by where
| (9) |
are the entries of the matrix representation of the Neumann-to-Dirichlet map. We scale this may by γbest, the best constant conducitvity aproximation to γ form the measured data. Since Λcγ = cΛγ for c constant, where
| (10) |
After reconstructing , we obtain γ from the formula . We will use the notation γ throughout the remainder of this section to represent scaled conductivity from (10) to avoid cumbersome notation.
In the calculation of the scattering transform, we want to express texp in terms of the inner products (9) since these are formed from the measured data. The following calculation generalizes that of Isaacson et al (2004) in which the domain was chosen to be a disk. For a general domain we need to parameterize the boundary into a function r(θ). Let (r(θ), θ) describe the boundary ∂Ωof the region and x = r(θ) eiθ be a point on the boundary. Expanding eikx in a Fourier series yields
This can be easily verified by noting the Taylor expansion for eikx.
Denoting the arclength function by s(θ), we have . Substituting the series for eikx into (6) gives
| (11) |
since s(θ) and r(θ) are real. Since , we have that
where A is the area of an electrode. Next, applying the gap model (Somersalo et al 1992) for the current density on the electrodes gives an approximation in terms of the discrete inner product:
| (12) |
where . If the domain is modeled as a disk, then r(θ) ≡ 1 and s(θ) ≡ 1. We will refer to this approximation as the circular tank model (CTM). This case is equivalent to applying the method of Isaacson et al (2004) to reconstruct static images and Isaacson et al (2006) to reconstruct difference images, and the series representation for texp for each case can be found therein.
3.1. Elliptical tank model (ETM)
In this approximation we will take into account the elliptical shape of the tank. We will call this method ETM for the elliptical tank model. In the case of an ellipse centered at the origin with major axis of length 2a and minor axis of length 2b, the boundary has parameterization r(θ) = ab(a2 sin2(θ) + b2 cos2(θ))−1/2. The arclength function s(θ) is then computed from
Since the trigonometric current patterns (TCP) were applied in the data collection, Euler's formula einθ = cos(nθ) + isin(nθ) is applied in (12) to write the inner product in terms of the TCP. These patterns are described by the following function,
where and M is the current amplitude. Expression (12) then becomes a sum of four terms.
Fourier series are calculated for the functions in the inner product rn(θ) cos(nθ), s(θ)rm(θ) cos(mθ), rn(θ) sin(nθ) and s(θ)rm(θ) sin(mθ). Note that the zero-order terms of the Fourier series are 0 due to conservation of charge. The Fourier coefficients are defined as follows:
The expression resulting from substituting these Fourier expansions into the four-term expression for (12) then consists of sums of the inner products
which by (9) are the entries of Lγ . Define
Then we have an expression for in terms of the measured data
which can be written in the matrix form
where A and C are defined as
and
Defining gives an expression for texp akin to the expression in Isaacson et al (2004),
4. The forward problem using the CEM
The voltage-to-current density map Λ1 for a homogeneous domain is required for the computation of the scattering transform. We simulate the voltages on the electrodes on an elliptical saline-filled tank using the complete electrode model (CEM) (Cheng et al 1989) and then construct Λ1. The CEM takes into account both the shunting effect of the electrodes and the contact impedances between the electrodes and tissue. The complete electrode model consists of the conductivity equation (1) and the following boundary conditions:
where zl is the effective contact impedance between the lth electrode and tissue. In addition, the following two conditions for the injected current and measured voltages are needed to ensure existence and uniqueness of the result:
The uniqueness and existence of the CEM has been proven in Somersalo et al (1992). It has been shown to predict the measured voltages at the precision of the ACT 3 system (Cheng et al 1989).
The FEM implementation begins with a variational formulation of the problem. In Somersalo et al (1992), it states that for any (v, V), v ∈ H1(Ω), ,
where Bs is the variational form of the CEM, which is given by
Thus we define the solution to our FEM problem as (uh,Uh), which approximates the solution, (u, U), and are defined as
where n1 = [1,−1, 0, ..., 0]T, , etc. This guarantees that the voltage condition is not violated. Further details of the FEM implementation can be found in Vauhkonen et al (1999).
In order to accurately construct the solution to the forward problem, there needs to be a careful selection of the parameters in the model. That is, we need to have good numerical values for the homogeneous conductivity in the domain, γ0, and the contact impedance on the electrodes, z. We use the approach shown in Isaacson et al (2004) to find a best constant conductivity, γbest. The method minimizes the error between measured voltages and the simulated voltages, U(γ0, τ) and is based on the observation that
where τ = γ0z. Unfortunately, τ cannot be pulled out of the equation. Thus we performed a one-parameter minimization between simulated and measured data using an updated γbest at each step. We found as an average over all the experiments τ ≈ 2.46 mm. This is in close agreement with the τ value of 2.4 mm that was found in Cheng et al (1989) and was used in Vauhkonen et al (1999).
5. Summary of the numerical method
The conductivity was reconstructed on a rectangular mesh of 1600 elements and assumed to be constant in each mesh element. The Dirichlet-to-Neumann map Λ1 required for the scattering transform for computing static images was computed by formula (9), where the voltages were simulated by the method of section 4, using the FEM with the CEM implementation on 1921 nodes, which results in 3712 triangular elements. The scattering transform, texp, was then computed in the complex k plane as described in section 3 on the rectangle [–S, S]2, where S = 4 for the CTM and S = 3 for the ETM, on a 40 by 40 mesh. The truncation of the scattering transform has been discussed and studied in previous works (Mueller and Siltanen 2003, Isaacson et al 2004, 2006) and can be regarded as a regularization of the problem.
To reconstruct difference images, the experimental data from a homogeneous tank, γhom, were used in place of Λ1 as in Isaacson et al (2006) to form the differencing scattering transform
| (13) |
was computed in the complex k plane on the rectangle [−S, S]2, where S = 4.2 for the CTM and S = 3.5 for the ETM, on a 40 by 40 mesh.
The D-bar equation (7) was then solved using the implementation described in Knudsen et al (2004) and γ(x) was obtained from
6. Experimental results
In this section difference and static conductivity images are presented of copper (conducting) and PVC (insulating) targets in an elliptical tank using CTM and ETM. The tank had a major axis of 330 mm and a minor axis of 240 mm. The electrodes were of length 25.4 mm and height of about 46 mm with equal gaps (≈2.76 mm) around the inner edge of the tank. The conductivity of the saline was measured to be 383.4 mS m−1. The data collection was performed on the ACT 3 system (Edic et al 1995), a 32-electrode system operating at 28.8 kHz that applies current and measures the real and quadrature components of the voltage on all 32 electrodes simultaneously. The experimental setup can be seen in figure 1.
Figure 1.
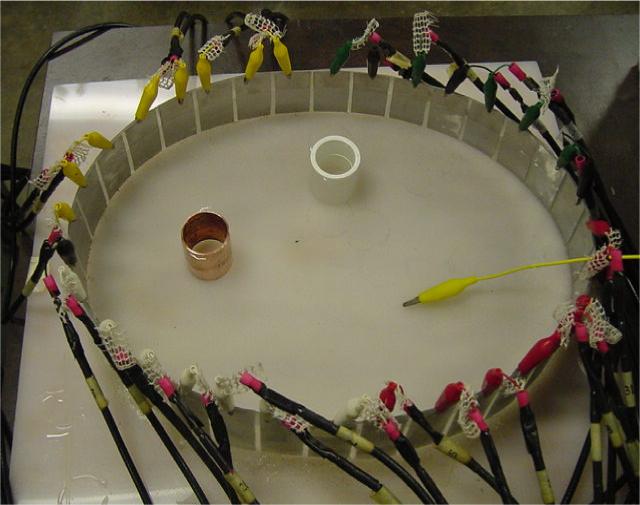
ACT 3 experimental setup.
A copper pipe of diameter 31 mm and a PVC pipe of diameter 33 mm were placed in several locations inside the saline filled tank. Figures 2–5 display difference and static images with the CTM and the ETM for a copper pipe placed 80 mm on the major axis (figure 2), a PVC pipe placed 60 mm on the minor axis (figure 3), a PVC pipe placed in the center (figure 4), and a PVC pipe placed 60 mm on the minor axis and a copper pipe placed 80 mm on the major axis (figure 5). The actual location of the target is superimposed on the images by plotting a circle of the correct diameter the correct distance from the origin. In the case of the reconstructions on the circle, this gives the location where the target should appear relative to the origin.
Figure 2.
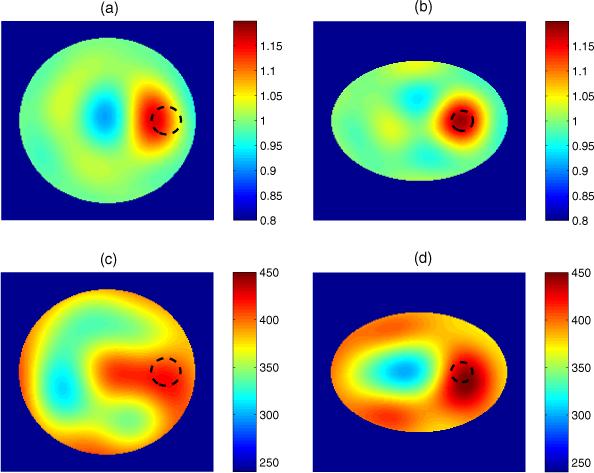
In this experiment a copper pipe is placed 80 mm on the major axis, represented by the dashed line, (a) and (b) are difference images, (c) and (d) are static images, with conductivity in mS m−1, (a) and (c) are CTM results, and (b) and (d) are ETM results.
Figure 5.
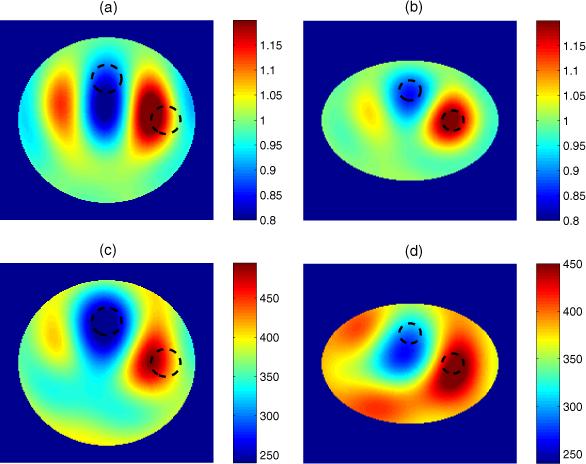
In this experiment a PVC pipe placed 60 mm on the minor axis and a copper pipe placed 80 mm on the major axis, represented by the dashed line, (a) and (b) are difference images, (c) and (d) are static images, with conductivity in mS m−1, (a) and (c) are CTM results, and (b) and (d) are ETM results.
Figure 3.
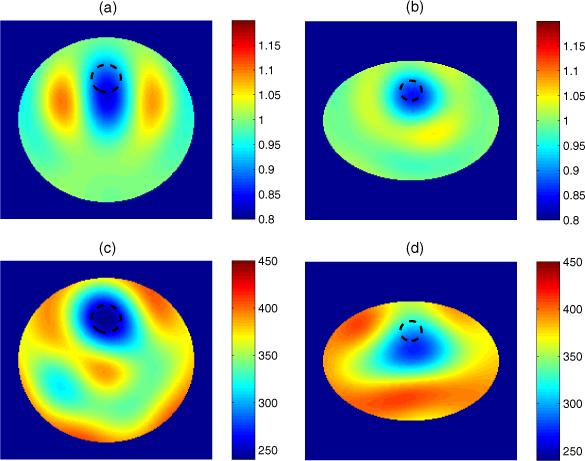
In this experiment a PVC pipe is placed 60 mm on the minor axis, represented by the dashed line, (a) and (b) are difference images, (c) and (d) are static images, with conductivity in mS m−1, (a) and (c) are CTM results, and (b) and (d) are ETM results.
Figure 4.
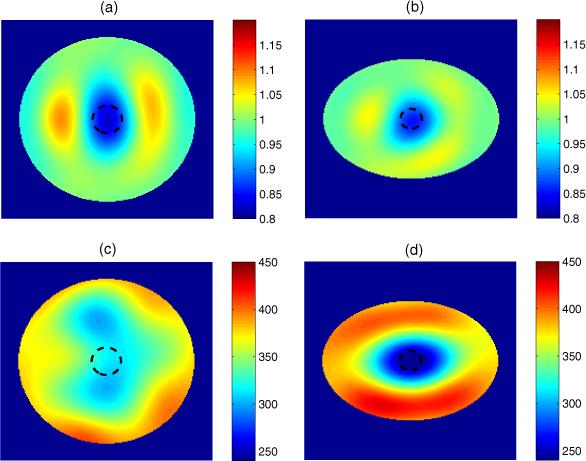
In this experiment a PVC pipe placed in the center of the domain, represented by the dashed line, (a) and (b) are difference images, (c) and (d) are static images, with conductivity in mS m−1, (a) and (c) are CTM results, and (b) and (d) are ETM results.
We see consistently that in the difference images using the CTM the targets are visible and are reconstructed in approximately the correct location with some blurring, but substantial artifacts are present. The vertical distortion of the target can be explained by the fact that the current travels through a shorter path in the y-direction than is modeled by the circular domain, and so conductive targets appear in the image to offset this effect. In the difference images using the ETM there are fewer artifacts, the reconstructed target locations are more accurate, and the target shape is more circular in each.
The results are not as consistent for the static images. We see for the CTM in figures 3(c) and 5(c) that the reconstructions are successful in obtaining the correct targets but the clarity is not very good. However, in figures 2(c) and 4(c) one cannot distinguish the targets with any degree of certainty. In the ETM reconstructions the target is visible in each case, but with a blurred shape and some loss of spatial resolution. Artifacts are present in each example, particularly near the boundary, and in figure 2(d) we see a substantial artifact close to the center of the domain. The relative error in L2 norm between the measured homogeneous tank voltages and the simulated homogeneous tank voltages from the CEM is 3.03%. This discrepancy can be attributed to both modeling and experimental factors.
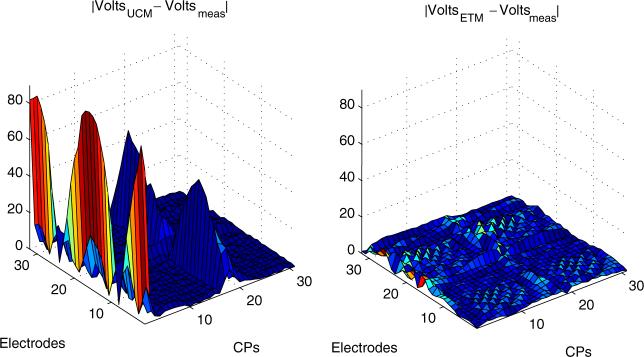
The simulated voltages on the electrodes arising from the reconstructed conductivities for both the CTM and ETM were computed a posteriori by interpolating the conductivity onto the FEM mesh for the forward solver and using the FEM with the CEM to compute the voltages. The residual between the measured voltages Vmeas and computed voltages Uγ were then computed as ∥Vmeas – Uγ∥2/∥Vmeas∥2 · 100 and compared for CTM and ETM. It was found that the ETM residual voltages were consistently lower than those of the CTM. For the CTM the maximum residual over all current patterns was between 60.2% and 61.7%, whereas for ETM it was between 26.3% and 36.6%. A plot of the absolute difference between measured and simulated voltages for the example in figure 5 is given in figure 6. One observes a large amount of residual error for the CTM voltages in the first two cosine and sine patterns, whereas ETM has a smaller and more uniform error over all current patterns and electrodes. The plots for the other examples were very similar to figure 6.
Figure 6.
Absolute differences between measured and simulated voltages for the experiment with a PVC and copper pipe (see figure 5). On the left is the difference for CTM and on the right for ETM.
7. Conclusion
This work demonstrates that more accurate spatial resolution can be achieved in both static and difference images in the D-bar method by correctly modeling the domain shape in the algorithm. Correct domain modeling also led to more accurate residual voltages from the reconstructed conductivities. Further studies are required to quantify any improvements in the accuracy of the magnitude of the reconstructed conductivity.
Acknowledgments
The work of JM was supported by the National Science Foundation under grant no. 0513509. This work was also supported in part by the National Institute of Biomedical Imaging and Bioengineering under grant R01-EB000456−01. The authors thank the anonymous referees for their comments and suggestions.
References
- Adler A, Guardo R, Berthiaume Y. Impedance imaging of lung ventilation Do we need to account for chest expansion. IEEE Trans. Biomed. Eng. 1996;43:414–20. doi: 10.1109/10.486261. [DOI] [PubMed] [Google Scholar]
- Astala K, Päivärinta L. Calderón's inverse conductivity problem in the plane. Ann. Math. 2. 2006;163:265–99. [Google Scholar]
- Barber DC, Seagar AD. Errors in reconstruction of resistivity images using a linear reconstruction technique. Clin. Phys. Physiol. Meas. 1988;9:101–4. doi: 10.1088/0143-0815/9/4a/017. [DOI] [PubMed] [Google Scholar]
- Borcea L. Electrical impedance tomography, topical review. Inverse Problems. 2002;18:979–1001. [Google Scholar]
- Borges JB, Okamoto VN, Tanaka H, Janot GF, Victorino JA, Tucci MR, Carvalho CRR, Barbas CSV, Amato MBP. Bedside detection of regional opening/closing pressures by electrical impedance versus computed tomography (CT) [abstract] Am. J. Respir. Crit. Care Med. 2001;163:A755. [Google Scholar]
- Borsic A, McLeod C, Lionheart W, Kerrouche N. Realistic 2D human thorax modelling for EIT. Physiol. Meas. 2001;22:77–83. doi: 10.1088/0967-3334/22/1/310. [DOI] [PubMed] [Google Scholar]
- Cheng K-S, Isaacson D, Newell JC, Gisser DG. Electrode models for electric current computed tomography. IEEE Trans. Biol. Eng. 1989;36:918–24. doi: 10.1109/10.35300. [DOI] [PMC free article] [PubMed] [Google Scholar]
- Edic PM, Saulnier GJ, Newell JC, Isaacson D. A real-time electrical impedance tomograph. IEEE Trans. Biomed. Eng. 1995;42:849–59. doi: 10.1109/10.412652. [DOI] [PubMed] [Google Scholar]
- Faddeev LD. Increasing solutions of the Schrödinger equation. Sov.-Phys. Dokl. 1966;10:1033–5. [Google Scholar]
- Frerichs I, Hinz J, Herrmann P, Weisser G, Hahn G, Dudykevych T, Quintel M, Hellige G. Detection of local lung air content by electrical impedance tomography compared with electron beam CT. J. Appl. Physiol. 2002;93:660–6. doi: 10.1152/japplphysiol.00081.2002. [DOI] [PubMed] [Google Scholar]
- Frerichs I, Hahn G, Schroder T, Hellige G. Electrical impedance tomography in monitoring experimental lung injury. Intensive Care Med. 1998;24:829–36. doi: 10.1007/s001340050673. [DOI] [PubMed] [Google Scholar]
- Gersing E, Hoffman B, Osypka M. Influence of changing peripheral geometry on electrical impedance tomography measurements. Med. Biol. Eng. Comput. 1996;34:359–61. doi: 10.1007/BF02520005. [DOI] [PubMed] [Google Scholar]
- Hanke M, Brühl M. Recent progress in electrical impedance tomography. Inverse Problems. 2003;19:S65–90. [Google Scholar]
- Holder DS. Electrical Impedance Tomography. 1st edn Institute of Physics Publishing; Bristol and Philadelphia: 2005. [Google Scholar]
- Isaacson D, Mueller JL, Newell JC, Siltanen S. Reconstructions of chest phatoms by the d-bar method for electrical impedance tomography. IEEE Trans. Med. Imaging. 2004;23:821–8. doi: 10.1109/TMI.2004.827482. [DOI] [PubMed] [Google Scholar]
- Isaacson D, Mueller JL, Newell JC, Siltanen S. Imaging cardiac activity by the d-bar method for electrical impedance tomography. Physiol. Meas. 2006;27:S43–50. doi: 10.1088/0967-3334/27/5/S04. [DOI] [PMC free article] [PubMed] [Google Scholar]
- Jain H, Isaacson D, Edic PM, Newell JC. Electrical impedance tomography of complex conductivity distributions with noncircular boundary. IEEE Trans. Biomed. Eng. 1997;44:1051–60. doi: 10.1109/10.641332. [DOI] [PubMed] [Google Scholar]
- Knudsen K, Mueller J, Siltanen S. Numerical solution method for the dbar-equation in the plane. J. Comput. Phys. 2004;198:500–17. [Google Scholar]
- Kolehmainen V, Lassas M, Ola P. The inverse conductivity problem with an imperfectly known boundary. SIAM J. Appl. Math. 2005;66:365–83. [Google Scholar]
- Kotre CJ. Variations in in vivo electrical impedance tomography images due to inaccuracy in boundary representation. Med. Biol. Eng. Comput. 1996;34:355–8. doi: 10.1007/BF02520004. [DOI] [PubMed] [Google Scholar]
- Kunst PW, Bohm S h, Vazquez de Anda G, Amato MB, Lachmann B, Postmus PE, de Vries PM. Regional pressure volume curves by electrical impedance tomography in a model acute lung injury. Crit. Care Med. 2000a;28:178–83. doi: 10.1097/00003246-200001000-00029. [DOI] [PubMed] [Google Scholar]
- Kunst PW, Vazquez de Anda G, Bohm SH, Faes TJ, Lachmann B, Postmus PE, de Vries PM. Monitoring of recruitment and derecruitment by electrical impedance tomography in a model of acute lung injury. Crit. Care Med. 2000b;28:3891–5. doi: 10.1097/00003246-200012000-00025. [DOI] [PubMed] [Google Scholar]
- Kunst PW, Vonk Noordegraaf A, Hoekstra OS, Postmus PE, de Vries PM. Ventilation and perfusion imaging by electrical impedance tomography: a comparison with radionuclide scanning. Physiol. Meas. 1998;19:481–90. doi: 10.1088/0967-3334/19/4/003. [DOI] [PubMed] [Google Scholar]
- Liu L. PhD Thesis. University of Rochester; New York: 1997. Stability estimates for the two-dimensional inverse conductivity problem. [Google Scholar]
- Mueller JL, Siltanen S. Direct reconstructions of conductivities from boundary measurements. SIAM J. Sci. Comput. 2003;24:1232–66. (electronic) [Google Scholar]
- Nachman AI. Global uniqueness for a two-dimensional inverse boundary value problem. Ann. Math. 2. 1996;143:71–96. [Google Scholar]
- Siltanen S, Mueller J, Isaacson D. An implementation of the reconstruction algorithm of A. Nachman for the 2D inverse conductivity problem. Inverse Problems. 2000;16:681–99. [Google Scholar]
- Somersalo E, Cheney M, Isaacson D. Existence and uniqueness for electrode models for electric current computed tomography. SIAM J. Appl. Math. 1992;52:1023–40. [Google Scholar]
- Trigo FC, Gonzalez-Lima R, Amato MBP. Electrical impedance tomography using the extended kalman filter. IEEE Trans. Biomed. Eng. 2004;51:72–81. doi: 10.1109/tbme.2003.820389. [DOI] [PubMed] [Google Scholar]
- Vauhkonen PJ, Vauhkonen M, Savolainen T, Kaipio JP. Three-dimensional electrical impedance tomography based on the complete model. IEEE Trans. Biol. Eng. 1999;46:1150–60. doi: 10.1109/10.784147. [DOI] [PubMed] [Google Scholar]
- Victorino JA, et al. Imbalances in regional lung ventilation: a validation study on electrical impedance tomography. Am. J. Respir. Crit. Care Med. 2004;169:791–800. doi: 10.1164/rccm.200301-133OC. [DOI] [PubMed] [Google Scholar]


