Abstract
A basic evolutionary problem posed by the Iterated Prisoner’s Dilemma game is to understand when the paradigmatic cooperative strategy Tit-for-Tat can invade a population of pure defectors. Deterministically, this is impossible. We consider the role of demographic stochasticity by embedding the Iterated Prisoner’s Dilemma into a population dynamic framework. Tit-for-Tat can invade a population of defectors when their dynamics exhibit short episodes of high population densities with subsequent crashes and long low density periods with strong genetic drift. Such dynamics tend to have reddened power spectra and temporal distributions of population size that are asymmetric and skewed toward low densities. The results indicate that ecological dynamics are important for evolutionary shifts between adaptive peaks.
The Prisoner’s Dilemma game contains the basic paradox for the evolution of reciprocal altruism (1, 2). In this game, each of two players can either cooperate or defect. This leads to four possible payoffs S < P < R < T: if one player cooperates and the other defects, the cooperator gets S and the defector gets T, if both players cooperate they both get R, and if both defect they get P. No matter what the other does, it is always best to defect (R < T and S < P), but if both would cooperate they would both receive a higher payoff than if both defect (P < R). If payoffs are interpreted as Darwinian fitness, this game exemplifies the advantage of selfish mutants and the evolution of maladaptive noncooperative behavior. The paradox has a solution in the Iterated Prisoner’s Dilemma (1), in which opponents meet again with a certain probability. In this new game, the Tit-for-Tat (TFT) strategy—cooperate in the first round, then do whatever the opponent did in the previous round—does very well against a wide variety of other strategies (3). TFT captures the essence of reciprocal altruism (4), and once established, TFT can catalyze the evolution of even more cooperative strategies (5, 6). Thus, TFT represents a cornerstone in the evolution of cooperation, and it is important to determine the conditions under which TFT can evolve in a population of pure defectors.
We consider the evolutionary game between the strategies TFT and AD—always defect, regardless of the opponent’s decisions—in the Iterated Prisoner’s Dilemma. Let w be the probability that opponents meet again. Then the payoffs between TFT and AD are as shown in Table 1, in which the entries are the payoffs received by the strategy in the left column when playing against the strategy in the top row. For example, when TFT plays against AD, it gets S in the first round and P in all successive rounds, hence a total of S + wP + w2P + . . . . AD gets T in the first round and P thereafter. Thus the payoff for TFT is S + wP/(1 − w), whereas that of AD is T + wP/(1 − w). The other payoffs are calculated similarly. In a population consisting of a mixture of TFT and AD, the payoffs of the two strategies depend on their frequencies. If p is the frequency of TFT in the population, then the payoff for a TFT player in this population is
 |
1 |
and the payoff to an AD player is
 |
2 |
In turn, these payoffs determine the dynamics of the frequencies of TFT and AD. More precisely:
 |
3 |
where pt is the frequency of TFT at time t. If w > (T − R)/(T − P), the dynamics given by Eq. 3 have three equilibria: one in which TFT is absent (p = 0), one in which AD is absent (p = 1), and an intermediate equilibrium given by p* = (P − S)(1 − w)/[R + P(1 − 2w) − (1 − w)(T + S)]. The two extreme equilibria are locally stable, which means that both AD and TFT are evolutionary stable, that is, a population consisting of either strategy alone cannot be invaded by rare mutants of the other strategy. The intermediate equilibrium is unstable and represents a threshold; it is the minimal frequency that TFT has to reach to get established and replace AD. It has been argued (1, 7) that spatial structure can make it possible for TFT mutants to reach this frequency and invade an AD population because TFT individuals can profit from mutual cooperation when they are spatially aggregated. In a similar vein, we study the temporal clustering that is caused by genetic drift by putting the game into a population dynamic framework. To do this, we interpret the payoffs as growth rates in an ecological model that includes density dependence. The basic model we use is Bellow’s (8) difference equation
 |
4 |
(Fig. 1). Nt takes on integer values and gives the number of individuals present at time t. We include demographic stochasticity by interpreting the per capita fitness
 |
5 |
as the mean of the Poisson distributed offspring of each adult. This leads to an individual-based model exhibiting different dynamic regimes depending on parameter values (9), and we are interested in those regimes that exhibit irregular fluctuations (Fig. 1). For the game between TFT and AD, we extend the model by assuming that the intrinsic growth rate λ of each strategy is given by the payoff of the game:
 |
 |
6 |
The total population size Nt on the right-hand side of Eq. 6 is the sum of the population sizes of TFT and AD: Nt = NtTFT + NtAD. The growth rates λtTFT and λtAD are the frequency-dependent payoffs at time t resulting from the Iterated Prisoner’s Dilemma between TFT and AD. Thus we assume that the growth rates of the two strategies are frequency-dependent and that the population is regulated by the total number of individuals, regardless of which strategy they play. Deterministically, Eq. 6 yields nothing new; both pure populations are stable against invasion by mutants of the other strategy, and there is an intermediate unstable threshold equilibrium for the frequency of TFT.
Table 1.
Payoffs in the Iterated Prisoner’s Dilemma
| TFT | AD | |
|---|---|---|
| TFT | R/(1 − w) | S + wP/(1 − w) |
| AD | T + wP/(1 − w) | P/(1 − w) |
Figure 1.
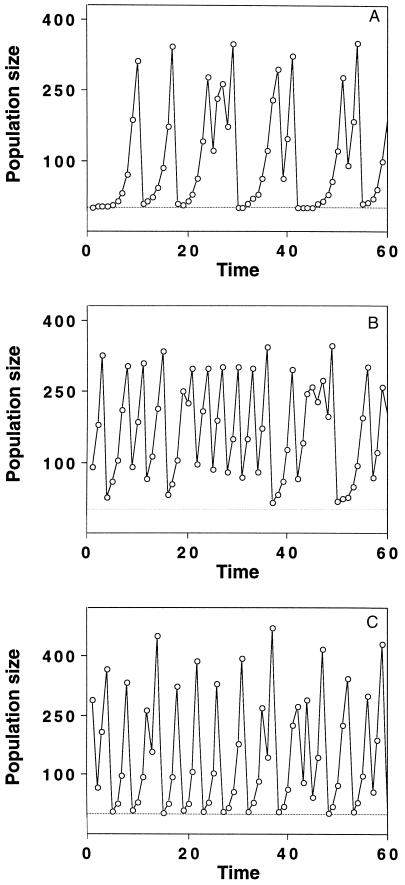
Three different types of dynamics of Eq. 4. In this model, the dynamic complexity is determined by the intrinsic growth rate λ and by the parameter b, which reflects the type of competition for resources that leads to density dependence. The parameter a scales the carrying capacity of Eq. 4, i.e., the population size at which the per capita fitness F(N), Eq. 5, is equal to 1 (8). For each of the Nt adults at time t, we randomly chose the number of offspring from a Poisson distribution with mean the value of the fitness function, Eq. 5, at the given population size Nt. The offspring add up to give Nt+1. Low values of λ together with high values of b yield crash dynamics with long periods of low population size (A; λ = 2.024, b = 6.8). Decreasing the competition parameter b (B; λ = 2.024, b = 4.5) or increasing λ (C; λ = 3.235, b = 4.8) leads to dynamics in which the long low density periods are absent. Severe crashes still occur with high λ (C). The parameter a was chosen so that the equilibrium density was 250 in all three panels and was set to a = 0.0038 in A, a = 0.0037 in B, and a = 0.0041 C.
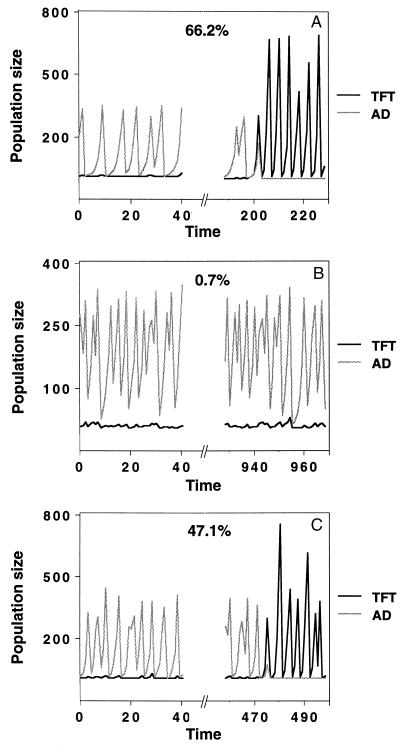
Things change, however, when demographic stochasticity is included. Starting with a population of AD and allowing for TFT mutants to appear sporadically, TFT can get established, depending on the ecological dynamics exhibited by the resident AD population (Fig. 2). There are two dynamic features that enable invasion. The first are population crashes, during which only very few individuals survive, among them by chance enough TFT mutants that had appeared previous to the crash, and the second are long periods of low population numbers following the crashes, in which genetic drift is important. For example, if the resident AD population exhibits the dynamics shown in Fig. 1A, both these effects are present, and TFT mutants are readily able to reach the threshold frequency due to chance events (Fig. 2A). In the dynamics of Fig. 1B, the crashes are not severe enough and the periods of low population size not long enough for TFT to invade (Fig. 2B), whereas in the dynamics of Fig. 1C, the periods of low population size are still very short, but because of the higher growth rate, the population outbreaks are larger, and the subsequent crashes are more severe than those in Fig. 1B. Therefore, TFT is able to invade (Fig. 2C), but not as easily as it does in Fig. 2A. Thus the type of dynamics exhibited by the resident AD population determines whether and how fast enough TFT mutants can aggregate due to chance events to cause an evolutionary shift to the TFT strategy.
Figure 2.
Invasion scenarios for different types of dynamics of the resident population. Eq. 6 was used with demographic stochasticity. Mutations from AD to TFT occur with a mutation rate that was set to 0.01 per generation. The runs were started with a pure AD population. In A, this resident population exhibited the dynamics shown in Fig. 1A (shaded line). TFT (solid line) typically invades after a short period of time. In B, in which the resident AD population exhibited the dynamics shown in Fig. 1B, the periods of low population size are too short and the crashes not severe enough for TFT to increase above the threshold frequency. In C, the resident AD population exhibited the dynamics from Fig. 1C. With these dynamics, TFT is often able to invade due to stochastic events during population crashes. The percentages shown in the panels indicate the number of times TFT was able to invade the corresponding AD resident in 1,000 simulation runs over 1,000 generations. Due to stochasticity, it is possible that the resident population goes extinct before invasion occurs. In such a case, we initialized the system in the next time step again with a number of resident AD individuals. This number was set to 8 in our simulations and could, for example, be thought of as an influx from neighboring populations in a spatially extended system. The parameters a and b in A–C were the same as the corresponding parameters in Fig. 1 A–C. The parameters for the payoff matrix were w = 0.58, S = 0, P = 0.85, R = 2.1, and T = 3.1 for A and B, and w = 0.66, S = 0, P = 1.1, R = 2.1, and T = 3.1 for C. Thus, the threshold frequency for TFT was p* = 0.539 in all three panels (A–C).
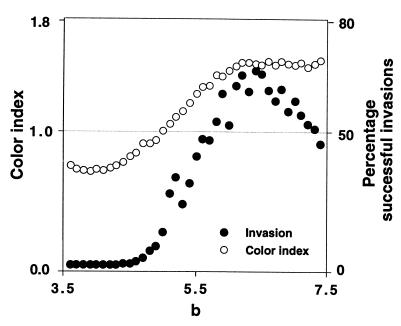
The shift from the evolutionary stable strategy AD to the evolutionary stable strategy TFT is analogous to Wright’s shifting balance between adaptive peaks (10). This indicates that our results may be relevant for general evolutionary questions concerning the speed of stochastic transitions between locally stable genetic configurations that are separated by unstable equilibria. It is therefore desirable to have a more precise description of the type of ecological dynamics that make such transitions most likely. As a first step in this direction, we calculated the power spectra of time series resulting for different parameter settings in our model by using the Fast Fourier Transform method described in (11) (Fig. 3). We classified these spectra by a color index (12) that roughly indicates whether high frequencies (blue spectra) or low frequencies (red spectra) dominate in the corresponding time series. The color index is defined as the ratio between the area under the lower half of the power spectrum and the area under the upper half of the power spectrum. If this ratio is <1, the upper half of the spectrum comprising the high frequencies is more important for explaining the fluctuations in the time series, whereas low frequencies are more important if the color index is >1. It is known that the color of spectra of Eq. 4 can change if the competition parameter b is varied, whereas the growth rate λ is fixed at a low value (12, 13). As b increases, the periods of low population size get larger (cf. Fig. 1). Therefore, the autocorrelation in the time series increases, which leads to power spectra that are dominated by low frequencies (14), hence to power spectra with larger color indices. Remarkably, exactly those ecological dynamics seem to allow stochastic invasion whose color index is >1 (Fig. 3). At present, this is no more than a curious observation, but since red spectra seem to be common in natural time series (15, 16), we speculate that stochasticity may be important for evolution in many natural systems.
Figure 3.
Success of TFT invasion attempts in relation to the power spectrum of the dynamics of the resident AD population. For a range of b values in Eq. 4, we calculated the power spectrum and the color index of the corresponding stochastic time series. For low b, the color index is <1 and indicates high frequency dominance. As the competition parameter b is increased, the color index increases above 1, which indicates red spectra. The solid circles show the percentage of successful TFT invasion attempts into a resident AD population exhibiting the dynamics corresponding to each b value. The invasion scenario was run 1,000 times for 1,000 generations for a given value of b. The computations were done for 41 equally spaced b values in the interval [3.5,7.5]. For low values of b, both dynamic features that allow invasion, long periods of low population size and population crashes, tend to be absent. For higher values of b, both features tend to be present. Invasion of TFT starts to be likely for values of b > 4.5, which is almost exactly the point at which the color index of the resident AD population increases above 1. The parameters for the figure were the same as in Fig. 2A, except that b was varied as described. In addition, we adjusted the parameter a in Eq. 4 so that the equilibrium density of the resident population was equal to 250 for all values of b. The parameter a does not influence the qualitative dynamic behavior of Eq. 4 (8) and hence does not influence the power spectra of the time series. The percentages of successful invasion attempts for high b depend on the mutation rate and on the length of the resident time series over which invasion was tested (here 1,000 generations). However, qualitatively, the shape of the invasion curve (solid circles) does not depend on these parameters.
As mentioned, the correlation between redness of the power spectrum of a resident time series and the probability of stochastic invasion of TFT is related to the fact that redness indicates a high autocorrelation in the resident time series. For example, the spectrum of the time series shown in Fig. 1A is reddened because of the long phases of low densities, during which demographic stochasticity and hence genetic drift are important. However, if the time series of Fig. 1A were inverted, e.g., reflected vertically at a population size of 200, so that previous low population sizes would be high and vice versa, then the autocorrelation would be retained, and the color of the spectrum would be exactly the same as before. Yet invasion of TFT would clearly be much less likely. Therefore, the color of a spectrum does not tell the whole story, and additional information about the distribution of the population sizes over time is needed. Such information is provided by the invariant measure of a population dynamic process (17). The invariant measure is the frequency distribution of the various population sizes that are attained at different points in time. The frequency distribution of the time series shown in Fig. 1A is asymmetric and skewed to low values because the population is at low densities most of the time, with only occasional excursions to high densities. In contrast, the invariant measure would be skewed to high values for the inverted time series. Therefore, a red power spectrum of the resident AD in combination with an invariant measure that is skewed to low population sizes is a strong indicator for high invasion probabilities.
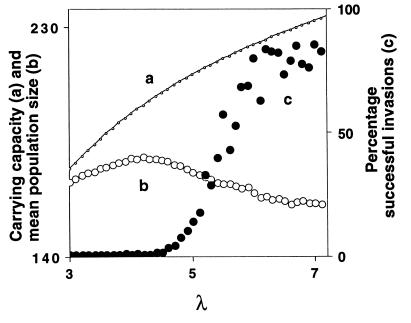
To show the influence of the skewness of the invariant measure on invasion probability of TFT, we have investigated the invasion success for a range of values for the intrinsic growth rate λ while keeping parameters a and b fixed (Fig. 4). For fixed a and b, increasing λ leads to an increase in the carrying capacity, i.e., to an increase in the population size at which the per capita fitness F(N) in Eq. 4 is equal to 1 (Fig. 4, curve a). However, increasing λ also increases the complexity and the size of the fluctuations in the system, and our simulations show that as a consequence, the skewness of the invariant measure toward low densities becomes more pronounced. This is reflected in decreasing mean population sizes of the resident AD population (Fig. 4, curve b). Thus, the mean population size decreases despite the fact that the carrying capacity, and with it the maximal population size in a time series, becomes larger for higher λ. For the parameter values examined in Fig. 4 autocorrelation in the resident time series is low, and crashes in the AD population are the main factor facilitating invasion of TFT. The progressive skewness and asymmetry of the invariant measure toward low population sizes reflects the fact that these crashes become more severe and more frequent for higher λ. Therefore, invasion success of TFT increases (Fig. 4, curve c). Fig. 4, which shows the effect of varying the parameter λ, together with Fig. 3, showing the effect of varying the parameter b, reveal two major correlates of the probability for stochastic transitions between the evolutionary equilibria corresponding to AD and TFT in our model: the skewness of the invariant measure toward low population sizes and the color of the power spectrum, which is a measure for the amount of autocorrelation in the resident time series.
Figure 4.
Carrying capacity, mean density, and invasion success as a function of λ for fixed a and b. The carrying capacity N* is defined by F(N*) = 1 in Eq. 5, and hence is given by N* = [ln(λ)]1/b/a. Even though the carrying capacity increases with increasing λ (curve a), the mean density (calculated as the arithmetic mean of the densities that the resident AD population attains in the course of 10,000 generations) decreases as λ and hence the complexity in the system increases (curve b). The decrease in the mean population size reflects an increasing asymmetry in the distribution of population sizes over time (i.e. in the invariant measure), which is increasingly skewed to lower population sizes, even though the maximal population size attained by the resident in a particular time series increases as the carrying capacity increases (data not shown). As a consequence of this asymmetry invasion success of TFT increases with λ (curve c). To calculate invasion success, we used the same procedure as for Fig. 3 for fixed a = 0.006 and b = 2, and for 43 equidistant values of λ in the interval [3, 7.2]. The boundaries of this interval were chosen such that the resident dynamics are unstable, but such that the fluctuations in the system are not unrealistically large. As λ increases, the complexity and the fluctuations in the system and hence the chance of a severe population crash increase.
If different genetic equilibria correspond to different population dynamic attractors, there can be an asymmetry in the probability of transition between these equilibria because the ecological attractors might influence stochastic effects differently. In fact, such an asymmetry occurs in our model because the growth rate in TFT populations is higher than in AD populations. In TFT populations, crashes still occur, and the invariant measure might still be skewed to low population sizes so that back invasions of AD are possible. However, with high growth rates, long periods of low population number are very rare, so that high autocorrelation leading to invasion by genetic drift is typically absent in TFT populations.
For many species showing altruistic behavior, it is as easy to imagine that they exhibited dynamics similar to that shown in Fig. 1A as it is difficult to determine whether this was actually the case, and hence whether chance events might have played a major role in the evolution of the cooperative behavior. For example, it has been argued that bottleneck episodes played a role in the evolution of egg trading in sea bass (1, 18). Another example may be found in termites, for which it has been argued that cyclical inbreeding played a role in the evolution of sociality by kin selection (19, 20). Cyclical inbreeding occurs because of local fluctuations in population size, which according to the theory presented here can also promote evolutionary change due to stochasticity. This example shows that in many cases cooperation may have evolved due to the concerted action of different factors such as kin selection and genetic drift. Such factors often operate with sporadic low population sizes, and we conclude by noting that the ecological dynamics required for stochastic events to be important can be obtained not only from the simple competition model used here but also from many other ecological models such as predator–prey or host–parasite models. Thus, in principle there are many ecological scenarios that could have led to the evolution of cooperative behavior by magnifying the effect of stochasticity in demographic processes.
Acknowledgments
We thank an anonymous referee for helpful suggestions. This research was supported by Schweizerischer Nationalfonds Grant 3100–43042.95 to M.D.
ABBREVIATIONS
- TFT
Tit-for-Tat
- AD
always defect
References
- 1.Axelrod R, Hamilton W D. Science. 1981;211:1390–1396. doi: 10.1126/science.7466396. [DOI] [PubMed] [Google Scholar]
- 2.Axelrod R. The Evolution of Cooperation. New York: Basic Books; 1984. [Google Scholar]
- 3.Axelrod R. J Conflict Resolution. 1980;24:379–403. [Google Scholar]
- 4.Trivers R. Q Rev Biol. 1971;46:35–57. [Google Scholar]
- 5.Nowak M A, Sigmund K. Nature (London) 1992;355:250–253. [Google Scholar]
- 6.Nowak M A, Sigmund K. Nature (London) 1993;364:56–58. doi: 10.1038/364056a0. [DOI] [PubMed] [Google Scholar]
- 7.Ferrière R, Michod R E. Am Nat. 1996;147:692–717. [Google Scholar]
- 8.Bellows T S., Jr J Anim Ecol. 1981;50:139–156. [Google Scholar]
- 9.May R M. Nature (London) 1976;261:459–467. doi: 10.1038/261459a0. [DOI] [PubMed] [Google Scholar]
- 10.Wright S. Annu Rev Genet. 1982;16:1–19. doi: 10.1146/annurev.ge.16.120182.000245. [DOI] [PubMed] [Google Scholar]
- 11.Cohen J E. Nature (London) 1995;378:610–612. doi: 10.1038/378610a0. [DOI] [PubMed] [Google Scholar]
- 12.Blarer A, Doebeli M. Nature (London) 1996;380:589–590. doi: 10.1038/380589b0. [DOI] [PubMed] [Google Scholar]
- 13.White A, Begon M, Bowers R G. Proc R Soc London B. 1996;263:1731–1737. [Google Scholar]
- 14.Press W H, Flannery B P, Teukolski S A, Vetterling W T. Numerical Recipes in C. Cambridge, U.K.: Cambridge Univ. Press; 1990. [Google Scholar]
- 15.Halley J M. Trends Ecol Evol. 1996;11:33–37. doi: 10.1016/0169-5347(96)81067-6. [DOI] [PubMed] [Google Scholar]
- 16.Ariño A, Pimm S L. Evol Ecol. 1995;9:429–443. [Google Scholar]
- 17.Doebeli M. J Theor Biol. 1995;173:377–387. doi: 10.1006/jtbi.1995.0070. [DOI] [PubMed] [Google Scholar]
- 18.Fischer E. Anim Behav. 1980;28:620–633. [Google Scholar]
- 19.Myles T G, Nutting W L. Q Rev Biol. 1988;63:1–23. [Google Scholar]
- 20.Hamilton W D. J Theor Biol. 1964;7:1–52. doi: 10.1016/0022-5193(64)90038-4. [DOI] [PubMed] [Google Scholar]


