Abstract
Objective
To validate a field test to assess the maximal and submaximal exercise aerobic adaptation under specific conditions, for endurance modality cyclists and triathletes.
Methods
30 male and 4 female endurance modality cyclists and triathletes, with heterogeneous performance levels, performed three incremental tests: one in the laboratory and two in the field. Assessment of the validity of the field protocol was carried out by the Student's t test, intraclass correlation coefficient (ICC) and coefficient of variation (CV) of the maximal variables (maximal aerobic speed (MAS), maximal aerobic power (MAP), maximal heart rate (HRmax), maximal blood lactate concentration ([La−]max) and maximal oxygen uptake (VO2max)) and submaximal variables (heart rate, HR) measured in each one of the tests. The errors in measurement were calculated. The repeatability of the field tests was assessed by means of the test–retest of the two field tests, and the validity by means of the test–retest of the laboratory test with respect to the mean of the two field tests.
Results
No significant differences were found between the two field tests for any of the variables studied, but differences did exist for some variables between the laboratory tests with respect to the field tests (MAP, [La−]max, humidity (H), barometric pressure (Pb) and some characteristics of the protocols). The ICC of all the variables was high and the CV for the MAP was small. Furthermore, the measurement errors were small and therefore, assumable.
Conclusions
The incremental protocol of the proposed field test turned out to be valid to assess the maximal and submaximal aerobic adaptation.
The monitoring of different physiological variables (heart rate (HR), blood lactate concentration (La−) and oxygen uptake (VO2)) and mechanical variables (speed (S) and mechanical power output (P)) has been performed for decades to assess the adaptation to exercise in cyclists and, more recently, in triathletes. These types of test used to be conducted in the laboratory in order to have greater control over the measurement conditions. Thanks to technological developments, many of these variables can now be validly and reliably measured in training and competition situations.1 Functional field evaluation opens up new perspectives. It is also a useful tool to assess the specific adaptation of athletes, overcoming the problems posed by the functional laboratory evaluation on cycloergometer.2
Specificity plays a very important part in the functional evaluation of athletes. In this sense, different authors have tried to reproduce the specificity of cyclists with their actual bicycle in different manners: on treadmills,3 in a wind tunnel4,5,6 on rollers,7,8 in velodromes,9,10,11,12,13,14,15 on the road16,17,18,19 and even in towns.15 The majority of the existing studies on cycling‐specific tests deal with the relationship between the displacement speed and the energy expenditure12,15,17,19,20 or the mechanical power output,14,16,18 and there are only a few authors who have validated specific protocols. Some have proposed triangular protocols in the velodrome to determine the anaerobic threshold by means of the heart method,11 to estimate the maximal oxygen uptake (VO2max),10 or to assess the functional maximal aerobic power (MAP);15 others have reported rectangular protocols to assess the economy.12,13
The only studies available in the literature that validate a field protocol to measure maximal and submaximal variables with respect to a reference test in laboratory are those proposed by Leger et al.9 and Padilla et al.13 The first has a triangular nature, is non‐invasive and economical to apply, but it presents a series of important biases and methodological errors to be considered. The second has a rectangular nature and is invasive, as samples of lactate in blood have to be taken. In this case, the MAP of the athlete must also be previously known to determine the protocol. Therefore, no validated field test has been found in the literature with a system that validly measures the mechanical power output, with a standardised protocol for a broad population, and which is specific, of a triangular nature, non‐invasive and easy and economical to apply. The objective of this study was to validate a field test to assess the maximal and submaximal aerobic adaptation to exercise under specific conditions, for endurance modality cyclists and triathletes.
Methods
Subjects
Thirty male and four female national‐level and international‐level mountain bikers (n = 4), road cyclists (n = 11) and triathletes (n = 19) participated in this study, satisfying the following inclusion criteria: having >2 years' competitive experience, being active, not having any illness or injury and having a VO2max of over 50 ml/kg/min. Values of subjects' mean (SD) age, height and weight were the following: 24 (5) years, 176.3 (6.6) cm and 69.4 (7.6) kg. The mean level of competitive experience was 4.5 (1.7) years. All experimental procedures were approved by the Ethics Committee of the High Performance Centre of Sant Cugat, Barcelona, Spain, all subjects gave written informed consent prior to testing.
Experimental design
The experimental protocol consisted of performing three tests. The first was performed on a cycloergometer with electromagnetic brake (Cardgirus, G&G Innovación, La Bastida, Alava, Spain) and acted as gold standard. During the same week, two sessions were carried out to familiarise participants with the track cycle (traditional aluminium track bike with conventional handlebar and wheels with aluminium spokes), the velodrome and the field protocol. Then, the second and third tests were performed in the velodrome with a week's gap between them. They took place in the afternoon to control the effect of biorhythms on performance.21 The training and nutritional conditions under which the athletes performed the tests were controlled, programming an active rest during the 48 h prior to each test (1‐h cycling at 50% MAP) and a carbohydrate‐rich diet (80%) during the 3 days prior to each test.
Incremental laboratory tests
After 10‐min warm‐up at 100 W, the test began at an initial load of 130 W for the women and 200 W for the men. Then, 30‐W load increases were made every 4 min until R⩾1. From then on increases of 10 W/min were made until exhaustion. The VO2 and the HR were measured in real time, breath by breath, during the whole test, by means of an indirect integrated calorimetry system (Quark PFT, Cosmed, Rome, Italy). The MAP was calculated by means of the equation proposed by Kuipers et al.22 The VO2max was determined as the mean value of the VO2 of the last 30‐s effort, when at least two criteria recommended by the British Association of Sport and Exercise Sciences23 were satisfied. The blood lactate concentration [La−] was measured with a portable lactate analyser (Lactate Pro, Arkray, Kyoto, Japan) at the third minute after the end of the effort, being considered this register as the [La−]max.24 Blood samples were taken from the ear lobe.
Incremental field test
After 10‐min warm‐up, the test began with an initial load corresponding to the 50% MAP of the laboratory test. The load increases were 12.5 W/min in order to reach exhaustion in no more than 20 min,25 which was the expected duration of the laboratory test. The displacement speed was estimated by means of the equation of Di Prampero et al16 and was imposed by means of an acoustic pacemaker with a laptop PC, amplifying it with a sound system placed in the centre of the track. The athletes made the signal coincide with each one of the two persecution lines that divide the wooden velodrome into two 125 m parts. The test ended when the athlete accumulated a 5 m delay with respect to the line.17 The bicycle tyre pressure was inflated to 133.8 ψ and the environmental variables (temperature (°C), H (%) and Pb (mm Hg)) were controlled and validated by the Fabra observatory of Barcelona. The wind velocity was measured with an anemometer Speedwatch (JDC Electronic SA, Yverdon‐les‐Bains, Switzerland), although it was disregarded to calculate MAP and VO2max. The displacement speed and mechanical power output were directly measured by means of an SRM crank dynamometer (Schoberer Rad Meβtechnik, Jülich, Germany).26 The VO2max reached at the end of the test was estimated by means of the equation of Di Prampero et al.16
Statistical analysis
Descriptive statistics were generated for all variables. The following were used to measure the absolute reliability: Student's t test, intraclass correlation coefficient (ICC) and coefficient of variation (CV) of the maximal variables (maximal aerobic speed (MAS), MAP, HRmax, [La−]max and VO2max) and submaximal variables (HR). The determination of the Pearson correlation coefficient was used to verify the existence of relationships between the different variables studied, taking the relationships into account when r⩾0.8; in addition, the SEE and the 95% CI of the previous correlations were calculated. Significance level was determined at p<0.05 for all statistical tests carried out. The repeatability and validity of the field test was assessed by studying the reliability by means of the test–retest between the two field tests and between the laboratory test and the mean of the two field tests, respectively. The confidence limits of Bland and Altman27 were calculated to assess the measurement errors.
Results
Repeatability of the field test
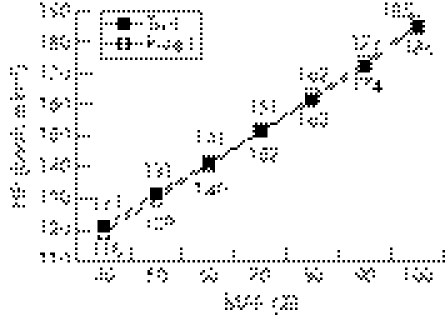
The results from adapting the study sample to the field tests did not show remarkable differences for any of the maximal variables (MAP, MAS, HRmax and [La−]max; table 1) and submaximal variables (HR; fig 1) studied.
Table 1 Comparison of field tests (mean±DE).
| Test | Retest | |
|---|---|---|
| P0 (%MAP) | 51.4 (6.3) | 51.6 (6.2) |
| ΔP (W) | 11.7 (1.9) | 11.7 (1.6) |
| MAP (W) | 404 (63) | 412 (64) |
| S0 (km/h) | 30.6 (1.8) | 30.7 (1.5) |
| ΔS (km/h) | 0.65 (0.04 ) | 0.65 (0.03) |
| MAS (km/h) | 41.5 (1.7) | 41.8 (1.8) |
| HRmax (beats/min) | 185 (11) | 186 (12) |
| [La−]max (mM) | 6.9 (1.7) | 7.0 (1.8) |
| PCmax (rpm) | 99 (4) | 100 (4) |
| VWind (km/h) | 1.9 (2.1) | 1.6 (1.7) |
| T (min:s) | 17:38 (02:07) | 18:12 (02:01) |
| Ta (°C) | 20.3 (5.0) | 21.1 (4.6) |
| H (%) | 62.1 (15.1) | 68.0 (16.6) |
| Pb (mm Hg) | 728.4 (3.6) | 728.1 (3.5) |
P0, initial load; ΔP, load increase; MAP, maximal aerobic power; S0, initial speed; ΔS, speed increase; MAS, maximal aerobic speed measured with the SRM; HRmax, maximal heart rate; [La−]max, maximal blood lactate concentration; PCmax, maximal pedalling cadence; VWind, mean wind velocity; T, total duration; Ta, temperature; H, relative humidity; Pb: barometric pressure.
Figure 1 Comparison of the heart rate (HR) at each one of the relative work intensities among field tests. MAP, maximal aerobic power.
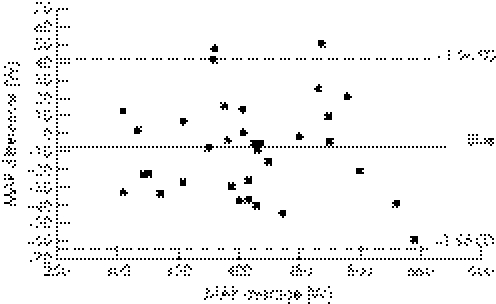
Some high and significant ICC values were obtained for the repeated measurements of each one of the maximal variables studied: MAP (0.953; p<0.001), HRmax (0.931; p<0.001), [La−]max (0.787; p<0.001) and MAS (0.890; p<0.001; SEE and 95% CI of ICC are presented in table 2); and a relatively low CV for the MAP (15 %). The Bland–Altman plots showed that in the MAP measurement the bias ± random error was −8.1±52.6 W, with a bias close to zero (−8.1 W or 2%) and great accuracy. Furthermore, 95% of the differences or CI of those measurements was located from 44.5 to −60.7 W, there being an acceptable random error that could be considered to be acceptably small for the type of test assessed (fig 2).
Table 2 Standard error of the estimate and 95% CI for the variables that CCI has been calculated for.
| SEE (95% CI) | |
|---|---|
| MAP (W) | 35.2 (0.906 to 0.977) |
| MAS (km/h) | 1.5 (0.781 to 0.945) |
| HRmax (beats/min) | 7 (0.857 to 0.967) |
| [La−]max (mM) | 1.8 (0.564 to 0.896) |
HRmax, maximal heart rate; [La−]max, maximal blood lactate concentration MAP, maximal aerobic power; MAS, maximal aerobic speed.
Figure 2 Repeatability of the field test. MAP, maximal aerobic power.
Taking all these results into account, the proposed field protocol was considered to be repeatable.
Validity of the field test
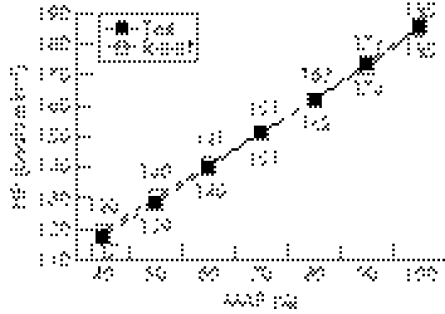
The results from adapting the study sample to the laboratory test with respect to the mean of the two field tests did not show any significant differences for the HRmax (table 3) or for the submaximal HR, either, at each one of the relative work intensities (fig 3). Significant differences were found between the protocols for variables P0, ΔP and t and in some maximal (MAP, [La−]max and PCmax) and environmental (H and Pb) variables (table 3)
Table 3 Comparison of the laboratory test with respect to the field tests (mean±DE).
| Laboratory test (test) | Field test avg. (retest) | |
|---|---|---|
| P0 (%) | 28.6 (3.4) | 51.5 (5.4)*** |
| ΔP (W/min) | 7.7 (0.8) | 11.7 (1.4)*** |
| MAP (W) | 354.7 (41.3) | 407.8 (61.9)*** |
| HRmax (ppm) | 185 (11) | 184 (12) |
| [La−]max (mM) | 8.4 (2.6) | 6.9 (1.6)** |
| PCmax (rpm) | 87.7 (10.0) | 99.7 (3.9)*** |
| T (min:s) | 23:54 (03:27) | 17:55 (01:53)*** |
| Ta (°C) | 21.8 (1.9) | 20.7 (4.0) |
| H (%) | 59.7 (7.3) | 65.0 (13.0)* |
| Pb (mm Hg) | 747.7 (12.0) | 728.2 (2.8)*** |
P0, initial load; ΔP, load increase; MAP, maximal aerobic power; HRmax, maximal heart rate; [La−]max, maximal lactatemia; PRmax, maximal pedalling rate; T, total duration of test; Ta temperature; H, relative humidity; Pb, atmospheric pressure; NSD, no significant differences.
*p<0.05; **p<0.01; ***p<0.001.
Figure 3 Comparison of the submaximal heart rate (HR) between the laboratory test and the field tests. MAP, maximal aerobic power.
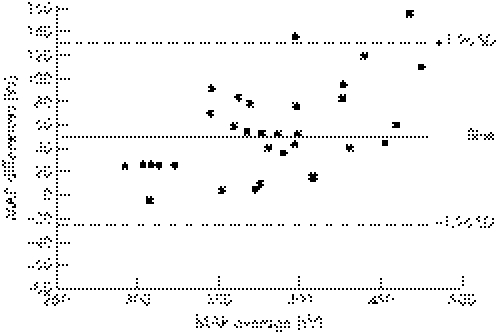
Some high and significant ICC were obtained for the repeated measurements of the maximal variables MAP (0.838; p<0.001), HRmax (0.862; p<0.001), but not for the [La−]max (0.474; p<0.05; SEE and 95% CI of ICC are presented in table 4). A relatively low CV was found for the MAP (13%). By contrast, the Bland–Altman plots showed a bias ± random error of 53.2 (77.1) W, with a small bias (53.2 W or 13.9%) and acceptable accuracy in the MAP measurement. The 95% value of the differences or CI of these measurements ranked from 130.2 to −23.9 W, showing an acceptable random error that can be considered to be acceptably small for the type of test assessed (fig 4). Finally, no significant differences were found between the VO2max measured in laboratory and that estimated in the field tests (61.5±5.9 vs 62.9±9.4 VO2max, respectively).
Table 4 Standard error of the estimate (SEE) and 95% CI for the variables that CCI has been calculated for.
| SEE | 95% CI | |
|---|---|---|
| MAP (W) | 83.7 | 0.675 to 0.919 |
| HRmax (ppm) | 9 | 0.725 to 0.931 |
| [La−]max (mM) | 3.7 | −0.053 to 0.737 |
HRmax, maximal heart rate; [La−]max, maximal blood lactate concentration MAP, maximal aerobic power.
Figure 4 Validity of the field test. MAP, maximal aerobic power.
Taking all these results into account, the proposed field protocol was considered to be valid.
%MAS–%MAP relationship
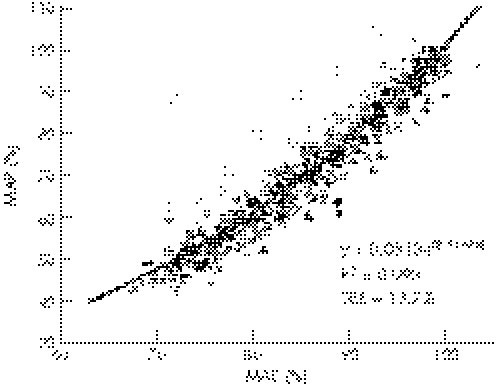
The %MAS–%MAP relationship was represented by means of the function %MAP = 0.0818e(2.5167% MAS), obtaining a high coefficient of determination (R2 = 0.998) and an acceptable SEE (13.7%; fig 5).
Figure 5 Relationship between the %MAS (maximal aerobic speed) and the mean %MAP (maximal aerobic power) of the study subjects.
Discussion
By means of typical statistics to assess the absolute reliability in this type of study9,10,11,12,13,15 and of the measurement errors,27 the results indicated a high absolute reliability for the validity study (see Results: validity of the field test section) and especially for the repeatability study (see Results: repeatability of the field test section).
Repeatability of the field test
There was a random error of ±12.9% in the repeatability study, which was not entirely explained by the variability of the SRM system (±1.8%).28 The remaining ±11.1% (±45 W) was due to other variables29 such as repetition (only two test repetitions were carried out). The bias of 2% was assumed in its entirety to be a result of the accuracy of the SRM system (2.5%).30 Consequently, the errors were small, and the field protocol was considered to be repeatable.
Validity of the field test
There was a random error of ±20.2% in the validity study which was not entirely explained by the variability of the SRM system (±1.8%).28 The remaining ±18.4% (±75 W) was due to other variables29 such as repetition, differences in the environmental variables (wind effect, differences in H and Pb), and biomechanical differences (cycloergometer vs track bicycle adaptation, curve effect,31 and differences in protocols). The bias was 13.9% and was not entirely explained by the bias introduced by the measurement systems (SRM (2.5%)30 and cycloergometer (2–4%)32). Although the Cardgirus cycloergometer has not been validated in any study, the error guaranteed by its manufacturer is ±2%, within the range obtained with other electromagnetic brake cycloergometers.32 The remaining 7.4% (30 W) was due to other variables:29 the same ones that affected the random error plus a measurement error of the SRM system that was not indicated by the manufacturer. The SRM measures the mechanical power output by means of the function:
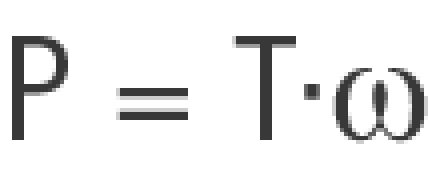 |
where T is the torque expressed in N/m (T = Fd, being F the force measured by the SRM system (N), and d the length of the crank (m)) and ω is the angular velocity, expressed in rad/s and obtained from the pedalling rate also measured by the SRM system (ω = 2Π (rpm/60)).26 In contrast, following the classical physics this calculation would have to be carried out with another equation, which would consider the non‐uniform behaviour of the pedalling rate. Assuming a uniform acceleration of the pedalling rate during each differential of time, the instantaneous mechanical power output is calculated by:
 |
where ω0 is the initial pedalling rate and Δω is the differential of the pedalling rate. The average value of mechanical power output would be obtained by calculating the mean of the instantaneous values. The difference between the SRM and these proposed equations could probably explain part of the random error. However, the measurement errors were small, and the field protocol was considered to be valid.
By contrast, the differences found in the MAP between the laboratory test and the field tests had no influence on the aerobic adaptation and the estimation of the VO2max, as suggested by other authors.33
This study assessed the validity of a triangular test in velodrome evaluating the relationship between the aerobic adaptation and the mechanical power output measured directly with the SRM system in endurance cyclists and triathletes. All the tests reported in the literature (see above) are not well standardised9,10,12 except for the Padilla et al13 protocol, which is of a different nature. In the present study, the initial load corresponded to 50% MAP and the load increase was 0.65 km/h/min or 11.7 W/min, similar to those used by Leger et al9 (1 MET·2 min−1) and Ricci and Leger10 (1–2 km/h⋅2 min−1), in spite of the fact that these other protocols are not strictly progressive: that of Leger et al9 because the progressiveness is biased as suggested by the actual authors and others because they do not carry out homogeneous speed increases.10,12 Where all the studies do coincide is in ending the test when exhaustion is reached, which in the present study was when the athlete accumulated a 5‐m delay with respect to the reference line.17
In this study, the performance (MAS) of the sample (41.7 km/h) was greater than in others (39.7 and 39.3 km/h).10,12 Furthermore, the same aerobic adaptation was observed between the laboratory test and the field tests for each one of the relative work intensities studied, in agreement with that observed by other authors.10,13 On the other hand, [La−]max in this study was greater in the laboratory test than in the field tests (6.9 vs 8.4 mM), unlike other authors who did not find any significant differences,10 and others who found opposing values (higher in the field test than in the laboratory test).13 The greater [La−]max obtained in laboratory could be due to the greater duration of this test with respect to the field test (23:54 vs 17:55 min; p<0.001, respectively), although paradoxically it was reached with a higher pedalling rate in the velodrome than in the laboratory (99.7 vs 87.7 rpm; p<0.001, respectively), so the [La−]max would have to have been greater in the velodrome due to a greater use of fast‐twitch fibres and to the glucolysis activity.34 A possible reason may be that perhaps these athletes have a greater economy of motion on the track, due to the specific nature of the activity.
Standardised protocols
In agreement with the mean data of the field tests, four protocols for both sexes were standardised, depending on the performance level. The estimation of the mechanical power output and VO2 for each stage of the protocols was carried out by means of the Di Prampero et al16 equation, using the mean morphological variables of the study group (M = 69.4 kg, Pb = 747.7 mm Hg, Ta = 295 K and ASC = 1.84 m2). The speed increases were the same for the different protocols (0.65 km/h/min), while the initial speed changed for each one. The proposal was: protocol A for young cyclists and triathletes (Vo = 22.0 km/h; table 5), protocol B for junior cyclists and national level triathletes (Vo = 27.0 km/h; table 6), protocol C for U23 cyclists and international level triathletes (Vo = 32.0 km/h; table 7) and protocol D for professional cyclists and triathletes (Vo = 37.0 km/h; table 8). The VO2 was not estimated for protocol D because the Di Prampero et al16 equation overestimates considerably the VO2max for those speeds.
Table 5 Protocol A standardisation.
| Steps | S (km/h) | P (W) | VO2 (ml/kg/min) |
|---|---|---|---|
| 1 | 22.0 | 63 | 15.6 |
| 2 | 22.7 | 67 | 16.4 |
| 3 | 23.3 | 72 | 17.3 |
| 4 | 24.0 | 77 | 18.3 |
| 5 | 24.6 | 82 | 19.3 |
| 6 | 25.3 | 88 | 20.3 |
| 7 | 25.9 | 94 | 21.4 |
| 8 | 26.6 | 100 | 22.6 |
| 9 | 27.2 | 106 | 23.8 |
| 10 | 27.9 | 113 | 25.1 |
| 11 | 28.5 | 120 | 26.4 |
| 12 | 29.2 | 127 | 27.7 |
| 13 | 29.8 | 134 | 29.2 |
| 14 | 30.5 | 142 | 30.7 |
| 15 | 31.1 | 150 | 32.2 |
| 16 | 31.8 | 159 | 33.8 |
| 17 | 32.4 | 168 | 35.5 |
| 18 | 33.1 | 177 | 37.2 |
| 19 | 33.7 | 186 | 39.0 |
| 20 | 34.4 | 196 | 40.9 |
Table 6 Protocol B standardisation.
| Steps | S (km/h) | P (W) | VO2 (ml/kg/min) |
|---|---|---|---|
| 1 | 27.0 | 104 | 23.4 |
| 2 | 27.7 | 111 | 24.7 |
| 3 | 28.3 | 117 | 26.0 |
| 4 | 29.0 | 125 | 27.3 |
| 5 | 29.6 | 132 | 28.7 |
| 6 | 30.3 | 140 | 30.2 |
| 7 | 30.9 | 148 | 31.7 |
| 8 | 31.6 | 156 | 33.3 |
| 9 | 32.2 | 165 | 35.0 |
| 10 | 32.9 | 174 | 36.7 |
| 11 | 33.5 | 183 | 38.5 |
| 12 | 34.2 | 193 | 40.3 |
| 13 | 34.8 | 203 | 42.2 |
| 14 | 35.5 | 213 | 44.2 |
| 15 | 36.1 | 224 | 46.3 |
| 16 | 36.8 | 235 | 48.4 |
| 17 | 37.4 | 247 | 50.6 |
| 18 | 38.1 | 259 | 52.9 |
| 19 | 38.7 | 271 | 55.2 |
| 20 | 39.4 | 284 | 57.6 |
Table 7 Protocol C standardisation.
| Steps | S(km/h) | P (W) | VO2 (ml/kg/min) |
|---|---|---|---|
| 1 | 32.0 | 162 | 34.5 |
| 2 | 32.7 | 171 | 36.2 |
| 3 | 33.3 | 180 | 37.9 |
| 4 | 34.0 | 190 | 39.7 |
| 5 | 34.6 | 200 | 41.6 |
| 6 | 35.3 | 210 | 43.6 |
| 7 | 35.9 | 221 | 45.6 |
| 8 | 36.6 | 232 | 47.7 |
| 9 | 37.2 | 243 | 49.9 |
| 10 | 37.9 | 255 | 52.2 |
| 11 | 38.5 | 267 | 54.5 |
| 12 | 39.2 | 280 | 56.9 |
| 13 | 39.8 | 293 | 59.4 |
| 14 | 40.5 | 306 | 61.9 |
| 15 | 41.1 | 320 | 64.6 |
| 16 | 41.8 | 335 | 67.3 |
| 17 | 42.4 | 349 | 70.1 |
| 18 | 43.1 | 364 | 73.0 |
| 19 | 43.7 | 380 | 75.9 |
| 20 | 44.4 | 396 | 79.0 |
Table 8 Protocol D standardisation.
| Steps | S (km/h) | P (W) |
|---|---|---|
| 1 | 37.0 | 240 |
| 2 | 37.7 | 251 |
| 3 | 38.3 | 264 |
| 4 | 39.0 | 276 |
| 5 | 39.6 | 289 |
| 6 | 40.3 | 302 |
| 7 | 40.9 | 316 |
| 8 | 41.6 | 330 |
| 9 | 42.2 | 345 |
| 10 | 42.9 | 360 |
| 11 | 43.5 | 375 |
| 12 | 44.2 | 391 |
| 13 | 44.8 | 407 |
| 14 | 45.5 | 424 |
| 15 | 46.1 | 442 |
| 16 | 46.8 | 459 |
| 17 | 47.4 | 478 |
| 18 | 48.1 | 496 |
| 19 | 48.7 | 516 |
| 20 | 49.4 | 535 |
To calculate the MAS as accurately as possible the following formula was proposed:
 |
where Sf is the speed of the last complete stage (km/h), t is the time the last stage was maintained (s), d is the duration of the last stages of the test (60 s in this case) and ΔS is the differential speed between the last stages of the test (0.65 km/h in this case).
%MAS–%MAP relationship
By contrast, the %MAS–%MAP relationship has been proved to be a good tool to estimate the relative work intensity (%MAP) at which an athlete cycles in the velodrome and with controlled atmospheric variables, if the current displacement speed and the MAS are known. In this study, a high correlation coefficient (0.997) and an acceptable SEE (13.7%) for this relationship were found. Marion and Leger12 found a smaller correlation coefficient (0.981) and SEE (5.7%). This may be due to the different methodology used to calculate the %MAP. In the present study the %MAP was calculated by means of the mechanical power output measured by the SRM, while these other authors estimated the VO2 in the velodrome by means of retroextrapolation and expressed it as a percentage of the VO2max calculated in the laboratory.12 Consequently, in spite of the smaller SEE, the methodology used in the present study seems to be more accurate.
In conclusion, the results of this study indicate that the field test proposed is valid to assess the aerobic exercise adaptation in endurance cyclists and triathletes, under specific conditions. The %MAS–%MAP relationship is a good tool to estimate the %MAP that an athlete develops in the velodrome.
What is already known on this topic
Of all the protocols to evaluate the aerobic adaptation on velodrome cyclists referred to in the literature, most have not been properly validated.
Others have compared the cardiovascular and metabolic response in velodrome with respect to that obtained in the laboratory.
However, no other reports have been validated by comparing the mechanical power output in the velodrome with respect to that of the laboratory.
Nowadays, by means of power meters, it is possible to measure the mechanical power output under training‐specific and competition‐specific conditions.
What this study adds
This study has validated a triangular protocol to exhaustion in the velodrome to evaluate the aerobic adaptation of cyclists and triathletes by means of the SRM power meter.
In addition, different kinds of protocols have been proposed depending on the athlete's performance level.
Acknowledgements
The authors express their gratitude to the participating athletes for their cooperation.
Abbreviations
ICC - intraclass correlation coefficient
MAP - maximal aerobic power
MAS - maximal aerobic speed
Footnotes
Funding: This work was supported by a grant (DOGC no 3885 16.05.2006) from the Direcció General de l'Esport, Generalitat de Catalunya.
Competing interests: None declared.
References
- 1.Boulay M R. Physiological monitoring of elite cyclists. Sports Med 1995201–11. [DOI] [PubMed] [Google Scholar]
- 2.Too D. Biomechanics of cycling and factors affecting performance. Sports Med 199010286–302. [DOI] [PubMed] [Google Scholar]
- 3.Hagberg J M, Mullin J P, Bahrke M.et al Physiological profiles and selected psychological characteristics of national class American cyclists. J Sports Med 197919341–346. [PubMed] [Google Scholar]
- 4.Firth M S. A sport‐specific training and testing device for racing cyclists. Ergonomics 198124565–571. [Google Scholar]
- 5.La Voie N F, Mercer T M, Ciolfi M A. VO2max of competitive cyclists using a conventional cycle ergometer test versus a sport‐specific bicycle test. In: Burke ER, Newsom MM, eds. Medical and scientific aspects of cycling. Champaign, IL: Human Kinetics, 1988; 141–5
- 6.Seifert J G, Langenfeld M E. The use of windload simulators for VO2max determination and bicycling research. In: Burke ER, Newsom MM, eds. Medical and scientific aspects of cycling. Champaign, IL: Human Kinetics, 1988; 117–20
- 7.Jensen K, Johansen L. Reproducibility and validity of physiological parameters measured in cyclists riding on racing bikes placed on a stationary magnetic brake. Scand J Med Sci Sports 199881–6. [DOI] [PubMed] [Google Scholar]
- 8.Withers R T, Van der Ploeg G, Finn J P. Oxygen deficits incurred during 45, 60, 75 and 90‐s maximal cycling on air‐braked ergometer. Eur J Appl Physiol 199367185–191. [DOI] [PubMed] [Google Scholar]
- 9.Leger L, Thibault M G, Gode M J ‐ M. Épreuve cycliste progressive sur piste pour determiner la puissance aérobie maximale et fonctionnelle. Med Sport 198256454–460. [Google Scholar]
- 10.Ricci J, Leger L A. VO2max of cyclists from treadmill, bicycle ergometer and velodrome tests. Eur J Appl Physiol 198350283–289. [DOI] [PubMed] [Google Scholar]
- 11.Conconi F, Borsetto C H, Casoni I.et al Noninvasive determination of the anaerobic threshold in cyclists. In: Burke ER, Newsom MM, eds. Medical and scientific aspects of cycling. Champaign, IL: Human Kinetics, 1988; 79–91
- 12.Marion G A, Leger L A. Energetics of indoor track cycling in trained competitors. Int J Sports Med 19889234–239. [DOI] [PubMed] [Google Scholar]
- 13.Padilla S, Mujika I, Cuesta G.et al Validity of a velodrome test for competitive road cyclists. Eur J Appl Physiol . 1996;73446–451. [DOI] [PubMed]
- 14.Bassett D R, Kyle C R, Passfield L.et al Comparing cycling world hour records, 1967–1996: modelling with empirical data. Med Sci Sports Exerc 1999311665–1676. [DOI] [PubMed] [Google Scholar]
- 15.Van Baak M A, Binkhorst R A. Oxygen consumption during outdoor recreational bicycling. Ergonomics 198124725–733. [DOI] [PubMed] [Google Scholar]
- 16.Di Prampero P E, Cortilli G, Mognoni P.et al Equation of motion of a cyclist. J Appl Physiol 197947201–206. [DOI] [PubMed] [Google Scholar]
- 17.McCole S D, Claney K, Conte J ‐ C.et al Energy expenditure during bicycling. J Appl Physiol 199068748–753. [DOI] [PubMed] [Google Scholar]
- 18.Olds T S, Norton K I, Lowe E L A.et al Modelling road‐cycling performance. J Appl Physiol 1995781596–1611. [DOI] [PubMed] [Google Scholar]
- 19.Pugh L C G E. The relation of oxygen intake and speed in competition cycling and comparative observations on the bicycle ergometer. J Physiol 1974241795–808. [DOI] [PMC free article] [PubMed] [Google Scholar]
- 20.Davies C T M. Effect of air resistance on the metabolic cost and performance of cycling. Eur J Appl Physiol 198045245–254. [DOI] [PubMed] [Google Scholar]
- 21.Atkinson G, Reilly R. Circadian variation in sports performance. Sports Med 199621292–312. [DOI] [PubMed] [Google Scholar]
- 22.Kuipers H, Verstappen F T J, Keizer H A.et al Variability of aerobic performance in the laboratory and its physiological correlates. Int J Sports Med 19856197–201. [DOI] [PubMed] [Google Scholar]
- 23.Birds S, Davidson R. eds. Guidelines for the physiological testing of athletes. Leeds: British Association of Sport and Exercise Sciences, 1997;59–65
- 24.Freund H, Oyono‐Enguelle S, Heitz A.et al Comparative lactate kinetics after short and prolonged submaximal exercise. Int J Sports Med 199011284–288. [DOI] [PubMed] [Google Scholar]
- 25.Billat L V, Koralsztein J P. Significance of the velocity at VO2max and time to exhaustion at this velocity. Sports Med 19962290–108. [DOI] [PubMed] [Google Scholar]
- 26.Jones L N. ed. Clinical exercise testing. Philadelphia: WB Saunders Company, 1988
- 27.Bland J M, Altman D J. Statistical methods for assessing agreement between two methods of clinical measurement. Lancet 19861307–310. [PubMed] [Google Scholar]
- 28.Jones S M, Passfield L. The dynamic calibration of bicycle power measuring cranks. In: Haake SJ, ed. The Engineering of Sport. Oxford: Blackwell Science, 1998; 265–74
- 29.Hulley S B, Cummings S R. Measurement planning: precision and accuracy. In: Hulley SB, Cummings SR, eds. Design of clinic investigation. An epidemiological overview. Madrid: Harcourt Brace de España, 1997; 35–46
- 30.Lawton E W, Martin D T, Lee H. Validation of SRM power cranks using dynamic calibration. Fifth IOC World Congress on Sport Sciences: 31 Oct –5 Nov 1999; Sydney: International Olympic Committee, 1999199
- 31.Olds T S. Modelling human locomotion: applications to cycling. Sports Med 200131497–509. [DOI] [PubMed] [Google Scholar]
- 32.Paton C D, Hopkins W G. Tests of cycling performance. Sports Med 200131489–496. [DOI] [PubMed] [Google Scholar]
- 33.Zhang Y ‐ Y, Johnson M C, II, Chow N C.et al Effect of exercise testing protocol on parameters of aerobic function. Med Sci Sports Exerc 199123625–630. [PubMed] [Google Scholar]
- 34.Woolford S M, Withers R T, Craig N P.et al Effect of pedal cadence on the accumulated oxygen deficit, maximal aerobic power and blood lactate transition thresholds of high‐performance junior endurance cyclists. Eur J Appl Physiol 199180285–291. [DOI] [PubMed] [Google Scholar]


