

Abstract
Objective
To assess the contribution of smoking to the inverse association of mortality with years of formal education in men in Australia.
Design
Data were obtained from a prospective cohort study that included 17 049 men in Melbourne recruited from 1990 to 1994, most of whom were aged between 40 and 69 years at baseline. The outcome measured was all‐cause mortality. The contribution of smoking to socioeconomic status differentials was estimated by including smoking as a variable in a Cox's proportional hazards model that also included education and other potential confounding variables.
Results
In men, the association between education and mortality was attenuated after adjustment for smoking, and the aetiological fraction for low levels of education was reduced from 16.5% to 10.6%.
Conclusions
In men, smoking contributes substantially to socioeconomic differentials in mortality. Effective policies and interventions that target smoking among socially disadvantaged groups may substantially reduce socioeconomic differentials in health.
Tobacco use is the largest single cause of preventible mortality and morbidity in Australia.1 In countries in the mature and declining phases of smoking epidemics, including Australia, socioeconomic status (SES) is strongly related to smoking behaviour such that less years of formal education (hereafter referred to as “education”), lower status occupation and lower income are associated with a higher prevalence of smoking.2,3,4,5,6
Given the well‐established associations of SES and mortality,7,8 and SES and smoking prevalence, we hypothesised that smoking contributes to a substantial proportion of SES differentials in mortality. Few studies have quantified the contribution of smoking to SES differentials in mortality. Jarvis and Wardle2 used an indirect method to estimate that, in the UK, tobacco caused about two thirds of the difference in risk of death across social class in men aged 35–69 years. Bobak et al9 reported similar results for Canada, Poland and the USA, and contended that eliminating smoking‐attributable differences would reduce the social gradient in mortality among men by half.
Our aim was to use prospective data to assess the contribution of smoking to educational differences in mortality in Australia. Women were not included as there was little evidence of an association between education and mortality (with or without adjustment for smoking) for them.
Methods
Design and measurement
The Melbourne Collaborative Cohort Study is a prospective study of 41 528 people (17 049 men), mostly aged between 40 and 69 years at baseline.10 Recruitment occurred between 1990 and 1994.
Respondents who reported currently smoking at least seven cigarettes weekly were categorised as current smokers. Those not currently smoking who had but smoked at least seven cigarettes weekly for at least a year were categorised as ex‐smokers. Others were classified as never smokers.
All variables measured at baseline that were considered to be possible confounders of the education–mortality association were included in the analyses. Two questions assessing social participation were: (1) Including yourself, how many people live in your household?; and (2) How many hours a week, if any, do you spend in social activities outside your home or work? Respondents were asked to indicate the number of times a week they had exercised vigorously, non‐vigorously or had walked in the past six months. Walking and less‐vigorous exercise frequencies were added together and then added to twice the frequency of vigorous exercise to generate a physical activity score for each person, which was divided into four groups. Alcohol consumption was estimated from beverage‐specific questions about average quantity and frequency consumed and categorised into <40, 40–59 and 60+ g/day. Body mass index was divided into quartiles. Blood pressure was measured twice after supine rest for 5 min. The average systolic blood pressure was used in this analysis.
Addresses and vital statistics during follow‐up were determined by record linkage to electoral rolls, Victorian death records, the national death index, from electronic phone books, and from responses to questionnaires and newsletters. Victorian death records were completed to 30 June 2004 and the national death index to the end of 2002.
Statistical analysis
We used Cox's regression to estimate hazard ratios. Follow‐up began at baseline and continued until death, date of emigration from Australia or 30 June 2004, whichever came first. Men (n = 175) were excluded if values for any covariates were missing.
Two regression models are presented. Model 1 includes all variables except smoking, and model 2 also includes smoking. The aetiological fraction for low or medium education was computed using the equation:
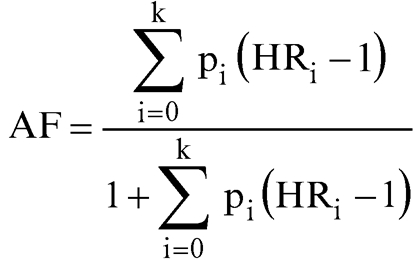 |
where pi is the proportion of the population in the ith education category and HR is the adjusted hazard ratio for the category; Σpi = 1, HR0 = 1 (reference category). The education distribution for Australian men aged 40–69 years was obtained from the 1991 census. The confidence interval for the aetiological fraction was estimated as the 2.5th and 97.5th centiles of the distribution of the aetiological fraction from 250 000 simulations by using the variances and covariances of the log hazard ratios. The pi's were assumed to be known without error.
The change in aetiological fraction in model 2 gives an estimate of the extent to which smoking can explain mortality differentials associated with education.
Results
We identified 1633 deaths during follow‐up. Table 1 provides sample characteristics and hazard ratios.
Table 1 Hazard ratios and 95% confidence intervals for the effect of covariates on survival time (n = 16 874).
| Covariates | % in sample | Adjusted HR (model 1) | Adjusted HR (model 2) |
|---|---|---|---|
| Country of birth | |||
| Australia/New Zealand | 65.5 | 1.00 | 1.00 |
| UK | 8.2 | 0.91 (0.75 to 1.11) | 0.87 (0.72 to 1.07) |
| Italy | 14.2 | 0.76 (0.64 to 0.90) | 0.70 (0.59 to 0.82) |
| Greece | 12.1 | 0.79 (0.66 to 0.95) | 0.72 (0.60 to 0.87) |
| Household size | |||
| 1 | 11.5 | 1.65 (1.28 to 2.12) | 1.55 (1.20 to 1.99) |
| 2 | 36.3 | 1.22 (0.97 to 1.54) | 1.19 (0.94 to 1.49) |
| 3–4 | 39.2 | 1.19 (0.95 to 1.50) | 1.17 (0.93 to 1.47) |
| 5+ | 13.0 | 1.00 | 1.00 |
| Hours per week of social activities | |||
| 0 | 16.4 | 1.25 (1.08 to 1.44) | 1.23 (1.07 to 1.42) |
| 1–2 | 14.2 | 0.90 (0.76 to 1.07) | 0.92 (0.78 to 1.09) |
| 3–4 | 17.8 | 1.05 (0.91 to 1.22) | 1.06 (0.92 to 1.23) |
| 5–9 | 23.0 | 0.98 (0.85 to 1.13) | 0.98 (0.85 to 1.13) |
| 10+ | 28.5 | 1.00 | 1.00 |
| Physical activity | |||
| Low | 22.5 | 1.23 (1.07 to 1.43) | 1.16 (1.00 to 1.34) |
| Moderate low | 18.3 | 1.06 (0.91 to 1.23) | 1.03 (0.88 to 1.20) |
| Moderate high | 25.5 | 1.27 (1.11 to 1.44) | 1.24 (1.09 to 1.41) |
| High | 33.6 | 1.00 | 1.00 |
| Alcohol consumption | |||
| Low | 84.2 | 1.00 | 1.00 |
| Medium | 8.5 | 1.16 (0.98 to 1.36) | 1.10 (0.93 to 1.30) |
| High | 7.3 | 1.25 (1.06 to 1.49) | 1.13 (0.96 to 1.35) |
| BMI* | |||
| 1st quartile | 0.98 (0.85 to 1.13) | 0.97 (0.84 to 1.12) | |
| 2nd quartile | 0.88 (0.77 to 1.01) | 0.89 (0.77 to 1.02) | |
| 3rd quartile | 0.80 (0.70 to 0.92) | 0.80 (0.69 to 0.91) | |
| 4th quartile | 1.00 | 1.00 | |
| Systolic blood pressure† | 1.11 (1.05 to 1.17) | 1.12 (1.06 to 1.18) | |
| Education | |||
| Below or up to primary school | 18.6 | 1.36 (1.12 to 1.65) | 1.22 (1.01 to 1.49) |
| Bit of high school | 31.1 | 1.21 (1.03 to 1.41) | 1.10 (0.95 to 1.29) |
| Completed high school | 24.9 | 1.18 (1.01 to 1.39) | 1.12 (0.95 to 1.32) |
| Degree/diploma | 25.4 | 1.00 | 1.00 |
| Smoking status | |||
| Never smoker | 41.0 | 1.00 | |
| Current smoker | 14.5 | 2.10 (1.81 to 2.44) | |
| Quit ⩽1 year ago | 1.4 | 2.82 (1.63 to 3.20) | |
| Quit >1 and ⩽10 years ago | 13.7 | 1.50 (1.28 to 1.76) | |
| Quit >10 years ago | 29.3 | 1.22 (1.08 to 1.39) |
BMI, body mass index (weight (kg)/height2 (m2)).
*The cut points for BMI quartiles are 24.75, 26.87 and 29.20.
†Systolic blood pressure is expressed as SD, which is 18.21.
Education was inversely associated with mortality (p = 0.018) in model 1. The association was weaker (p = 0.236) after adjustment for smoking (model 2). Smoking was associated with mortality (p<0.001).
Using the 1991 Australian census, we grouped education into the following categories: left school at age ⩽14, with no further education (21.5%); left school at 15–17 years, with no further education (30.3%); left school at 18 or 19 years, or obtained a certificate (32.3%); and diploma/degree (15.8%). These categories are similar to those used in the Midland Community Cancer Services. The aetiological fraction for participants with education lower than diploma/degree was 16.5% in model 1 (95% confidence interval (CI) 5.6% to 22.6%) and 10.6% in model 2 (95% CI 0 to 21.2%), which was a 35.8% relative reduction from model 1.
Discussion
Without adjustment for smoking, the point estimate of aetiological fraction for low and medium education was 16.5%. After adjustment for smoking, the aetiological fraction declined to 10.6%. This suggests that, in men, smoking accounts for 35.8% of excess deaths that would otherwise be attributed to low levels of education. Notably, the confidence intervals for the attributable fractions were wide and could indicate no difference (or even an increase) in the effect of education on mortality differences when smoking was included in the model.
Our estimate of the excess mortality in men of low SES as a result of smoking was less than that reported in studies in the UK, Canada, Poland and the USA.2,9 Ideally, similar data and techniques of analyses would be used to compare the extent of the contribution of smoking to social gradients in mortality across countries, but all studies point to a substantial contribution of smoking.
What this paper adds
Without adjustment for smoking, the least educated men had a mortality rate 36% higher than that of the most highly educated men, and the aetiological fraction of low and medium education was 16.5%. After adjustment for smoking, the association was attenuated (the mortality rate was 22% higher in those with the least education) and the aetiologic fraction declined to 10.6%. This suggests that, in men, smoking accounts for 35.8% of excess deaths that would otherwise be attributed to low levels of education.
Policy implications
Effective policies and interventions that target smoking among socially disadvantaged groups may substantially reduce socioeconomic differentials in health.
Our findings suggest that effective policies and interventions that target smoking among socially disadvantaged groups may substantially reduce differentials in health based on social class.
Abbreviations
SES - socioeconomic status
Footnotes
Funding: Cohort recruitment was funded by the Victorian Health Promotion Foundation (VicHealth) and The Cancer Council Victoria. This research was supported in part by grants from VicHealth and the National Health and Medical Research Council (209057). MS is supported by a fellowship from VicHealth.
Competing interests: None declared.
References
- 1.Australian Institute of Health and Welfare Australia's health. Canberra: Australian Government Publishing Services, 2002
- 2.Jarvis M J, Wardle J. Social patterning of individual health behaviours: the case of cigarette smoking. In: Marmot M, Wilkinson RG, eds. Social determinants of health. Oxford: Oxford University Press, 1999
- 3.Siahpush M. Socioeconomic status and tobacco expenditure among Australian households; Results from the 1998–99 Household Expenditure Survey. J Epidemiol Community Health 200357798–801. [DOI] [PMC free article] [PubMed] [Google Scholar]
- 4.Hymowitz N, Cummings K M, Hyland A.et al Predictors of smoking cessation in a cohort of adult smokers followed for five years. Tob Control 19976s57–s62. [DOI] [PMC free article] [PubMed] [Google Scholar]
- 5.Shohaimi S, Luben R, Wareham N.et al Residential area deprivation predicts smoking habit independently of individual educational level and occupational social class. A cross sectional study in the Norfolk cohort of the European Investigation into Cancer (EPIC‐Norfolk). J Epidemiol Community Health 200357270–276. [DOI] [PMC free article] [PubMed] [Google Scholar]
- 6.Borrell C, Dominguez‐Berjon F, Pasarin M I.et al Social inequalities in health related behaviours in Barcelona. J Epidemiol Community Health 20005424–30. [DOI] [PMC free article] [PubMed] [Google Scholar]
- 7.Wilkinson R G, Marmot M.Social determinants of health: the solid facts. Copenhagen: World Health Organization, 2003
- 8.Turrell G, Oldenburg B, McGuffog I.et alSocioeconomic determinants of health: toward a national research program and a policy and intervention agenda. Brisbane: Queensland University of Technology, 1999
- 9.Bobak M, Jha P, Nguyen S.et al Poverty and smoking. In: Jha P, Chaloupka FJ, eds. Tobacco control in developing countries. Oxford: Oxford University Press, 2000
- 10.Giles G G. The Melbourne study of diet and cancer. Proc Nutr Soc Aust 19901561–68. [Google Scholar]