Abstract
Specification of pattern is fundamental to the development of a multicellular organism. The Malpighian (renal) tubule of Drosophila melanogaster is a simple epithelium that proliferates under the direction of a single tip cell into three morphologically distinct domains. However, systematic analysis of a panel of over 700 P{GAL4} enhancer trap lines reveals unexpected richness for such an apparently simple tissue. Using numerical analysis, it was possible formally to reconcile apparently similar or complementary expression domains and thus to define at least five genetically defined domains and multiple cell types. Remarkably, the positions of domain boundaries and the numbers of both principal and secondary (“stellate”) cell types within each domain are reproducible to near single-cell precision between individual animals. Domains of physiological function were also mapped using transport or expression assays. Invariably, they respect the boundaries defined by enhancer activity. These genetic domains can also be visualized in vivo, both in transgenic and wild-type flies, providing an “identified cell” system for epithelial physiology. Building upon recent advances in Drosophila Malpighian tubule physiology, the present study confirms this tissue as a singular model for integrative physiology.
Keywords: Malpighian tubule, P-element, epithelial physiology, gene expression, enhancer trap
Enhancer trapping has provided valuable information on spatial patterning of gene expression (1–3), but because of difficulties in systematic analysis, it usually serves mainly as a route to cloning relevant gene(s) (4–6). If a sufficiently large panel of lines is screened, however, the expression patterns themselves can be used to deduce the formal genetic organization of a tissue, as has recently been described for Drosophila melanogaster mushroom bodies (7). Although an enhancer-detector may not report precisely the expression of the nearest transcription unit, its activation relies nonetheless on a combination of cellular transcription factors and thus reflects the underlying organization of a tissue. Such an approach has the power of indicating the organism’s, rather than the experimenter’s, view of the cellular organization of the tissue under study. This approach is independent of the precise identity of transcription units flanking the enhancer-detectors, although it may subsequently lead to their characterization.
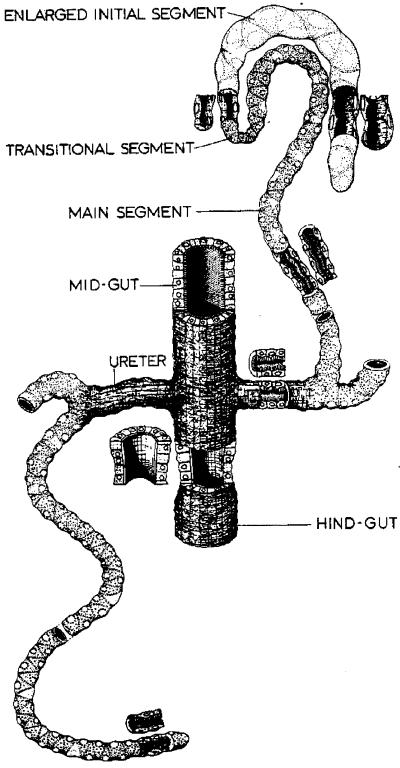
The D. melanogaster Malpighian tubule, in which proliferation from ectodermal primordia is shown to be under the control of a single tip cell, is a valuable model for epithelial development (8). The specification of the tip cell in turn relies on a “neurogenic” cascade of signaling genes closely similar to the cascade that specifies cell fate in the peripheral nervous system (9). There is also a wealth of physiological data obtained from adult tubules that reveals considerable richness of both transport and cell signaling components (10–14). Both recent developmental work (9) and classical morphology (15) suggest that this functional sophistication is achieved by a relatively simple structure (see Fig. 1), composed of just three regions and two major cell types, in a simple tubular epithelium of 100–150 cells.
Figure 1.
Classical morphology of the D. melanogaster Malpighian tubule. [Reproduced with permission from ref. 15 (Copyright 1978, Academic Press).]
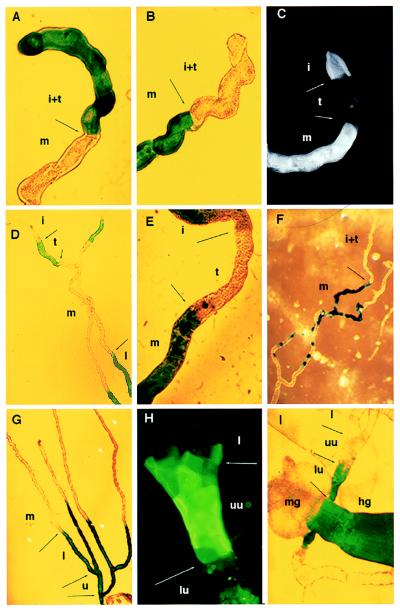
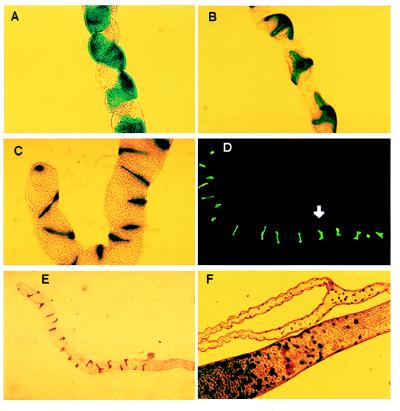
The D. melanogaster Malpighian tubule thus seems to be an ideal, simple epithelial model in which to study cell fate specification, the development of epithelial polarity, and an adult transport phenotype. In this study, a set of 700 P{GAL4} enhancer trap lines was screened for patterned reporter gene expression in the Malpighian tubules and was used to establish informative panels of lines that illustrate genetic compartmentalization by region (see Fig. 2) and by cell type (see Fig. 3). The results show an unexpected complexity that corresponds with physiological data and suggests that, even in this simplest of models, epithelial cells may take on individual identities.
Figure 2.
Genetic mapping of tubule subregions. (A) Line 155Y marks the initial and transitional segments of posterior tubules by inclusion, whereas (B) lines c709 and c776 mark them by exclusion. Line c825 shows staining of the initial and main, but not transitional, segments in posterior (C) and anterior (E) tubules. (D) In contrast, line c507 marks the transitional segment and lower tubule, but not the initial or main segments (anterior tubule). (F) Line c374 marks the main segment. In this line, the boundary with the transitional segment is clear, but the transition to lower tubule is gradual (see Fig. 3). (G) Line c507 marks the lower tubule and ureter. (H) Line c649 marks an “upper ureter” domain from the tubule bifurcation to halfway along the ureter (anti-β-galactosidase fluorescence). (I) Line c601 marks the complementary lower ureter and hindgut. The diameter of the tubule can be taken as 35 μm throughout. i, Initial segment; t, transitional segment; m, main segment; l, lower tubule; u, ureter; uu, upper ureter; lu, lower ureter; mg, midgut; hg, hindgut.
Figure 3.
Genetic mapping of tubule cell types. (A) Lines c324 and c374 distinguish subsets of morphologically indistinguishable principal epithelial cells in the main segment. (B) Lines c710 and c724 are expressed uniquely in the stellate cells of adults and larvae. (C) Lines c710 and c724 also mark bar-shaped cells in the initial segment of anterior tubules. (D) Type II cell morphology switches from bar-shaped to stellate at the transitional–main tubule boundary (arrow). The tip of the tubule is to the left. (E) Line c649 marks only the bar-shaped type II cells of anterior tubule initial and transitional segments. (F) Line c325 demonstrates the presence of a small, previously unreported cell type in the lower tubules and ureter and of homologues in the posterior midgut.
METHODS
Generation of Lines.
D. melanogaster were maintained on a 12 h dark/12 h light cycle on standard cornmeal/yeast/agar medium at 25°C and ambient humidity. P{GAL4} mutagenesis was carried out essentially as described elsewhere (16–19). The particular crossing scheme adopted in our laboratory is described in detail in a previous paper (7). Of over 700 lines screened, ≈10% revealed patterned staining in tubules, and of these, 13 (Table 1) were selected for detailed analysis. All of the lines described in this study were bred to homozygosity and so do not represent lethal insertions.
Table 1.
Summary of the main lines used in this study
| Line | Chromosome | Location | lacZ expression pattern in tubules |
|---|---|---|---|
| c724 | 2L | 40C | Stellate cells |
| c710 | 3L | 66D | Stellate cells |
| c649 | 3R | 90B | Bar-shaped stellate cell homologues of initial, transitional segments |
| c825 | 2L | 45E | Initial segment, main segment, gut |
| c709 | X | 9E | All principal cells |
| c324 | 2L | 23B | Subset of principal cells |
| c568A | ND | Subset of principal cells | |
| c801 | 2R | 55F/57F | Subset of principal cells |
| c855 | 2R | 46E | Subset of principal cells |
| c374 | 2R | 55C | Subset of principal cells |
| c507 | 3R | 100B | Lower tubule and ureter |
| c232 | 3R | 100B | Lower tubule and ureter |
| c803 | 3L | 79F | Tiny cells |
ND, not done.
GAL4-Directed Expression of β-Galactosidase.
The secondary reporter for GAL4 activity was a second chromosome insertion of UASG::lacZ, kindly provided by A. Brand (University of Cambridge). There is no detectable lacZ expression in tubules in the absence of GAL4. Unless otherwise described, histology was performed on adult flies 4–14 days postemergence. The expression of GAL4 is not itself easily detectable, but on crossing to lines carrying lacZ downstream of the UASG recognition sequence of the GAL4 protein, the β-galactosidase reporter gene is strongly expressed in those cells in which GAL4 has been expressed.
Whole-Mount 5-Bromo-4-Chloro-3-Indolyl β-d-Galactoside (X-Gal) Staining.
Preliminary screening was performed by chromogenic detection of β-galactosidase according to established protocols (20). Alimentary canals were dissected out in D. melanogaster saline (20) and pinned into a Sylgard (Dow-Corning)-lined Petri dish. The alimentary canals were fixed for 10–15 min in 1% glutaraldehyde/PBS, rinsed in PBS, and then transferred to staining solution (20) for 30–120 min. The reaction was stopped by rinsing with PBS, and alimentary canals were viewed at low power under incident light with a Wild (Heerbrugg, Switzerland) M8 stereo microscope or at higher power by transmitted light in a Leitz Ortholux microscope.
Ethidium Bromide Counterstaining.
Where required, tubules prepared for immunocytochemistry with fluorescein-coupled anti-β-galactosidase were subsequently incubated in a 1:100 dilution of (10 mg/ml stock) ethidium bromide in PBS for 2 min before mounting. Under fluorescein optics, it was then possible to count the number of red-stained nuclei either included or excluded in green-stained P{GAL4} domains. Throughout, such data are expressed as means ± SEM, with the number of tubules analyzed in parentheses.
Alkaline Phosphatase Detection.
Tubules were dissected, stuck to poly-l-lysine-treated slides, and lightly fixed as described above. They were then incubated in alkaline phosphatase color development solution for 10–30 min, according to the manufacturer’s instructions supplied with the Boehringer Mannheim DIG labeling and detection kit. Tubules were then viewed at low power under incident light with a Wild M8 stereo microscope or at higher power by transmitted light in a Leitz Ortholux microscope.
In Vivo Transport of Organic Dyes.
Insect Malpighian tubules can excrete actively a range of organic dyes, presumably through pathways that normally transport organic metabolites (21, 22). Tubules were dissected and attached to poly-l-lysine-coated slides as above, then incubated in D. melanogaster saline containing 10 μg/ml of either rhodamine 123 or ethidium bromide, for up to 10 min. The tubules were viewed immediately by epifluorescence with fluorescein optics.
Vacuolar H+-ATPase (V-ATPase).
Malpighian tubules, like many invertebrate and vertebrate epithelia (23, 24), are energized by V-ATPases (10, 25–27). Accordingly, distribution of V-ATPase within the tubules might be expected to respect genetic domains. Tubules were dissected from flies heterozygous for a lethal P-element insertion in the vha55 gene encoding subunit B of the V-ATPase (28), fixed, and stained as described above, and the nuclear-directed staining for the β-galactosidase reporter gene was viewed as described above.
RESULTS AND DISCUSSION
Tubules Are Divided into Multiple Domains.
Classically, the two anterior Malpighian tubules are described as comprising an initial segment (containing white luminal concretion bodies) and a main segment, joined by a narrow transitional segment; the two posterior tubules, in contrast, were thought to comprise solely a main segment (Fig. 1; refs. 15 and 29). Domains with similar relative sizes and positions are visible from enhancer analysis (Fig. 2), and we have thus adopted the nomenclature “initial,” “transitional,” and “main” segments to describe these genetically deduced domains. Surprisingly, enhancer trap lines that delineate the initial and transitional segments of anterior tubules (Fig. 2 D and E) reveal previously undescribed analogous domains in posterior tubules (Fig. 2 A–C). The latter are very small, however, and have probably been overlooked previously because they were too short to allow accumulation of concretions.
It is also possible to subdivide the main segments. Again, while the transitional–main segment boundary can be established in accordance with previous studies (Fig. 2 A–F), an additional domain is found marking the lower third of the tubule and the ureter (Fig. 2G). This region, in turn, can be resolved into three subregions: a lower tubule and an upper and lower ureter (Fig. 2 H and I).
Tubules Contain Multiple Cell Subtypes.
Such an analysis can be extended to cell subtypes. Previous studies have described just two tubule cell types: principal (type I) and secondary or “stellate” (type II; ref. 15). Both could be further subdivided. Principal cells, for example, comprise at least two distinct subpopulations (Fig. 3A); indeed, no line marked all the principal cells of the main segment. Interestingly, mutations at the white eye color locus also affect tubule color, and a similar mosaicism in principal cell color has been described in those white mutants that show position effect variegation of eye pigmentation (30, 31). Although position effect variegation is not the cause of our own observations, both lines of evidence demonstrate differences in otherwise indistinguishable cells with respect to transcriptional properties and thus presumably with respect to function. This heterogeneity may emerge as a general feature of epithelial structure.
Type II cells (Fig. 3B) are distributed evenly throughout the initial, transitional, and main segments of posterior tubules and within the main segment of anterior tubules. The two lines that mark stellate cells of the main segment also mark bar-shaped cells in the initial and transitional segments of the anterior tubule, which may thus be stellate cell counterparts (Fig. 3 C and D), although one line marks just the bar-shaped cells (Fig. 3E), implying that these are transcriptionally, and thus functionally, distinct. The transition between bar-shaped and stellate cells occurs at the transitional–main segment boundary (Fig. 3D). None of the above lines mark cells in the lower tubule or ureter (Fig. 4D), suggesting that the mechanism by which type II cells are specified respects the newly defined lower tubule boundary. Although type II cells are occasionally found to touch (data not shown), it is tempting to speculate that the overall evenness of their distribution in adults reflects spacing by lateral inhibition at some stage in their specification, reminiscent of the cuticular bristles of Drosophila (32).
Figure 4.
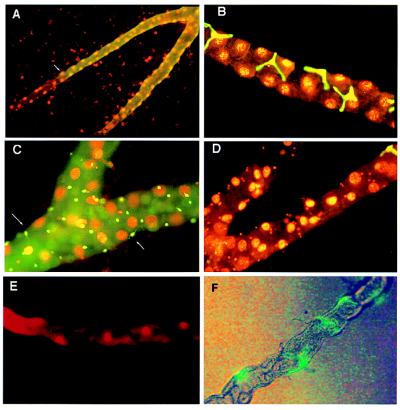
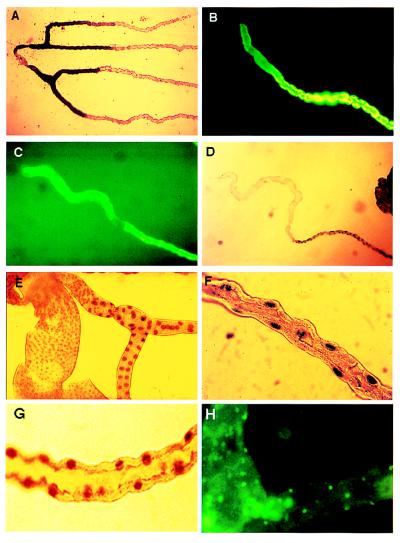
Counterstaining with ethidium bromide allows cell numbers to be counted. (A) Reporter gene expression was detected with fluorescein-coupled anti-β-galactosidase secondary antibody (green) in line c507 and counterstained with ethidium bromide. The boundary of β-galactosidase expression can be identified to single-cell resolution, and the number of principal cell nuclei to the tubule bifurcation can be counted. (B) Line c724 shows the relative abundance of principal and stellate cells in the main segment. In addition, the nuclei of the stellate cells are clearly smaller than those of principal cells. (C) Line c710 shows staining of the tiny cells of the ureter. Fine processes are visible in some cells (arrows). (D) Line c724, showing that stellate cells do not overlap with tiny cells in the lower tubule. A single stained stellate cell is visible at the junction of the lower tubule, and the tiny cell nuclei are visible in the lower tubule (cf. C). (E) Vital staining of tubule main segment principal cell nuclei with 10 μg/ml ethidium bromide for 5 min and viewed by epifluorescence. (F) Vital labeling of stellate cells with genetically modified (S65T) GFP. Flies carrying the P{UAS-GFP.S65T}T10 construct (Bloomington stock) were crossed to P{GAL4} line c724, and red-eyed adults were dissected in Drosophila saline and viewed without further treatment with mixed bright-field and fluorescein optics.
Interestingly, several lines mark a “tiny” cell type found in lower tubules and posterior midgut (Fig. 3F) but never seen in the same genetic domain as stellate cells (Fig. 4D). These cells contain a reduced cytoplasm and a compact nucleus, are just 3–4 μm in diameter, and have thin processes (Fig. 4C). To our knowledge, such cells have not previously been described in D. melanogaster; possibly they are counterparts of the myoendocrine cells recently described in Formica (33). Our speculation is that tiny cells are neuroendocrine, monitoring the fluid collecting in the ureter and secreting neurohormones basally into the hemolymph to regulate muscle contractility or ion transport. Supporting this model, antiserum against horseradish peroxidase, which selectively marks the central and peripheral neurons of insects, including D. melanogaster (34, 35), labels just the tiny cells within the tubule (Fig. 5H; cf. Figs. 3F and 4C).
Figure 5.
Functional mapping of tubule regions. (A) Alkaline phosphatase staining of lower tubule. Tubules were fixed and stained for alkaline phosphatase. This shows a perfect overlap with line c507 (cf. Fig. 2G). (B and C) Short-term (10 min) labeling with 10 μg/ml rhodamine 123 identifies the main segment of both posterior (B) and anterior (C) tubules as the region responsible for transport of this organic molecule. (D) Initial and transitional segments express V-ATPase at a far lower level than the main segment, as detected by a reporter gene inserted into the vha55 gene in the P-element lethal line vha55j2e5 (28). This corresponds to the boundary reported by lines 155Y, c709, and c776 in Fig. 2 A and B. (E) A boundary midway along the ureter is marked by a change in the size of nuclei labeled in line vha55j2e5. This corresponds to the boundary reported by lines c649 and c601 in Fig. 2 H and I. (F) Within the main segment, only principal cell nuclei (cf. Fig. 4B) are labeled in line vha55j2e5. (G) Within the main segment, only principal cell nuclei (cf. Fig. 4B) are labeled in P-element line l(2)k02508, a recessive lethal insertion within the gene encoding the body-enriched vha68–2 V-ATPase A subunit (36). (H) The tiny cells (cf. Figs. 3F and 4C) are labeled by antibodies to horseradish peroxidase, which recognize an epitope on a Drosophila nervous system-specific Na+,K+ ATPase β-subunit (37).
Genetic Domains Are Fixed to Single-Cell Precision.
Are genetically defined domains precisely specified with respect to cell number as well as cell type? GAL4-expressing tubules were counterstained with ethidium bromide to reveal cell nuclei. Distances between expression boundaries were measured by counting cell nuclei from either end of the tubule (Fig. 4A). It was also possible to distinguish nuclei of principal, stellate, and tiny cells on the basis of nuclear size (Figs. 4 B–D). This served as an objective method of demonstrating congruence between boundaries in different lines. For example, the number of ethidium bromide-stained principal cell nuclei in the upper domain of anterior tubules marked by bar-shaped stellate cells (line c649, Fig. 3E) is 40; this corresponds closely with the sum of such nuclei in the initial (22 ± 0.3) and transitional (22 ± 0.3) domains marked by line c825, or with the region unstained in line c568A, containing 44 ± 1.7 principal cells (Table 2).
Table 2.
Cell numbers in each segment of the anterior and posterior tubules
| Initial segment | Transitional segment | Main segment | Lower tubule | Total | |
|---|---|---|---|---|---|
| Principal cells | |||||
| Anterior tubules | 22 ± 0.2 (178) | 22 ± 0.3 (177) | 77 ± 1.2 (73) | 25 ± 0.4 (86) | 145 ± 0.9 (123) |
| Posterior tubules | 3.6 ± 0.1 (59) | 3.4 ± 0.1 (59) | 75 ± 2.4 (13) | 23 ± 0.4 (82) | 111 ± 1.0 (120) |
| Stellate cells | |||||
| Anterior tubules | 13 ± 0.2 (93) | 20 | 0 | 33 ± 0.4 (77) | |
| Posterior tubules | 2.3 ± 1 (79) | 20 | 0 | 22 ± 0.4 (59) | |
Lines c825, c507, c232, c724, and c649 were used for this analysis. The lower tubule runs to the bifurcation of the ureter. The ureter is not included in the counting, because of the heterogeneity of cell types it comprises. By inspection, stellate cells were known to be distributed evenly between initial and transitional segments, but because of the lack of a single line, which distinguished between stellate cells of the two domains, the two are not formally separated. Stellate cells of main segment were calculated by subtraction of cell numbers from line c649, which specifically marked stellate cells of initial and transitional segments, from totals obtained from lines c710 or c724, which marked all stellate cells. Stellate cells were not observed proximal to the main/lower tubule boundary (Fig. 4D; cf. Fig. 4A).
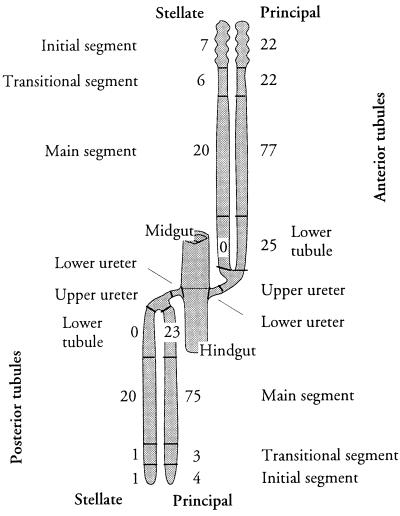
Totals of principal cells (145 ± 1 and 111 ± 1 in the anterior and posterior tubules, respectively) are comparable with previous studies on larvae (38); but our data further show that, between the anterior and posterior tubules, there is no difference in cell numbers in the main or lower tubule segments, and that overall differences are entirely attributable to the relative sizes of the initial and transitional segments (Fig. 6).
Figure 6.
Summary of tubule regional architecture. Regions defined in this study are labeled (cf. Fig. 1); the numbers of principal and stellate cells in each region are shown. Numerical data are derived from Table 2; SEs are not shown, as they are <1 in each case.
Genetic Domains Can Be Established in Living Tubules.
Although our measurements derive from independent P{GAL4} lines that may well differ with respect to genetic background, the numbers of cells in the tubule overall, the positions of genetic boundaries, and the numbers of each cell type in domain were nearly invariant (Table 2). This implies that tubule development is robust and precise, and allows the possibility that it will be feasible to study the development, placement, morphology, and physiology of individual, identified cells. As we have found, unexpectedly, that ethidium labels many living Drosophila tissues, including the tubules (Fig. 4E), it is straightforward to establish cell coordinates in living tubules under fluorescent illumination by counting nuclei.
An added advantage of the GAL4-UAS system is that new reporters can be adopted for existing lines without having to perform a new screen. Since this work was undertaken, new vital reporters using genetically modified green fluorescent protein (GFP) have become available (39). GFP-marked domains are clearly visible in living tubules, in a pattern indistinguishable from that of the lacZ reporter in fixed preparations (Fig. 4F). Accordingly, it is now possible to perform experiments on identified cells in a living epithelium.
Physiological Properties of Tubules Respect Genetic Domains.
Do discrete physiological properties map to the genetic domains we have identified? With respect to a number of different transport processes, this is indeed the case. The obvious functional property of the tubule is to secrete urine. It has been previously reported that the initial segment of Drosophila anterior tubule does not secrete detectable fluid (10), that the lower third of the tubule is reabsorptive, and that only the main segment is responsible for fluid production (40). This presages the main/lower tubule distinction described here.
High levels of proton-pumping V-ATPases energize apical plasma membranes of several epithelia (41, 42), including Malpighian tubules (43), which are known to be exquisitely sensitive to the V-ATPase inhibitor, bafilomycin (10, 25). V-ATPase expression might thus offer an informative physiological indicator. The gene encoding the B-subunit of the Drosophila V-ATPase has been inactivated by insertion of a P[lacZ] enhancer trap element (28). lacZ expression in the initial and transitional segments is much weaker than in the main segment (Fig. 5D). Moreover, a clear subdivision between proximal and distal ureter (Fig. 5E) respects the boundary defined by Fig. 2 H and I. Nuclei labeled within the main segment (Fig. 5F) are entirely the larger, principal cell nuclei; stellate cell nuclei do not stain (cf. Fig. 4B). Although a single reporter element may not provide a definitive view of V-ATPase distribution, we have similarly cloned and inactivated a further three subunits of the Drosophila V-ATPase, and each P-element line reports the same expression pattern in Malpighian tubules (Fig. 5G and ref. 44). This provides the first evidence that cation transport in this tissue may be a unique property of principal, rather than type II, cells.
These data provide not only clear supporting evidence for each of the regional divisions, but also for a proposed functional difference between principal and secondary cells (14). We have previously cloned a putative aquaporin by reverse transcriptase-PCR from tubule mRNA and have shown specific labeling of stellate cell basolateral membranes (12) with antibodies against a vertebrate kidney aquaporin (45). Given that stellate cells are found in secretory (Fig. 3B), but not in reabsorptive (Fig. 4D), tubule regions, they may well play an essential role in fluid secretion (46).
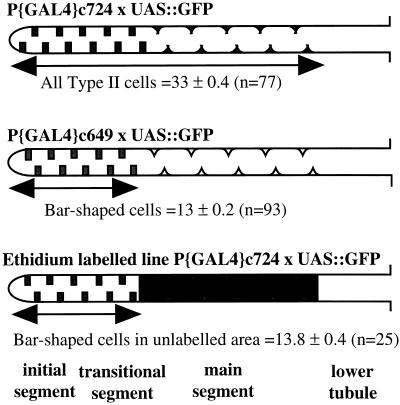
Another function ascribed to insect tubules is the excretion of organic metabolites, and several dyes are actively transported by tubules (21). When the cationic dyes rhodamine 123 (22) or ethidium bromide are added to tubules, they appear initially only in the lumen of the main segment (Fig. 5 B and C; cf. Fig. 2 B and F). Both the initial and transitional segments of anterior tubules and the miniature analogues in posterior tubules fail to transport dye, confirming that they are functionally, as well as genetically, similar. This functional domain aligns precisely with a genetic boundary; by performing an ethidium transport experiment on c724 tubules with stellate cell-directed GFP, it was found that the number of type II cells in the distal domain of anterior tubules that did not transport ethidium did not differ significantly from the initial and transitional segments identified by line c649 (Fig. 7).
Figure 7.
Numerical reconciliation of genetic and functional domains. (Top) Line c724 drives GFP expression in 33 type II cells of initial, transitional, and main segments. (Middle) Line c649 drives expression in 13 bar-shaped cells, diagnostic of initial and transitional segments (Table 2). (Bottom) When ethidium bromide is added to c724, it is transported into the cells, obscuring the view of all but the most distal 13 cells. This shows that the organic cation transport system operates in a compartment statistically indistinguishable from main segment.
The genomic DNA flanking several of these P-element insertions has been characterized. In the case of two independent lines that mark the lower tubule (Figs. 2G and 4A), a neighboring transcription unit encodes an alkaline phosphatase (M.Y., unpublished work). The staining pattern for alkaline phosphatase (Fig. 5A) clearly matches precisely the lower tubule boundary (Fig. 2G). Although widely used as a histochemical marker, the functions of alkaline phosphatase are not clear. However, alignment with the genetically and functionally derived maps show that it is associated with the reabsorptive, rather than the secretory, domain of the tubule.
Taken together, our data provide a unique insight into the functional organization of an epithelium. Even in this extremely simple epithelium enhancer trapping reveals unexpected complexity in both regions and cell types. Additionally, the use of cell counting to reconcile boundaries allows enhancer trap analyses to extend beyond the anecdotal and reveals robust genetic boundaries to be both precisely placed and functionally significant. To our knowledge, this is the first time that enhancer trap analysis has been used in this way to establish cell numbers for domains and to reconcile apparently similar domains numerically. However, this methodology will be, in principle, applicable both in Drosophila and in other organisms, as the genetic tools available for the study of vertebrates develop. Its utility in allowing a reconciliation with functional domains should be obvious; and as the Drosophila tubule is unlikely to be unique, these data imply that epithelia in general may be organized to a level of cellular sophistication that work to date has failed to reveal.
Acknowledgments
This work was supported by grants from the Medical Research Council and the Wellcome trust and by a postgraduate studentship from the Turkish Government to M.A.S.
ABBREVIATIONS
- GFP
green fluorescent protein
- V-ATPase
vacuolar H+-ATPase
References
- 1.Bertram M J, Akerkar G A, Ard R L, Gonzalez C, Wolfner M F. Mech Dev. 1992;38:33–40. doi: 10.1016/0925-4773(92)90036-j. [DOI] [PubMed] [Google Scholar]
- 2.Hartenstein V, Jan Y N. Roux’s Arch Dev Biol. 1992;201:194–220. doi: 10.1007/BF00188752. [DOI] [PubMed] [Google Scholar]
- 3.Riesgo-Escovar J, Woodard C, Gaines P, Carlson J. J Neurobiol. 1992;23:947–964. doi: 10.1002/neu.480230803. [DOI] [PubMed] [Google Scholar]
- 4.Doe C Q, ChuLaGraff Q, Wright D M, Scott M P. Cell. 1991;65:451–464. doi: 10.1016/0092-8674(91)90463-9. [DOI] [PubMed] [Google Scholar]
- 5.Nose A, Mahajan V B, Goodman C S. Cell. 1992;70:553–567. doi: 10.1016/0092-8674(92)90426-d. [DOI] [PubMed] [Google Scholar]
- 6.Schubiger M, Feng Y, Fambrough D M, Palka J. Neuron. 1994;12:373–381. doi: 10.1016/0896-6273(94)90278-x. [DOI] [PubMed] [Google Scholar]
- 7.Yang M Y, Armstrong J D, Vilinsky I, Strausfeld N J, Kaiser K. Neuron. 1995;15:45–54. doi: 10.1016/0896-6273(95)90063-2. [DOI] [PubMed] [Google Scholar]
- 8.Skaer H. Nature (London) 1989;342:566–569. [Google Scholar]
- 9.Hoch M, Broadie K, Jackle H, Skaer H. Development (Cambridge, UK) 1994;120:3439–3450. doi: 10.1242/dev.120.12.3439. [DOI] [PubMed] [Google Scholar]
- 10.Dow J A T, Maddrell S H P, Görtz A, Skaer N V, Brogan S, Kaiser K. J Exp Biol. 1994;197:421–428. doi: 10.1242/jeb.197.1.421. [DOI] [PubMed] [Google Scholar]
- 11.Dow J A T, Maddrell S H P, Davies S-A, Skaer N J V, Kaiser K. Am J Physiol. 1994;266:R1716–R1719. doi: 10.1152/ajpregu.1994.266.5.R1716. [DOI] [PubMed] [Google Scholar]
- 12.Dow J A T, Kelly D C, Davies S A, Maddrell S H P, Brown D. J Physiol. 1995;489:110P. [Google Scholar]
- 13.Davies S A, Huesmann G R, Maddrell S H P, O’Donnell M J, Skaer N J V, Dow J A T, Tublitz N J. Am J Physiol. 1995;269:R1321–R1326. doi: 10.1152/ajpregu.1995.269.6.R1321. [DOI] [PubMed] [Google Scholar]
- 14.O’Donnell M J, Dow J A T, Huesmann G R, Tublitz N J, Maddrell S H P. J Exp Biol. 1996;199:1163–1175. doi: 10.1242/jeb.199.5.1163. [DOI] [PubMed] [Google Scholar]
- 15.Wessing A, Eichelberg D. In: The Genetics and Biology of Drosophila. Ashburner A, Wright T R F, editors. 2c. London: Academic; 1978. pp. 1–42. [Google Scholar]
- 16.Spradling A C, Rubin G M. Science. 1982;218:341–347. doi: 10.1126/science.6289435. [DOI] [PubMed] [Google Scholar]
- 17.O’Kane C J, Gehring W J. Proc Natl Acad Sci USA. 1987;84:9123–9127. doi: 10.1073/pnas.84.24.9123. [DOI] [PMC free article] [PubMed] [Google Scholar]
- 18.Bellen H J, O’Kane C, Wilson C, Grossniklaus U, Pearson R K, Gehring W J. Genes Dev. 1989;3:1288–1300. doi: 10.1101/gad.3.9.1288. [DOI] [PubMed] [Google Scholar]
- 19.Smith H K, O’Kane C J. Roux’s Arch Dev Biol. 1991;200:306–311. doi: 10.1007/BF00665525. [DOI] [PubMed] [Google Scholar]
- 20.Ashburner M. Drosophila: A Laboratory Manual. Plainview, NY: Cold Spring Harbor Lab. Press; 1989. [Google Scholar]
- 21.Maddrell S H P, Gardiner B O C, Pilcher D E M, Reynolds S E. J Exp Biol. 1974;61:357–377. doi: 10.1242/jeb.61.2.357. [DOI] [PubMed] [Google Scholar]
- 22.Meulemans W, De Loof A. J Cell Sci. 1992;101:349–361. doi: 10.1242/jcs.101.2.349. [DOI] [PubMed] [Google Scholar]
- 23.Wieczorek H. J Exp Biol. 1992;172:335–343. doi: 10.1242/jeb.172.1.335. [DOI] [PubMed] [Google Scholar]
- 24.Wieczorek H, Harvey W R. Physiol Zool. 1995;68:15–23. [Google Scholar]
- 25.Bertram G, Shleithoff L, Zimmermann P, Wessing A. J Insect Physiol. 1991;37:201–209. [Google Scholar]
- 26.Maddrell S H P, O’Donnell M J. J Exp Biol. 1992;172:417–429. doi: 10.1242/jeb.172.1.417. [DOI] [PubMed] [Google Scholar]
- 27.Van Kerkhove E. Belg J Zool. 1994;124:73–90. [Google Scholar]
- 28.Davies S A, Kelly D C, Goodwin S F, Wang S-Z, Kaiser K, Dow J A T. J Biol Chem. 1996;271:30677–30684. doi: 10.1074/jbc.271.48.30677. [DOI] [PubMed] [Google Scholar]
- 29.Skaer H. In: The Development of Drosophila melanogaster. Bate M, Martinez Arias A, editors. Vol. 2. Plainview, NY: Cold Spring Harbor Lab. Press; 1993. pp. 941–1012. [Google Scholar]
- 30.Clancy C W. Genetics. 1955;40:567–568. [Google Scholar]
- 31.Hartmann-Goldstein I J, Koliantz G, Hoyland M. Stain Technol. 1976;51:119–123. doi: 10.3109/10520297609116682. [DOI] [PubMed] [Google Scholar]
- 32.Lawrence P A. The Making of a Fly. Oxford: Blackwell Scientific; 1993. [Google Scholar]
- 33.Garayoa M, Villaro A C, Sesma P. Gen Comp Endocrinol. 1994;95:133–142. doi: 10.1006/gcen.1994.1110. [DOI] [PubMed] [Google Scholar]
- 34.Jan L Y, Jan Y N. Proc Natl Acad Sci USA. 1982;79:2700–2704. doi: 10.1073/pnas.79.8.2700. [DOI] [PMC free article] [PubMed] [Google Scholar]
- 35.Siddiqui S, Culotti J. J Cell Biochem. 1984;8:108. [Google Scholar]
- 36.Guo Y. Ph.D. Thesis. Glasgow: Univ. of Glasgow; 1996. [Google Scholar]
- 37.Sun B, Salvaterra P M. Proc Natl Acad Sci USA. 1995;92:5396–5400. doi: 10.1073/pnas.92.12.5396. [DOI] [PMC free article] [PubMed] [Google Scholar]
- 38.Janning W, Lutz A, Wissen D. Roux’s Arch Dev Biol. 1986;195:22–32. doi: 10.1007/BF00444038. [DOI] [PubMed] [Google Scholar]
- 39.Brand A. Trends Genet. 1995;11:324–325. doi: 10.1016/s0168-9525(00)89091-5. [DOI] [PubMed] [Google Scholar]
- 40.O’Donnell M J, Maddrell S H P. J Exp Biol. 1995;198:1647–1653. doi: 10.1242/jeb.198.8.1647. [DOI] [PubMed] [Google Scholar]
- 41.Gluck S, Nelson R. J Exp Biol. 1992;172:205–218. doi: 10.1242/jeb.172.1.205. [DOI] [PubMed] [Google Scholar]
- 42.Harvey B J. J Exp Biol. 1992;172:289–309. doi: 10.1242/jeb.172.1.289. [DOI] [PubMed] [Google Scholar]
- 43.Klein U. J Exp Biol. 1992;172:345–354. doi: 10.1242/jeb.172.1.345. [DOI] [PubMed] [Google Scholar]
- 44.Dow J A T, Davies S A, Guo Y, Graham S, Finbow M E, Kaiser K. J Exp Biol. 1997;202:237–245. doi: 10.1242/jeb.200.2.237. [DOI] [PubMed] [Google Scholar]
- 45.Verbavatz J M, Van Hoek A N, Ma T, Sabolic I, Valenti G, Ellisman M H, Ausiello D A, Verkman A S, Brown D. J Cell Sci. 1994;107:1083–1094. doi: 10.1242/jcs.107.4.1083. [DOI] [PubMed] [Google Scholar]
- 46.Dow, J. A. T., Davies, S. A. & Sözen, M. A. (1997) Am. Zool. 38, in press.


