Abstract
Formation of ion clusters in aqueous NaCl solutions at 25 °C is investigated with dynamics simulations in the 0.1–3M concentration range. The medium is found to be highly structured even at moderate concentrations, and clusters of over 20 ions are observed above ~2M. The medium can be viewed as a multicomponent fluid, composed of reacting particles with well-defined average populations, shapes, sizes, and charge distributions. Clusters show substantial morphological variations that are here characterized by their hydrodynamic radii and internal charge distributions. Clusters can be described as prolate spheroids in the subnanometer length scale. The hydrodynamic radius and the radius of gyration follow simple power laws with the number of ions in the cluster. Dipole moment distributions show characteristic peaks in the ~10–60 debye range that reflect conformational preferences modulated by electrostatic and liquid-structure forces.
I. INTRODUCTION
Electrolytes are commonly used in technological and industrial application, and are ubiquitous in biological systems. They are found in body fluids and tissues, and play a role in the highly regulated electrochemical balance in cells. Electrolytes affect physical and chemical properties of proteins and nucleic acids, the motility of individual cells (chemotaxis), the migration of simple multicellular organisms, and the survival of bacteria. These processes occur at a broad range of concentrations, from highly diluted to nearly saturated conditions.
Thermodynamic and transport properties of electrolyte solutions are well characterized [1]. However, their microscopic nature at ambient and physiological conditions is still poorly understood. Raman scattering experiments have suggested the presence of clusters in unsaturated, saturated, and supersaturated solutions [2,3]. More direct evidence of cluster formation has been obtained in recent years with dynamic light scattering techniques [4]. Assuming colloidal clusters of spherical shape, hydrodynamic radii were obtained for aqueous NaCl solutions at ~20 °C. Two well-defined size scales were identified: below ~1 nm and above ~100 nm [4].
The most direct evidence of cluster formation, however, is provided by computer simulations. They allow a detailed study of properties that cannot be scrutinized experimentally. Among these are the atomistic nature of cluster speciation, the properties of the liquid structure, and cluster morphology. Molecular dynamics (MD) simulations have been used to study structural and dynamic properties of concentrated solutions [5], the formation of small clusters in unsaturated aqueous electrolytes [6,7], early steps of salt nucleation in oversaturated solutions [8], and cluster formation in supercritical conditions [9].
Because of limitations in computer power earlier studies have been restricted to small systems and short simulation times. Recently, longer (10 ns) MD simulations provided direct evidence of clusters of up to six ions in 1m NaCl aqueous solutions at 25 °C [7] and permitted reliable calculation of thermodynamic data such as pair dissociation constants. In this paper, results from a set of 40-ns MD simulations of NaCl in water at 25 °C and 1 bar are reported. Salt concentrations are in the 0.1–3M range, which is typical in biological systems and related experimental studies. These relatively long simulations allow the observation of larger clusters, with 10–30 ions above ~2M, which start forming after ~10–20 ns. The simulations provide data for statistically reliable calculations, which permits identification of simple behaviors not yet reported in these systems.
II. METHODS
The simulations were performed with classical potentials in the canonical ensemble. A cubic cell of volume ~(46 Å)3 containing ~3500 nonpolarizable water molecules preequilibrated at 25 °C was used. The density was ≈0.993 g/cm3, consistent with a pressure of 0.1 MPa. Concentrations of 0.1M, 0.5M, 1M, 2M, and 3M were generated by randomly replacing water molecules with Na+ and Cl− ions. Periodic boundary conditions were used (see additional details in [10]). The system was equilibrated for ~2 ns to allow ions to diffuse across the unit cell [11].
III. RESULTS
A cluster is defined as any array of ions such that (i) every ion is connected to at least one ion of opposite charge; two ions are said to be connected if they are separated by a distance smaller than 3.5 Å [12]; and (ii) every ion can be reached from any other ion through a path of consecutive connections. The following criterion applies to time evolution: If a cluster breaks into two fragments at time t but reforms before t+t★, then the cluster experienced just a structural fluctuation, and did not break at t. In this study t★ is 2 ps [13]. Similarly, if two clusters coalesce at time t but separate again before t+t★, then the clusters just collided, and did not react to form a single, larger cluster at t.
Statistical properties are derived from the cluster density ρ(n,q,t,c), defined as the number of clusters of size n (number of ions) and charge q per unit volume, at time t and concentration c. The clusters degree of formation is given by α(n,c) = cn(c)/c, where is the average molar concentration of clusters of size n; τ is the total simulation time, and NA is Avogadro’s number. Figure 1 shows αn vs n at different concentrations. The electrolyte is ~95% fully dissociated at 0.1M, and only ion pairs are present in the structured (associated) phase. The degree of dissociation decreases sharply as salt is added, as shown in the inset of Fig. 1 (n=1). At 3M the electrolyte is only ~45% dissociated, and the presence of very large clusters (n>20) can be observed as rare events. Although the largest clusters are observed infrequently and may have little effect on the system’s thermodynamics, they may play a role in nucleation and aggregation in longer time regimes or higher concentrations. The degree of formation of ion pairs increases as salt is added, but appears to reach a maximum around ~2M (Fig. 1 inset; n=2). Similar behavior is apparent from the data reported in [9], but here the maximum occurs at lower concentrations. The simulations show that large clusters can coexist in the relatively small space of the simulation cell. Above 2M, clusters of 10–20 ions are present simultaneously for several picoseconds before they break apart or grow further.
FIG. 1.
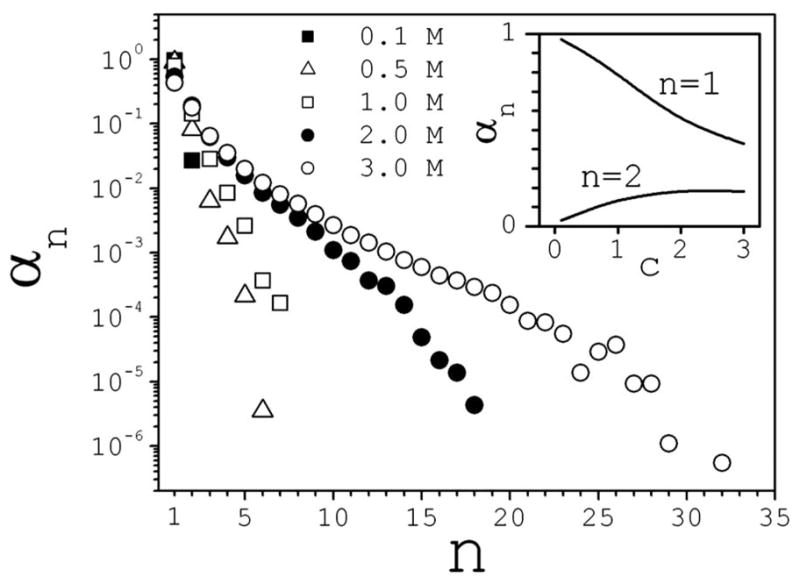
Degree of formation αn as a function of cluster size n (number of ions in the cluster) at different concentrations c (in moles/liter). The inset shows αn as a function of c for dissociated ions (n=1) and for ion pairs (n=2).
The electrolyte undergoes significant structural changes in the course of the simulation. It fluctuates between highly structured and highly dissociated, with characteristic periods of ~0.5–1 ns. These changes can be quantified by the probability Ps that a fraction s of the electrolyte is in the structured phase. This probability can be defined as the time ratio Ps(s) = τ−1∫G[s−s(t)]dt, where G(x) is 1 if x=0, and 0 otherwise; s(t) =1− f(t), and f(t) =c1(t)/2c is the fraction of fully dissociated electrolyte at time t and concentration c. The calculation shows that the largest fraction sM of structured electrolyte is ~35% at 0.1M, while the most probable fraction s0 corresponds in this case to the lowest degree of structuredness, sm, which is full dissociation. Fractions sM, s0, and sm increase with salt, such that at 3M the electrolyte is highly structured at times, fluctuating between sm ~45% and sM ~70%, with a most probable fraction of s0 ~55%. This shows that a strong electrolyte at room temperature can be highly associated even at moderate concentrations. It can be viewed as a multicomponent fluid, composed of reacting species with well-defined average populations. These particles vary in size, shape, and charge, as described below.
Cluster morphology shows substantial variation within classes (defined by n and q). Clusters are far from spherical, and present no crystal-like substructures. A measure of compactness can be defined as Ψ = γ/γc, where γ is the water accessible surface area (ASA) of a cluster in solution, and γc is the ASA of the most compact cluster that can be formed with the same ions. These compact clusters are taken as the smallest clusters seen in the NaCl crystal structure. This is the most efficient packing that would be physically expected in solution for this salt. Figure 2 shows γ vs n, which is found to be independent of concentration. γ is calculated numerically using the Lee-Richards definition [14] with a probe radius of 1.4 Å. It closely follows a power law of the form γ∞n1/1.4 within the entire size range. Inset (a) of Fig. 2 shows Ψ vs n (solid, thick line), and suggests important deviations from ideal compactness (Ψ=1). To compare, Ψ is also given (solid, thin) for clusters with the lowest degree of compactness, taken here as a linear array of the ions in the crystal. Therefore, NaCl clusters in solution have ASA halfway between that of a cylinderlike and a spherelike array, and can then be viewed more simply as prolate spheroids. Yet, it is common practice to simplify the analysis of experimental data by invoking spherical colloids. The inset (b) of Fig. 2 shows effective radii calculated as Rγ=(γ/4π)1/2 − 1.4 Å and Rc = (γc/4π)1/2 − 1.4 Å. Thus, clusters in solutions have effective radii in the ~3–8 Å range and follow a power law Rγ∞n1/dγ, with dimension dγ≈ 2.15. The simplest way to distort a sphere of radius Rc with ASA γc into a prolate spheroid of equatorial radius hm and polar radius hM with ASA γ, is to define hm = Rc and hM = (1+λ)Rc, where λ is a single parameter that quantifies the continuous deformation. The surface area of the spheroid is , where the ellipcity ε is defined by ε 2=1−(hm/hM)2. The problem is reduced to finding solutions of the equation 2(Rγ/Rc)2=1+(1+λ)sin−1(ε)/ε for each value of n. The inset (b) of Fig. 2 shows λ −1 vs n (square symbols), and an exponential fitting λ ≈ 1.2–1.4 exp(−n/14) (dotted line). The ratio hm/hM decreases with n, so clusters sphericity decreases with size.
FIG. 2.
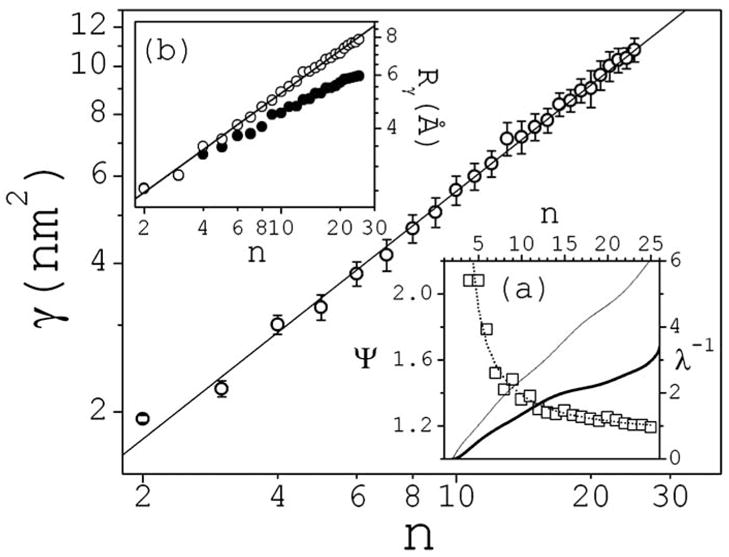
Water accessible surface area γ as a function of cluster size n. Bars are standard deviations; statistical errors are small and omitted. The inset (a) shows the compactness parameter ψ (solid thick: simulation data; thin: linear arrange; ideal compactness corresponds to ψ=1), and the deformation parameter λ (square symbols) with exponential fitting (dotted line). The inset (b) shows effective radii obtained from γ (white circles); γc is also shown for comparison (black circles).
Hydrodynamic radii RH of colloidal particles are accessible experimentally using dynamic light scattering. Calculation of RH by directly measuring mean square displacements is statistically unreliable due to the relatively short clusters lifetimes. Therefore, RH is estimated here using the Bloomfield equation [15] for bodies of arbitrary shape, which is a generalization of the Kirkwood formula [16] for subunits of equal size. RH of a cluster k of size n is then given by
where ρi is the hydrodynamic radius of ion (subunit) i, and rij is the distance between ions i and j; 〈 〉k denotes average over all conformations of cluster k. RH is calculated as , where Nn is the total number of unique clusters of size n observed in the course of the simulations. RH vs n is plotted in Fig. 3, and found to be independent of concentration [17]. RH follows closely a power law, RH ∞n1/dH, within the entire cluster size range, with dH ≈2.45. Plotted in the inset (a) of Fig. 3 is RH vs Rγ; it shows little variations with size and a linear dependence with a ratio RH/Rγ≈0.66.
FIG. 3.
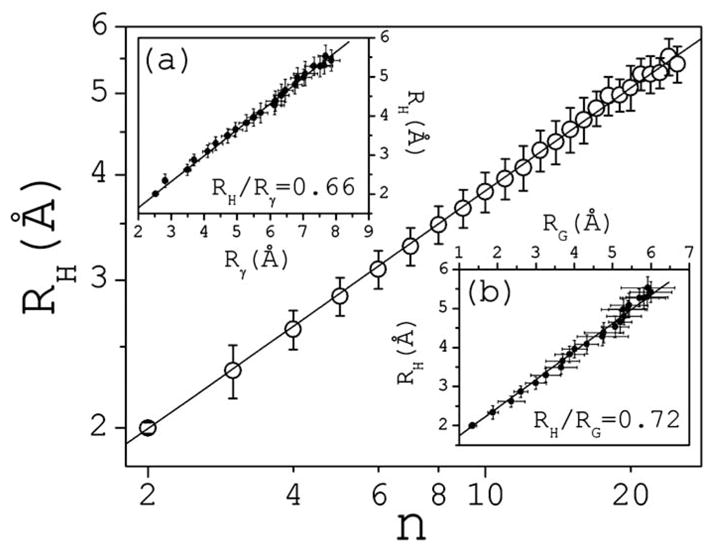
Hydrodynamic radius RH as a function of cluster size. The inset (a) shows the linear dependence between RH0 and Rγ. The inset (b) shows the linear dependence between RH and the radius of gyration RG. Bars are standard deviations; statistical errors are small and not shown.
Also accessible experimentally is the radius of gyration RG, which can be measured using static light scattering. Inset (b) of Fig. 3 shows RH vs RG. Again the dependence is linear, with a ratio RH/RG ≈ 0.72 for n>5. The simulations do not show the formation of nucleating centers triggering irreversible aggregation. However, both the ratio RH/RG and the power-law behavior of RH and RG with n are similar to those observed in fractal aggregation of colloidal silica [18] and gold [19]. Independent measurement of RH and RG yielded RH/RG ≈ 0.72 in the limit of large silica aggregates, while Hausdorff dimensions of ~2.1 (silica) and ~2.0 (gold) have been estimated. The proportionality between RH and RG in fractal aggregates has been discussed in [20].
Cluster charge varies between −4e and +4e, depending on salt concentration, and will be studied elsewhere. The interest here is in higher moments of the cluster charge distribution, which displays substantial variations as well and provides information on the cluster morphology. Dipole moments are calculated here with respect to the clusters centers of mass, which can be far removed from the corresponding centers of charge (from which point μ=0). Thus, a cluster can be viewed as a liquid-excluding spheroidal body with charge q and dipole μ located at its center of mass. This interpretation may be useful to quantify clusters electrostatic effects on a distant solute (e.g., a protein or DNA molecule) through a multipole expansion of the potential. Bulk and nonbulk effects of concentrated electrolytes on biomolecular interactions have been studied in [21].
A distribution function p(μ|n,q) can be defined such that dPn,q(μ)=p(μ|n,q)dμ is the conditional probability that a cluster of size n and charge q has a dipole moment of magnitude between μ and μ +dμ. Figure 4 illustrates the main features of p that highlight the preferred conformations in the case of small clusters. These conformations are determined by both electrostatic and liquid-structure forces. For n=2 the distribution reflects the variations of the interionic distance, yielding a peak at μ2 ~12 D. For n=3, the additional internal degrees of freedom lead to broader distributions, with characteristic peaks in the μ3 ~7–14 D range, depending on charge. This dependence stems from the difference in Na+ and Cl− radii that affect the angle distribution at the central ion. At n=4, both extended and cyclic conformations are observed for neutral clusters. Extended clusters generate two peaks, at μ4 ~12 D and μ4 ~24 D; cyclic clusters yield one peak at a small value of μ4 ~2.5 D. For n=4, charged clusters display less conformational variations because a central ion is surrounded symmetrically by three ions. This leads to relatively narrow distributions, and small dipoles in the μ4 ~5–10 D range. As cluster size increases, the internal degrees of freedom lead to an increasing number of overlapping peaks. For n=5 two well-defined peaks appear in the μ5 ~15–30 D range, depending on charge. Additional peaks can be inferred but are difficult to resolve visually. For n =6, neutral clusters show two well-resolved peaks in the μ6 ~10–25 D range, but the distribution also suggests other preferred conformations. A decomposition of p as a sum of n Gaussians yields good fitting (not shown). This decomposition suggests that extended clusters shift the distribution towards larger values of μ, with a maximum peak at μ6 ~40 D; partially cyclic clusters lead to smaller dipole moments, with a possible peak at μ6 ~7 D. For n=10, a number of strongly overlapping peaks in the μ10~20–80 D range are apparent that cannot be resolved. A general observation is that the locations of the peaks are independent of the salt concentration. The average dipole moment for each class is calculated as 〈μn,q〉=∫ μn,qp(μ|n,q)dμ, and plotted in Fig. 5 for q=0 and q= ±1. It follows a linear behavior 〈μn,q〉 ≈ aq + bqn, with aq ≈ 5–10 D and bq ≈ 2–3 D, and span the ~10–60 D range. Cluster survival times are in the ~10–100 ps range, depending on size and charge. Therefore, these large dipoles may have an important effect on the structure and dynamics of water, and profoundly affect the thermodynamics of the solution and of solvated biomolecules.
FIG. 4.
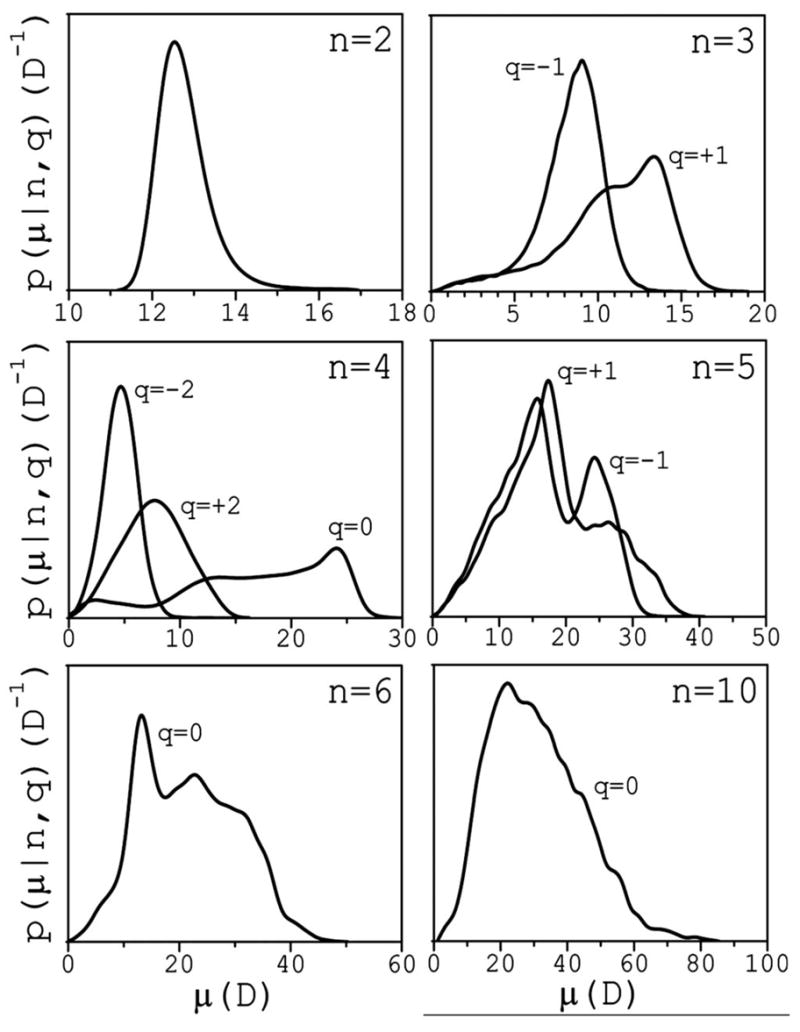
Conditional probability distributions p as a function of clusters dipole moments μ (in debye) for small clusters. Distributions are normalized as ∫p(μ|n,q)dμ=1, and are shown to scale for each n. Charges are in units of the electron charge.
FIG. 5.
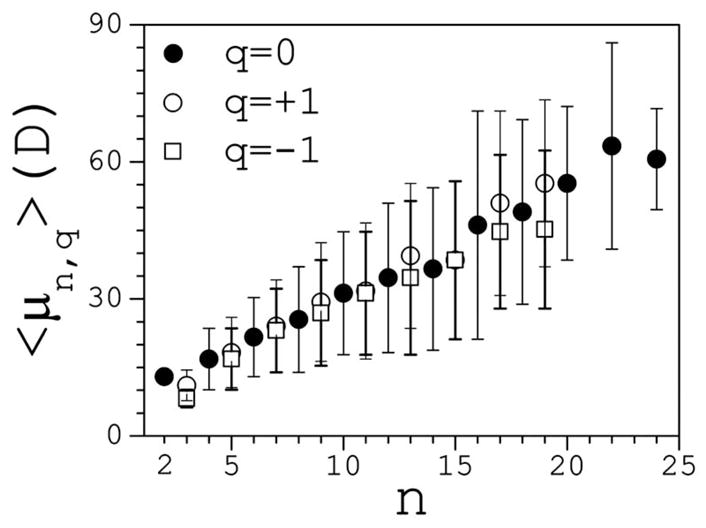
Average dipole moments 〈μ〉 as a function of the cluster size. Bars are standard deviations; statistical errors are small and omitted. For n>25 (q=0) and n>20 (q= ±1) the trend deteriorates due to insufficient statistics.
Acknowledgments
This study utilized the high-performance computer capabilities of the Biowulf PC/Linux cluster at the NIH. This work was supported by the NIH Intramural Research Program through the Center for Information Technology. The author thanks Peter Steinbach for reading the manuscript.
References
- 1.Robinson RA, Stokes RH. Electrolyte Solutions: The Measurement and Interpretation of Conductance, Chemical Potential and Diffusion in Solutions of Simple Electrolytes. Academic; New York: 1959. [Google Scholar]
- 2.Cerreta MK, Berglund KA. J Cryst Growth. 1987;84:577. [Google Scholar]
- 3.Rusli IT, Schrader GL, Larson MA. J Cryst Growth. 1989;97:345. [Google Scholar]
- 4.Georgalis Y, Kierzek AM, Saenger W. J Phys Chem B. 2000;104:3405. [Google Scholar]
- 5.Du H, Rasaiah JC, Miller JD. J Phys Chem B. 2007;111:209. doi: 10.1021/jp064659o. [DOI] [PubMed] [Google Scholar]
- 6.Degreve L, da Silva FL. J Chem Phys. 1999;111:5150. [Google Scholar]
- 7.Chen AA, Pappu RV. J Phys Chem B. 2007;111:6469. doi: 10.1021/jp0708547. [DOI] [PubMed] [Google Scholar]
- 8.Zahn D. Phys Rev Lett. 2004;92:040801. doi: 10.1103/PhysRevLett.92.040801. [DOI] [PubMed] [Google Scholar]
- 9.Sherman DM, Collongs MD. Geochem Trans. 2002;3:102. doi: 10.1186/1467-4866-3-102. [DOI] [PMC free article] [PubMed] [Google Scholar]
- 10.Simulations were carried out with the CHARMM program [22] using particle mesh Ewald summations with optimized parameters as reported in [23]. Electrostatic and van der Waals parameters of ions and the TIP3P water models are as implemented in the CHARMM force field. The water internal degrees of freedom were fixed with the SHAKE algorithm, and a time step of 2 fs was used. Data were collected every 1 ps for analysis.
- 11.Concentration-dependent self-diffusion coefficients D were calculated from the Einstein-Smoluchowski equation D=∂〈|r(t)−r(t)|2〉/6∂t at long t, where 〈 〉 denotes the average over all ions and over all time origins t0 (0< t0 <τ). The equilibration time was estimated from the diffusion of the slowest ions (Na+ at 3M, in which case D≈1.5 × 10⁻⁵ cm2/sec).
- 12.A rather restrictive definition of ion cluster is adopted here where l0 ≈ 3.5 Å is the position (independent of concentration) of the minimum in the Na+-Cl− pair correlation functions g(r) calculated from these simulations. A softer definition would use l0 ≈ 6.0 Å, the position of the second minimum, thus allowing solvent-separated pairs within clusters.
- 13.The calculation of self-diffusion coefficients [11] implies that the slowest ions in bulk require ~2 ps to travel a distance equal to the radius of a water molecule (~1.4 Å). Thus, ~2 ps is taken here as the maximum time that an ion is allowed to move away from a cluster without exchanging position with a water molecule.
- 14.Lee B, Richards FM. J Mol Biol. 1971;55:379. doi: 10.1016/0022-2836(71)90324-x. [DOI] [PubMed] [Google Scholar]
- 15.Bloomfield V, Dalton WO, van Holde KE. Biopolymers. 1967;5:135. doi: 10.1002/bip.1967.360050202. [DOI] [PubMed] [Google Scholar]
- 16.Kirkwood JG. J Polym Sci. 1954;12:1. [Google Scholar]
- 17.Hydrodynamic radii ρare calculated from the Stokes-Einstein relation ρ=kT/6πηD, where η is the viscosity coefficient of pure water. D’s were calculated as in [11]; η=0.8904 cp at 25 °C [24]. The calculations yielded ρ(Na+) ≈ 1.838 Å and ρ(Cl−) ≈ 1.206 Å.
- 18.Wiltzius P. Phys Rev Lett. 1987;58:710. doi: 10.1103/PhysRevLett.58.710. [DOI] [PubMed] [Google Scholar]
- 19.Weitz DA, et al. Phys Rev Lett. 1985;54:1416. doi: 10.1103/PhysRevLett.54.1416. [DOI] [PubMed] [Google Scholar]
- 20.van Saarlos W. Physica A. 1987;147:280. [Google Scholar]
- 21.Hassan SA. J Phys Chem B. 2005;109:21989. doi: 10.1021/jp054042r. [DOI] [PMC free article] [PubMed] [Google Scholar]
- 22.Brooks BR, et al. J Comput Chem. 1983;4:187. [Google Scholar]
- 23.Hassan SA. J Phys Chem B. 2004;108:19501. [Google Scholar]
- 24.Weast RC. CRC Handbook of Chemistry and Physics. CRC Press; West Palm Beach: 1978. [Google Scholar]


