

Summary
Animal studies suggest that arachidonate 5-lipoxygenase (encoded by ALOX5) may be a genetic determinant of bone mineral density. We tested this hypothesis in a sample of healthy men and women and did not find consistent evidence for an association between variation in this gene and either lumbar spine or femoral neck BMD.
Introduction
Phenotypic variation in bone mineral density (BMD) among healthy adults is influenced by both genetic and environmental factors. A recent mouse study implicated ALOX5, which encodes arachidonate 5-lipoxygenase, as a contributing factor to areal BMD (aBMD).
Methods
Fifteen single nucleotide polymorphisms (SNPs) distributed throughout ALOX5 were genotyped in three healthy groups: 1,688 European American, premenopausal sisters, 512 African American premenopausal sisters and 715 European American brothers. Statistical analyses were performed in the three groups to test for association between these SNPs and femoral neck and lumbar spine aBMD.
Results
Significant (p≤0.05) evidence of association was observed with three of the SNPs. However, despite the linkage disequilibrium between SNPs, adjacent SNPs did not provide statistical evidence of association in any of the three study groups.
Conclusions
These data do not provide consistent evidence of association between genomic variation in ALOX5 and clinical variability in aBMD in healthy subjects.
Keywords: ALOX5, Association, Bone mineral density, Genetics, Race, Single nucleotide polymorphism
Introduction
Bone mineral density (BMD) is a complex phenotype and is influenced by both genetic and environmental factors [1]. Environmental factors, including nutrition and physical activity, influence the attainment of peak BMD; however, genetic factors also account for as much as 80% of the variability in peak BMD attained in early adulthood [2, 3]. Racial differences occur in peak BMD; African Americans, on average, have higher peak BMD than European Americans [1].
To identify the genes contributing to the variation in BMD observed among healthy individuals, several ongoing studies have recruited multiple members within a family for detailed phenotypic evaluation which included BMD measurements at multiple skeletal sites. These phenotypic data combined with genotypic marker data have been used to perform linkage analysis to identify chromosomal regions linked to the phenotypic variation in BMD. Results from several studies suggest that multiple genes likely contribute to the observed variation in BMD [4]. Furthermore, there is growing evidence that different genes influence BMD in men and women [4–7] and that there may also be skeletal site-specific genetic effects, with different chromosomal regions linked to either spine or hip BMD [1–4, 6–10].
It has been found that 5-lipoxygenase metabolites of arachidonic acid stimulate osteoclastic bone resorption [11–13] and inhibit osteoblastic bone formation [14]. Arachidonate 5-lipoxygenase (encoded by the ALOX5 gene) belongs to a family of lipoxygenases that catalyze oxygenation of poly-unsaturated fatty acid substrates, including arachidonic and linoleic acids. In mice, Alox5 has been implicated in the negative regulation of bone development. The disruption of Alox5 in mice leads to increased bone as compared with normal mice [11, 15]. Four independent mapping studies in mice have identified a quantitative trait locus (QTL) for bone related phenotypes in the distal portion of murine chromosome 6, a region that includes the Alox5 gene [16–19]. A congenic mouse was created which is homozygous for B6 alleles throughout the entire genome except for the 25 cM region harboring Alox5, which is homozygous for the C3H donor alleles. These congenic mice had lower BMD than either the B6 background strain or the C3H donor strain [20]. Furthermore, integrative analysis of genotypic, expression and clinical trait data identified mouse Alox5 as a susceptibility gene for BMD [15]. Therefore, its human homologue, ALOX5, is a strong candidate gene that may contribute to the BMD variation in healthy subjects.
Recently, another lipoxygenase, arachidonate 15-lipoxygenase (Alox15), was identified as a negative regulator of bone development in mice [21]. Association studies of human ortholog ALOX15, and its paralog, ALOX12, revealed that polymorphisms in ALOX12 are correlated with changes in BMD [22, 23]. In light of recent findings in the related lipoxygenase gene and evidence in mice, we sought to determine in a sample of healthy sisters and brothers whether polymorphisms in ALOX5 are also associated with normal variation in peak BMD. To maximize the power of our familial sample to detect association we have performed our analysis using all genotyped members of each family. We have employed a correction for the relatedness of the subjects. This approach yields greater power than reducing the sample to only one individual per family.
Subjects and methods
Sample
Families consisting of healthy siblings were recruited from the state of Indiana to identify genes contributing to bone mass [6, 8]. Recruitment focused on families with two or more healthy sisters (n=1,002) or families with two or more healthy brothers (n=336). A small number of families meeting both criteria (at least 2 healthy sisters and 2 healthy brothers) were also included (n=25). Studies were performed at the General Clinical Research Center of Indiana University School of Medicine. Both the sister and brother studies were approved by the Institutional Review Board of Indiana University-Purdue University Indianapolis. Informed written consent was obtained from all subjects prior to their participation in the study.
The sample of sisters ranged in age from 20 to 51 years and included 766 European American and 236 African American families. Sisters were required to be within 10 years of each other in age. Women who had irregular menses, or a history of pregnancy or lactation within three months prior to enrollment were excluded. Women taking oral contraceptives were not excluded. The sample of brothers ranged in age from 18 to 61 years. There was no exclusion based on the difference in age between the brothers. A sample of African American brothers was also recruited but was not large enough to provide reliable association analysis results. Therefore, only European American brothers were included in the association analyses.
Exclusion criteria for both sisters and brothers included a history of chronic disease, use of medications known to affect bone mass or metabolism, or inability to have BMD measured because of obesity (weight >136 kg). Health and life style questionnaires were administered. A blood sample for the extraction of DNA was collected.
The presence of genetically distinct subgroups within a sample, termed population stratification, can increase the likelihood of a false positive association result. This is particularly true when a sample of unrelated individuals is analyzed. Since we had genotypes available from a previously completed 10 cM microsatellite genome screen [6], we were able to statistically test for the presence of genetically based subgroups in our two racially defined samples (European American and African American). The program Structure [24] was used to test for population stratification. A sample consisting of only one member from each of the genome screened European American (n=982) and African American (n=196) families was tested for stratification.
Using the genotypes, we obtained evidence for two groups; the two groups could clearly be categorized based on the self-reported race of the subject. The two racial groups were then each tested separately for stratification. No statistical evidence was found that there were any subgroups within the European American sample (mean probability of classification into the group was 0.99) or the African American sample (mean probability of classification into the group was 0.93).
BMD, height and weight measurements
Areal BMD (aBMD) at the lumbar spine (vertebrae L2-L4) and femoral neck were measured by dual energy X-ray absorptiometry (DXA), using two DPX-L and one Prodigy instrument (GE Lunar Corp., Madison, Wisconsin). All three DXA instruments were cross-calibrated weekly using a step-wedge phantom. There was no detectable systematic difference between the three machines over the course of the study. The coefficient of variation on duplicate measurements after repositioning was 1.0% for femoral neck and lumbar spine. Siblings were measured on the same instrument. Height and weight were measured using a Harpenden stadiometer and a Scale-Tronix weighing scale, respectively which were regularly calibrated.
SNP selection
Fifteen SNPs distributed throughout the 14 exons and extending approximately 16 kb upstream and 11 kb downstream of ALOX5 were selected for genotyping. Thirteen SNPs were selected because they had a minor allele frequency of ≥0.1 in the European American (CEU) samples genotyped as part of HapMap. One additional SNP was genotyped to provide better coverage of ALOX5. A nonsynonymous SNP in exon 6 (rs2228065; Glu254Lys) was also genotyped. Genotyping of SNPs was performed using the iPLEX genotyping assays on a MassARRAY® platform (Sequenom Inc., San Diego, CA). The SNPs were also genotyped in the available parental DNA. These genotypes were used to identify Mendelian inconsistencies in the SNP genotypes [26]. Using one randomly selected individual in each family, we tested each SNP for a significant (p<0.001) deviation from Hardy Weinberg equilibrium. The missing rate for SNP genotyping ranged from 2% to 5%.
The program HAPLOVIEW [27] was employed to examine the extent of linkage disequilibrium (LD) between the SNPs to ensure that the SNP density was sufficient to evaluate evidence of association. LD (D′ statistic) was evaluated separately in the European American and African American samples using one randomly selected individual in each family. SNP Tagger [25] (http://www.broad.mit.edu/mpg/tagger/) was used to estimate how well the selected SNPs represented the genetic information contained in non-genotyped SNPs in the ALOX5 region. The extent to which the genotyped SNPs correlated with all HapMap SNPs in the two regions was evaluated for different levels of LD, with the r2 statistic.
Statistical analyses
Analyses performed in this sample of men and women have found only age and weight to be significant covariates of aBMD [6, 8]; therefore, regression residuals, representing age and weight-adjusted aBMD were computed separately in each of the three study groups and used in all subsequent analyses.
Association analyses were performed using the program PedGenie [28], which tests population-based hypotheses regarding disease associations while properly accounting for relatedness of study subjects who are members of the same pedigree. This is achieved by computing a statistic equivalent to the traditional ANOVA F-statistic using the full sample, and then employing a permutation approach using the phenotype and genotype data observed to determine the empirical distribution of this statistic. P-values reported for association are empiric p-values obtained from the PedGenie method.
Results
A sample of 2,915 subjects completed detailed phenotypic assessment (Table 1). DNA was obtained from the parents in many of these families increasing the genotypic dataset to 3,851 individuals. Fifteen SNPs were genotyped throughout the 14 exons, as well as the promoter, upstream and downstream flanking regions of ALOX5 (Fig. 1; Table 2). In both the European American and African American samples, there was no significant (p<0.001) deviation from Hardy Weinberg equilibrium for any of the SNPs. LD between adjacent SNPs was high in the European American samples (average D′= 0.95; Fig. 2a) and the patterns of LD were consistent with those found in the European American HapMap database. The LD in the African American sample (average D′=0.91) was also sufficient to evaluate the evidence of association throughout the gene, despite differences in the LD pattern as compared with the European American sample (Fig. 2b).
Table 1.
Sample characteristics
| EA1 women | AA2 women | EA1 men | |
|---|---|---|---|
| Number of families | 766 | 236 | 336 |
| Number of sibling subjects | 1688 | 512 | 715 |
| Number of genotyped parents | 634 | 69 | 233 |
| Age, years3 | 33.1±7.2 | 33.0±6.6 | 33.7±10.9 |
| Height, cm3 | 165.4±6.0 | 164.4±6.2 | 178.1±6.9 |
| Weight, kg3 | 69.8±16.4 | 81.9±19.8 | 87.1±16.9 |
| Spine BMD, g/cm23 | 1.27±0.14 | 1.34±0.14 | 1.27±0.16 |
| Femoral neck BMD, g/cm23 | 1.02±0.13 | 1.11±0.15 | 1.09±0.17 |
European American;
African American;
mean ± SD
Fig. 1.

Structure of ALOX5 and location of the genotyped SNPs (NCBI Build 36.1). The circles indicate SNPs genotyped in this study. The vertical lines denote exons
Table 2.
SNP association results
| EA4 women
|
AA5 women
|
EA4 men
|
||||||||
|---|---|---|---|---|---|---|---|---|---|---|
| SNP Id | Chr position1 | SNP location2 | EA MAF3 | AA MAF3 | Neck p-value | Spine p-value | Neck p-value | Spine p-value | Neck p-value | Spine p-value |
| rs7477350 | 45,173,955 | 5′ | 0.38 | 0.29 | 0.21 | 0.15 | 0.69 | 0.97 | 0.94 | 0.41 |
| rs7084793 | 45,185,085 | 5′ | 0.16 | 0.20 | 0.47 | 0.73 | 0.04 | 0.19 | 0.15 | 0.02 |
| rs3824612 | 45,192,870 | Intron 1 | 0.38 | 0.09 | 0.45 | 0.26 | 0.95 | 0.77 | 0.64 | 1.00 |
| rs7099684 | 45,217,161 | Intron 3 | 0.19 | 0.11 | 0.44 | 0.53 | 0.68 | 0.11 | 0.59 | 0.25 |
| rs1369214 | 45,220,735 | Intron 3 | 0.47 | 0.50 | 0.80 | 0.35 | 0.72 | 0.36 | 0.96 | 0.69 |
| rs2115819 | 45,221,095 | Intron 3 | 0.47 | 0.25 | 0.67 | 0.36 | 0.28 | 0.72 | 0.89 | 0.57 |
| rs11239516 | 45,222,543 | Intron 3 | 0.14 | 0.14 | 0.39 | 0.45 | 0.49 | 0.87 | 0.43 | 0.70 |
| rs7894352 | 45,222,918 | Intron 3 | 0.19 | 0.11 | 0.62 | 0.71 | 0.58 | 0.14 | 0.84 | 0.41 |
| rs10900213 | 45,224,720 | Intron 3 | 0.44 | 0.41 | 0.34 | 0.44 | 0.20 | 0.72 | 0.78 | 0.94 |
| rs10900215 | 45,227,460 | Intron 3 | 0.14 | 0.26 | 0.63 | 0.46 | 0.31 | 0.58 | 0.43 | 0.70 |
| rs3780901 | 45,237,382 | Intron 4 | 0.31 | 0.39 | 0.83 | 0.99 | 0.85 | 0.17 | 0.30 | 0.006 |
| rs2228065 | 45,240,512 | Exon 6 | 0.00 | 0.09 | N/A6 | N/A | 0.67 | 0.95 | N/A | N/A |
| rs4540799 | 45,250,791 | Intron 7 | 0.30 | 0.12 | 0.29 | 0.22 | 0.58 | 0.30 | 0.13 | 0.08 |
| rs2291427 | 45,256,230 | Intron 8 | 0.32 | 0.16 | 0.18 | 0.24 | 0.33 | 0.08 | 0.17 | 0.20 |
| rs3802548 | 45,272,751 | 3′ | 0.25 | 0.22 | 0.59 | 0.59 | 0.92 | 0.47 | 0.06 | 0.05 |
Chromosome positions are based on NCBI Human Genome Assembly v. 36.2.
Position within or near gene.
Minor allele frequency.
European American.
African American.
N/A indicates result not available due to low minor allele frequency which invalidates the test of association.
Fig. 2.
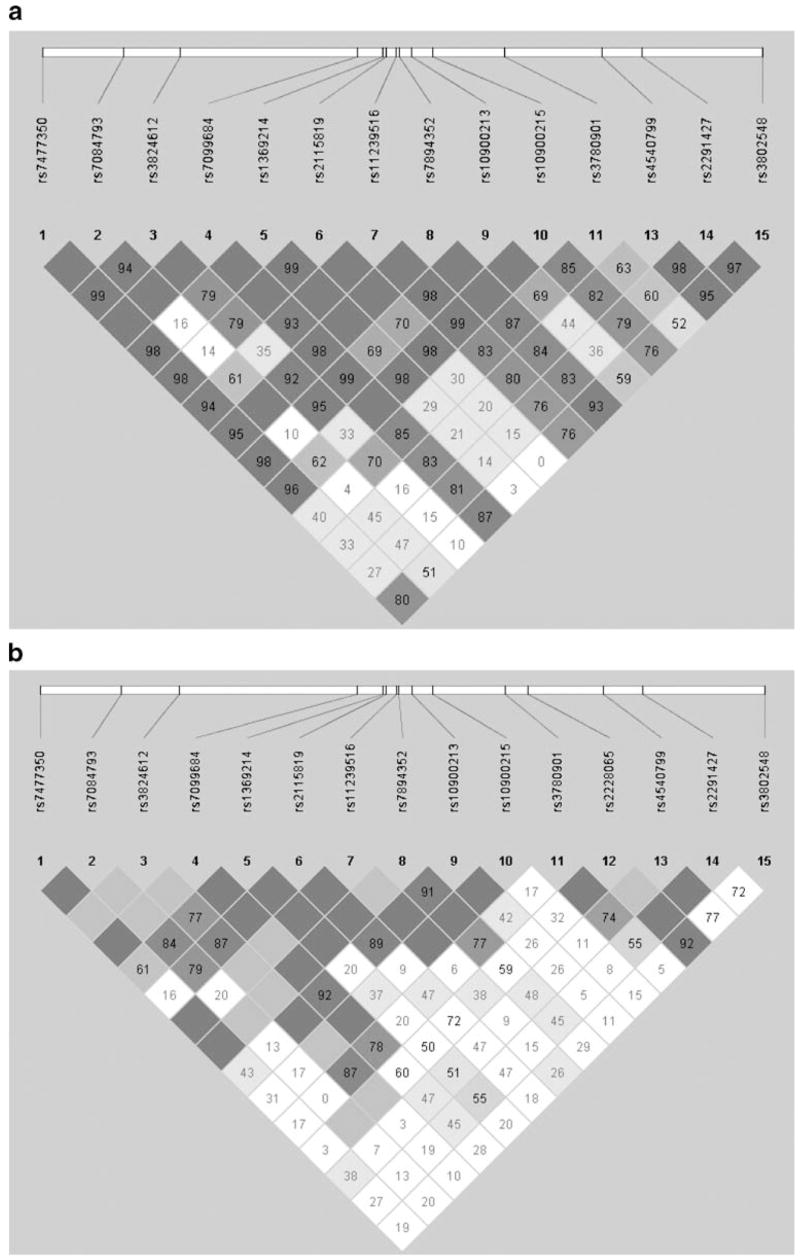
Linkage disequilibrium (LD) computed between the genotyped SNPs in ALOX5. The pair-wise D′ statistic is shown within each box (range 0–100; 0 indicating no LD; 100 indicating complete LD). The degree of shading represents the extent of LD. Darker shades indicate greater LD, lighter shades indicate less LD. When no number is shown within a box, and the box is dark gray, the corresponding D′ is 100 (complete linkage disequilibrium). a. European American samples; b. African American samples
Thirteen of the 15 SNPs were in the HapMap database and had genotype data for European Americans. To further evaluate whether the SNPs genotyped in this study provided adequate representation of the sequence information in this chromosomal region, we compared the genotypic information in these 13 SNPs with the genotypic data available from all ALOX5 SNPs genotyped in the European American HapMap database. From this comparison, we estimate that the 13 SNPs genotyped in this study captured the genotypic information (with an r2 ≥0.5) contained in 78% of the SNPs in the region that have a minor allele frequency ≥ 0.05. Because two of the 15 genotyped SNPs were not present in the HapMap database, these estimates of our SNP coverage of ALOX5 gene are an underestimate. HapMap only contains SNP data from Yorubas (Africans) rather than African Americans; therefore, a similar comparison of SNP coverage was not possible in the African American sample.
Among the 15 SNPs analyzed, one yielded nominal evidence for an association (p<0.05) with femoral neck aBMD in African American women, and two with lumbar spine aBMD in European American men. In no case did the flanking SNPs provide any evidence for association, despite substantial LD. Only one of these SNPs, rs3780901, yielded a p-value less than 0.01; this was in the brother sample when tested for association with lumbar spine aBMD. Notably, there was no evidence for association when the adjacent SNPs were evaluated, suggesting that these results are most likely to be a false positive association.
Discussion
Combining genotypic, gene expression and clinical data from various mouse models led researchers to postulate that arachidonate 5-lipoxygenase influences bone traits as well as other metabolic measures [15]. The Alox5 allele carried by the DBA mouse, which has higher BMD than B6, contains a sequence variation that reduces the enzymatic activity of arachidonate 5-lipoxygenase. Furthermore, Alox5 −/− mice, which have decreased arachidonate 5-lipoxygenase expression, had higher BMD compared to normal mice [11, 15]. These lines of evidence suggested that variation in ALOX5 in humans might contribute to the observed variation in BMD.
We tested 15 SNPs throughout ALOX5 to test for association with variation that might affect gene expression or protein function. These SNPs spanned a region from 16 kb upstream of the first exon to 11 kb downstream of the final exon, which is likely to cover most, if not all, regulatory elements of ALOX5.
In evaluating the evidence of association, we considered two important factors. First, we employed a more stringent statistical threshold for association (p<0.01), that we felt would limit the likelihood of a false positive result. Second, we reviewed the pattern of the association results in the context of the LD between SNPs. In the event of a true association with aBMD, we expected to see significant association results across several SNPs which were in LD with each other.
Only one SNP met our nominal significance level (p<0.01). Flanking SNPs did not show any evidence of association, despite high to moderate LD with adjacent SNPs. This SNP was not found in any apparent functional or conserved regions of the gene (nor were the other two that met a looser standard of p<0.05). Thus, we interpret these data as false positives. Even if the association is true, we estimated by randomly selecting one brother from each of the families that the genotypes at SNP rs3780901 could account for no more than 1.9% of the variation in spine aBMD in men; there was no evidence for an effect in women.
It is interesting to speculate why variations in ALOX5 are associated with BMD in mouse but are not associated in humans. It is possible that ALOX5 is strongly influenced by variation in other genes in humans that are not present in inbred strains of mice. It is also possible that the effects of ALOX5 on BMD are so small as to be undetectable in samples of the size of this study. Our largest sample is the group of 1,688 European American premenopausal women. When employing one randomly selected sister per family (n=766), we have 80% power to detect an association accounting for 1.8% of the variation in aBMD with an alpha of 0.01. We saw no evidence in this sample.
Our study had several strengths. All analyses were performed separately in the three study groups because of the sex and racial differences in BMD as well as the racial differences in SNP allele frequencies and patterns of LD. By performing the analyses in each group separately, we had the ability to detect race-specific or sex-specific effects. We also performed analyses that indicated there was no evidence of stratification in either our European American or African American samples. We genotyped fifteen SNPs distributed throughout the coding region of ALOX5 and also extending upstream and downstream of the gene. This allowed us to evaluate the evidence of association anywhere within the gene. We also employed rigorous statistical criteria to limit the likelihood of a false positive result.
In summary, we have evaluated the evidence for association of SNPs in ALOX5 with variation in BMD. We genotyped 15 SNPs throughout the gene, and did not find consistent evidence of association in any of our three study populations. We interpret these data to suggest that variation in ALOX5 is unlikely to be a clinically significant risk factor contributing to peak BMD.
Acknowledgments
We thank the siblings who participated in this study, as well as the study coordinators, without whom this work would not have been possible. This work was supported by National Institutes of Health grants P01 AG-18397 and M01 RR-00750. SNP genotyping by MALDI-TOF mass spectrometry used the facilities of the Center for Medical Genomics at Indiana University School of Medicine, which is supported in part by a grant from the Indiana Genomics Initiative (INGEN). INGEN is supported in part by the Lilly Endowment, Inc.
References
- 1.Peacock M, Turner CH, Econs MJ, Foroud T. Genetics of osteoporosis. Endocr Rev. 2002;23:303–326. doi: 10.1210/edrv.23.3.0464. [DOI] [PubMed] [Google Scholar]
- 2.Hustmyer FG, Peacock M, Hui S, Johnston CC, Christian J. Bone mineral density in relation to polymorphism at the vitamin D receptor gene locus. J Clin Invest. 1994;94:2130–2134. doi: 10.1172/JCI117568. [DOI] [PMC free article] [PubMed] [Google Scholar]
- 3.Slemenda CW, Miller JZ, Hui SL, Reister TK, Johnston CC., Jr Role of physical activity in the development of skeletal mass in children. J Bone Miner Res. 1991;6:1227–1233. doi: 10.1002/jbmr.5650061113. [DOI] [PubMed] [Google Scholar]
- 4.Ioannidis JP, Ng MY, Sham PC, Zintzaras E, Lewis CM, Deng HW, Econs MJ, Karasik D, Devoto M, Kammerer CM, Spector T, Andrew T, Cupples LA, Duncan EL, Foroud T, Kiel DP, Koller D, Langdahl B, Mitchell BD, Peacock M, Recker R, Shen H, Sol-Church K, Spotila LD, Uitterlinden AG, Wilson SG, Kung AW, Ralston SH. Meta-analysis of genome-wide scans provides evidence for sex-and site-specific regulation of bone mass. J Bone Miner Res. 2007;22:173–183. doi: 10.1359/jbmr.060806. [DOI] [PMC free article] [PubMed] [Google Scholar]
- 5.Huang QY, Ng MY, Cheung CL, Chan V, Sham PC, Kung AW. Identification of two sex-specific quantitative trait loci in chromosome 11q for hip bone mineral density in Chinese. Hum Hered. 2006;61:237–243. doi: 10.1159/000095216. [DOI] [PubMed] [Google Scholar]
- 6.Peacock M, Koller DL, Fishburn T, Krishnan S, Lai D, Hui S, Johnston CC, Foroud T, Econs MJ. Sex-specific and non-sex-specific quantitative trait loci contribute to normal variation in bone mineral density in men. J Clin Endocrinol Metab. 2005;90:3060–3066. doi: 10.1210/jc.2004-2143. [DOI] [PubMed] [Google Scholar]
- 7.Peacock M, Koller DL, Lai D, Hui S, Foroud T, Econs MJ. Sex-specific quantitative trait loci contribute to normal variation in bone structure at the proximal femur in men. Bone. 2005;37:467–473. doi: 10.1016/j.bone.2005.05.005. [DOI] [PMC free article] [PubMed] [Google Scholar]
- 8.Econs MJ, Koller DL, Hui SL, Fishburn T, Conneally PM, Johnston CC, Jr, Peacock M, Foroud TM. Confirmation of linkage to chromosome 1q for peak vertebral bone mineral density in premenopausal white women. Am J Hum Genet. 2004;74:223–228. doi: 10.1086/381401. [DOI] [PMC free article] [PubMed] [Google Scholar]
- 9.Koller DL, Ichikawa S, Johnson ML, Lai D, Xuei X, Edenberg HJ, Conneally PM, Hui SL, Johnston CC, Peacock M, Foroud T, Econs MJ. Contribution of the LRP5 gene to normal variation in peak BMD in women. J Bone Miner Res. 2005;20:75–80. doi: 10.1359/JBMR.041019. [DOI] [PubMed] [Google Scholar]
- 10.Peacock M, Koller DL, Hui S, Johnston CC, Foroud T, Econs MJ. Peak bone mineral density at the hip is linked to chromosomes 14q and 15q. Osteoporos Int. 2004;15:489–496. doi: 10.1007/s00198-003-1560-7. [DOI] [PubMed] [Google Scholar]
- 11.Bonewald LF, Flynn M, Qiao M, Dallas MR, Mundy GR, Boyce BF. Mice lacking 5-lipoxygenase have increased cortical bone thickness. Adv Exp Med Biol. 1997;433:299–302. doi: 10.1007/978-1-4899-1810-9_63. [DOI] [PubMed] [Google Scholar]
- 12.Gallwitz WE, Mundy GR, Lee CH, Qiao M, Roodman GD, Raftery M, Gaskell SJ, Bonewald LF. 5-Lipoxygenase metabolites of arachidonic acid stimulate isolated osteoclasts to resorb calcified matrices. J Biol Chem. 1993;268:10087–10094. [PubMed] [Google Scholar]
- 13.Garcia C, Boyce BF, Gilles J, Dallas M, Qiao M, Mundy GR, Bonewald LF. Leukotriene B4 stimulates osteoclastic bone resorption both in vitro and in vivo. J Bone Miner Res. 1996;11:1619–1627. doi: 10.1002/jbmr.5650111105. [DOI] [PubMed] [Google Scholar]
- 14.Traianedes K, Dallas MR, Garrett IR, Mundy GR, Bonewald LF. 5-Lipoxygenase metabolites inhibit bone formation in vitro. Endocrinology. 1998;139:3178–3184. doi: 10.1210/endo.139.7.6115. [DOI] [PubMed] [Google Scholar]
- 15.Mehrabian M, Allayee H, Stockton J, Lum PY, Drake TA, Castellani LW, Suh M, Armour C, Edwards S, Lamb J, Lusis AJ, Schadt EE. Integrating genotypic and expression data in a segregating mouse population to identify 5-lipoxygenase as a susceptibility gene for obesity and bone traits. Nat Genet. 2005;37:1224–1233. doi: 10.1038/ng1619. [DOI] [PubMed] [Google Scholar]
- 16.Beamer WG, Shultz KL, Donahue LR, Churchill GA, Sen S, Wergedal JR, Baylink DJ, Rosen CJ. Quantitative trait loci for femoral and lumbar vertebral bone mineral density in C57BL/6J and C3H/HeJ inbred strains of mice. J Bone Miner Res. 2001;16:1195–1206. doi: 10.1359/jbmr.2001.16.7.1195. [DOI] [PubMed] [Google Scholar]
- 17.Drake TA, Schadt E, Hannani K, Kabo JM, Krass K, Colinayo V, Greaser LE, III, Goldin J, Lusis AJ. Genetic loci determining bone density in mice with diet-induced atherosclerosis. Physiol Genomics. 2001;5:205–215. doi: 10.1152/physiolgenomics.2001.5.4.205. [DOI] [PubMed] [Google Scholar]
- 18.Klein RF, Turner RJ, Skinner LD, Vartanian KA, Serang M, Carlos AS, Shea M, Belknap JK, Orwoll ES. Mapping quantitative trait loci that influence femoral cross-sectional area in mice. J Bone Miner Res. 2002;17:1752–1760. doi: 10.1359/jbmr.2002.17.10.1752. [DOI] [PubMed] [Google Scholar]
- 19.Volkman SK, Galecki AT, Burke DT, Paczas MR, Moalli MR, Miller RA, Goldstein SA. Quantitative trait loci for femoral size and shape in a genetically heterogeneous mouse population. J Bone Miner Res. 2003;18:1497–1505. doi: 10.1359/jbmr.2003.18.8.1497. [DOI] [PubMed] [Google Scholar]
- 20.Bouxsein ML, Rosen CJ, Turner CH, Ackert CL, Shultz KL, Donahue LR, Churchill G, Adamo ML, Powell DR, Turner RT, Muller R, Beamer WG. Generation of a new congenic mouse strain to test the relationships among serum insulin-like growth factor I, bone mineral density, and skeletal morphology in vivo. J Bone Miner Res. 2002;17:570–579. doi: 10.1359/jbmr.2002.17.4.570. [DOI] [PubMed] [Google Scholar]
- 21.Klein RF, Allard J, Avnur Z, Nikolcheva T, Rotstein D, Carlos AS, Shea M, Waters RV, Belknap JK, Peltz G, Orwoll ES. Regulation of bone mass in mice by the lipoxygenase gene Alox15. Science. 2004;303:229–232. doi: 10.1126/science.1090985. [DOI] [PubMed] [Google Scholar]
- 22.Ichikawa S, Koller DL, Johnson ML, Lai D, Xuei X, Edenberg HJ, Klein RF, Orwoll ES, Hui SL, Foroud TM, Peacock M, Econs MJ. Human ALOX12, but not ALOX15, is associated with BMD in white men and women. J Bone Miner Res. 2006;21:556–564. doi: 10.1359/jbmr.051212. [DOI] [PubMed] [Google Scholar]
- 23.Mullin BH, Spector TD, Curtis CC, Ong GN, Hart DJ, Hakim AJ, Worthy T, Wilson SG. Polymorphisms in ALOX12, but not ALOX15, are significantly associated with BMD in postmeno-pausal women. Calcif Tissue Int. 2007 doi: 10.1007/s00223-007-9023-3. [DOI] [PubMed] [Google Scholar]
- 24.Pritchard JK, Stephens M, Rosenberg NA, Donnelly P. Association mapping in structured populations. Am J Hum Genet. 2000;67:170–181. doi: 10.1086/302959. [DOI] [PMC free article] [PubMed] [Google Scholar]
- 25.de Bakker PI, Yelensky R, Pe’er I, Gabriel SB, Daly MJ, Altshuler D. Efficiency and power in genetic association studies. Nat Genet. 2005;37:1217–1223. doi: 10.1038/ng1669. [DOI] [PubMed] [Google Scholar]
- 26.O’Connell JR, Weeks DE. PedCheck: a program for identification of genotype incompatibilities in linkage analysis. Am J Hum Genet. 1998;63:259–266. doi: 10.1086/301904. [DOI] [PMC free article] [PubMed] [Google Scholar]
- 27.Barrett JC, Fry B, Maller J, Daly MJ. Haploview: analysis and visualization of LD and haplotype maps. Bioinformatics. 2005;21:263–265. doi: 10.1093/bioinformatics/bth457. [DOI] [PubMed] [Google Scholar]
- 28.Allen-Brady K, Wong J, Camp NJ. PedGenie: an analysis approach for genetic association testing in extended pedigrees and genealogies of arbitrary size. BMC Bioinformatics. 2006;7:209. doi: 10.1186/1471-2105-7-209. [DOI] [PMC free article] [PubMed] [Google Scholar]