

Abstract
This study used functional magnetic resonance imaging (fMRI) to clarify the sites of brain activity associated with the antidepressant effects of sleep deprivation (SD). We hypothesized: 1) depressed responders’ baseline ventral anterior cingulate (AC) perfusion will be greater than that of nonresponders and controls; 2) following partial sleep deprivation (PSD), ventral AC perfusion will significantly decrease in responders only. Seventeen unmedicated outpatients with current major depression and eight controls received perfusion-weighted fMRI and structural MRI at baseline and following 1 night of late-night PSD. Talairach-transformed gray matter masks were merged with Talairach Daemon-based region of interest (ROI) templates. Baseline left ventral AC (LVAC) perfusion was greater in responders than nonresponders. There was no difference involving the medial frontal cortex. Responders’ LVAC perfusion dropped from baseline to PSD scans compared with nonresponders and controls, as did perfusion in the right dorsal AC. In the patient group as a whole, decrease in LVAC perfusion from baseline to PSD scans correlated directly with the decrease in the modified 17-item Hamilton Depression Rating Scale (HDRS17) between baseline and PSD conditions. These data–the first using fMRI–show greater anatomic specificity than previous findings of SD and depression in linking decreased brain activity in this area with clinical improvement.
Keywords: Cingulate gyrus, Depressive disorder, Major depression
1. Introduction
1.1. Antidepressant effects of sleep deprivation
One of the most fascinating phenomena in all of biological psychiatry is the antidepressant effect of sleep deprivation (SD) (Wu and Bunney, 1990). Based on numerous studies including over 1700 patients studied during the past three decades, total and partial SD prduced temporary remissions in depressive symptoms in 40–60% of subjects, including hundreds who were not taking medication. The antidepressant effects of total SD (TSD) and partial SD (PSD) generally begin within hours and usually disappear with even brief amounts of sleep. Yet its rapid onset and offset make SD an almost ideal experimental model of an antidepressant therapy; a patient can be studied before and after a clinically significant effect within a 36-h period—without the confounding effects of medications.
However, mechanisms of the antidepressant effects of sleep deprivation (SD) remain unclear. Positron emission tomography (PET) and single photon emission computed tomography (SPECT) studies of SD report at least one area in which responders and nonresponders differ significantly at baseline, with most studies reporting that baseline ventral anterior cingulate (AC), basal orbital, or medial frontal activity is greater in responders than in nonresponders. Moreover, all studies reported a differential response to SD in responders and nonresponders, with significantly reduced anterior cingulate cortex activity in responders but not in nonresponders (Ebert et al., 1991; Volk et al., 1992; Wu et al., 1992; Ebert et al., 1994; Wu et al., 1999). In a study of six geriatric depressed patients (including five TSD responders), relative glucose metabolism decreased from baseline to TSD in AC (BA 24) (Smith et al., 1999). Similar imaging findings, involving changes in the basal orbital/medial frontal cortex, especially the AC, have been linked with clinical response to antidepressant medications (Buchsbaum et al., 1997; Mayberg et al., 1997). In the only study that reported correlations between graded measures of clinical response to SD and changes in regional activity with SD (Wu et al., 1999), the amount of decrease in left medial prefrontal cortex (Brodmann’s area (BA) 10/32) activity following SD correlated with the percent decrease in depressive severity. Another study, which involved a 12-week course of paroxetine following TSD, reported correlations between decrease in glucose metabolism from baseline to TSD and the decrease in 17-item Hamilton Depression Rating Scale score from baseline to 12 weeks. This study reported positive correlations in AC and medial frontal cortex as well as bilateral precuneus. However, it did not report correlations between change in glucose metabolism from baseline to TSD and change in depression severity immediately after TSD (Smith et al., 2002).
Although PET and SPECT studies identified several regions of the medial prefrontal cortex, the spatial resolution (6–7 mm for PET) limited the precision with which sites associated with a positive antidepressant response to SD could be described. The purpose of this study was to use the superior spatial resolution of functional MRI (fMRI) to identify more precisely sites of brain activity alterations associated with the antidepressant effects of SD. Based on the previous imaging literature (especially Wu et al., 1999), we hypothesized that elevated baseline perfusion in the ventral AC would be observed in treatment responders compared with nonresponders, that responders but neither nonresponders nor healthy controls would display decreased perfusion from baseline to SD, especially in the ventral AC, and that the decline in perfusion would be correlated with decreased severity of depressive symptoms. Using an arterial spin labeling (ASL) based fMRI method, we examined perfusion in response to SD in six medial frontal regions of interest (ROIs) (dorsal AC, rostral AC, ventral AC, dorsal medial frontal cortex, rostral medial frontal cortex, and ventral medial frontal cortex) bilaterally for a total of 12 regions of interest to determine the specificity of this response.
1.2. Perfusion-weighted functional MRI
Several features of the arterial spin labeling (ASL) pulse sequence used made it an excellent choice for this study. ASL techniques can be thought of as similar to other diffusible tracer imaging techniques (e.g., H215O-PET), with “tagged” blood (e.g., blood that has been magnetically inverted proximal to the imaging region) as the “tracer.” This fMRI/tracer method facilitates comparisons with previous PET and SPECT studies of SD in depression, yet it does not require injection of a tracer (e.g., gadolinium) or the use of ionizing radiation. For the pulse sequence used in this study, the actual measured perfusion is the difference between measured tagged and untagged (control) signal intensity as the tagged blood flows through the slices of interest.
By performing ASL, we can obtain average perfusion values that greatly facilitate within-subjects comparisons. While relative changes in blood oxygen level dependent (BOLD) signal can be measured with reliability and precision, signal intensity for a comparison task or condition may vary between runs; even BOLD data from individual runs require correction for baseline drift. This variability represents a serious potential problem for within-subjects designs in which data from separate scanning sessions on separate days are compared.
The ASL perfusion signal is more closely localized to arterioles and capillaries than is the more conventionally used BOLD signal and, thus, provides superior localization of neural activity than does BOLD, which tends to reflect venous signals downstream from the neural tissue driving the vascular response (Wong et al., 1998). Moreover, ASL provides a measure of baseline perfusion in MR units proportional to local blood flow measured in ml blood/ml tissue/minute units (Wong et al., 1997, 1998; Clark et al., 2001). The spiral ASL acquisition technique we are using collects low spatial frequencies with every view, making the perfusion images relatively robust to movement effects (Glover and Lee, 1995).
2. Methods
2.1. Subjects
To enter the study, depressed subjects (ages 18–55) had to meet full diagnostic criteria for current DSM-IV major depressive disorder (unipolar) and to have a baseline 17-item Hamilton Depression Rating Scale (HDRS17) score of 16 or greater. Control subjects had no psychiatric disorders and were matched group-wise for age, sex, handedness, education, and tobacco use. Exclusion criteria included other Axis I disorders; conditions that might be exacerbated by sleep deprivation (e.g., epilepsy or bipolar disorder); potential safety contraindications to MRI (pacemakers, metal implants, pregnancy, lactation); irregular or deviant sleep cycle or primary sleep disorders; active substance abuse or dependence; history of alcohol or cocaine abuse or dependence; neurological problems or history of significant head injury; significant circulatory conditions (including hypertension) that could affect the cerebral circulation; and recent use of medications or substances that could affect sleep pattern, EEG, and/or patterns of brain blood flow.
All subjects received the Structured Clinical Interview for DSM-IV (SCID) (First et al., 1996) as well as a thorough medical and laboratory evaluations as previously described (Clark et al., 1999). All subjects were physically healthy and medication free for at least 2 weeks at the time of the study. (No patient took fluoxetine during the 2 months before the study.) All subjects signed consent forms approved by the UCSD Human Research Protections Program.
2.2. General procedures
Subjects spent an adaptation night, a baseline night, and a night of PSD in the sleep laboratory, with standard montage and scoring (Clark et al., 1999). On the PSD night, subjects had to remain awake beginning at 03.00 h and were closely supervised by laboratory personnel.
To minimize the impact of any differential effects of fMRI scanning on anxiety from the first to the second scan, the baseline and PSD nights were performed in counterbalanced order. Because of MRI scan availability, baseline and PSD nights for each subject were performed 1 week apart. Thus, given the brief duration of the antidepressant effects of SD, residual effects of PSD performed first would not have been expected to persist into the baseline night (Wu and Bunney, 1990).
Structural and perfusion MRI were performed on all subjects at approximately noon on baseline and sleep-deprived days. Mood ratings, including the HDRS17, were administered on baseline and sleep-deprived days at 08.00 h and before and after each scanning session. Clinical response was quantified by the decrease in the modified HDRS17 (HDRS17Mod) (e.g., omitting the sleep and weight loss items) from baseline to the lowest score following PSD. Responders and nonresponders were distinguished by a decrease of 40% or greater in the HDRS17Mod (Wu et al., 1999).
2.3. fMRI procedures
2.3.1. MRI scanning
All subjects were scanned on a General Electric Signa 1.5 Tesla scanner, using a standard head coil. Subjects were instructed to relax but remain awake and motionless throughout the scans; they were fitted with soft ear plugs and positioned carefully in the head coil with comfortable supports and cushions. To verify that subjects remained awake during scans, subjects were asked to keep their eyes open and to apply continuous gentle tonic pressure to a soft rubber bulb connected to a pressure transducer and computer monitor.
Structural SPGR scans were performed using the following T1 weighted sequence: TR-20 ms, TE-minimum full, flip angle-30°, FOV-250 mm, NEX-1, with 124 sagittal slices 1.5 mm thick and in-plane resolution of 0.9765 × 0.9765 mm.
Perfusion-weighted-axial images were obtained using a spiral imaging (Li et al., 1999) refinement of the QUIPSS II pulsed arterial spin labeling (Wong et al., 1997, 1998) sequence developed at UCSD. Two slabs of nine 7-mm-thick axial slices (in-plane resolution of 1.875 mm by 1.875 mm) were obtained, covering the entire cerebrum, with the following parameters: TR-3500 ms, TE-minimum; TI1-700 ms; TI2-1400 ms; flip angle-90°, FOV-240 mm, 100 repetitions.
2.3.2. Data processing and analysis
Data were analyzed using AFNI (Analysis of Functional NeuroImages) 2.56 g (Cox, 1996) and SPSS 11.0 (Chicago, IL). In preparation for creating a gray matter mask for region of interest (ROI) analyses, structural images were corrected for field inhomogeneities with a nonparametric, nonuniform intensity normalization algorithm, N3 (Sled et al., 1998), and subjected to several skull-stripping steps. Removal of non-brain regions with skull-stripping improved tissue segmentation for the creation of a gray matter mask. Preliminary skull stripping was performed with a Hybrid Watershed algorithm (Dale et al., 1999; Segonne et al., 2004 (as in Free-Surfer)). Remaining non-brain tissue was removed with AFNI 3dIntracranial iteratively (with varying minimum signal intensity values) in order to strip as much extraneous tissue as possible without removing brain tissue. The strategy of using two automated skull-stripping programs, which involve quite different segmentation algorithms, often produces a more satisfactory total brain volume than using these routines singularly (Fennema-Notestine et al., 2006). After these steps, we manually edited any images where tissue remained outside the brain.
The Hybrid Watershed uses a watershed algorithm to find local optima of image-intensity gradients to segment images into connected components (Hahn and Peitgen, 2000). This step assumes that the white matter compartment is connected. A deformable surface model is then used to find the boundary of the brain. Hybrid Watershed was developed to be conservatively sensitive to the inclusion of brain (Segonne et al., 2004 (as in FreeSurfer); Fennema-Notestine et al., 2006). The 3dIn-tracranial routine fits a three-compartment Gaussian mixture model to the gray scale intensity histogram to initially classify voxels into gray matter, white matter, and cerebrospinal fluid compartments. This step is followed by a series of steps that use global geometric constraints and neighborhood connectivity rules.
The stripped volumes of brain tissue and ventricular fluid were segmented into gray matter, white matter, and cerebrospinal fluid (CSF) compartments by fitting a three--compartment Gaussian mixture model to the intensity histogram with TriComp (Bondi et al., 2005). The resultant gray matter mask was then extracted, transformed into Talairach space (Talairach and Tournoux, 1988) and multiplied by Talairach Daemon-based ROI templates (Lancaster et al., 2000) to create standardized yet individualized templates, which were used to mask perfusion data. We based our ROIs on findings in PET studies of SD and antidepressant medications in depressed patients (Wu et al., 1999) and on Mayberg’s three-compartment model of depression (Mayberg et al., 1999).
The Mayberg model of depression proposes three general compartments associated with different signs and symptoms: dorsal, rostral, and ventral. Dysfunction in the dorsal compartment (which includes dorsal AC as well as dorsolateral prefrontal cortex and portions of inferior parietal cortex) is reflected in cognitive symptoms (e.g., psychomotor slowing and impaired attention and executive functions). Functional abnormalities in the ventral compartment (including subgenual AC along with portions of brainstem and hypothalamus) would explain disturbances of endocrine function, sleep, appetite, and sexual behavior along with somatic and autonomic symptoms. Increased activity in the ventral component, combined with decreased activity in the dorsal compartment, occurs in untreated MDD patients as well as healthy subjects during induced sad mood. With remission and/or successful treatment of depression, the pattern of ventral hyperactivity and dorsal hypoactivity reverses. The third compartment includes rostral AC and its subcortical connections, including the basal ganglia. The dorsal and ventral compartments are reciprocally connected via rostral AC. Mayberg further proposes that intact rostral compartment functioning is necessary for appropriately balanced dorsal and ventral compartment functioning.
Thus, we divided the AC into ventral, rostral, and dorsal sections, using the plane 2 mm above the inter-commissural plane to divide ventral from rostral AC and the plane 18 mm above the intercommissural plane to separate the rostral form dorsal AC. We extended these lines to the surrounding paracingulate gyri and to portions of medial frontal cortex (areas 8, 9, 10, and 12), dividing each medial frontal region into inner and outer crescents, which were subdivided into dorsal, rostral, and ventral sections of medial frontal cortex (see Fig. 1).
Fig. 1.
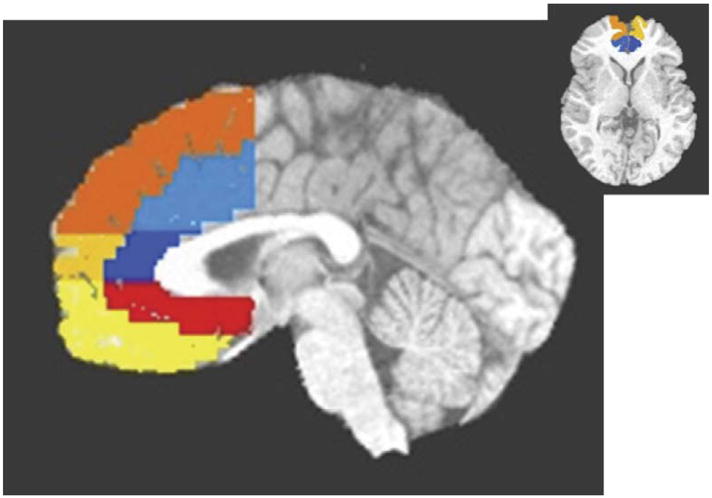
Sagittal (1 mm left of midline) and axial views of regions of interest. Light blue is dorsal anterior cingulate; dark blue is rostral anterior cingulate; red is ventral anterior cingulate; yellow is ventral medial frontal; gold is rostral medial frontal; orange is dorsal medial frontal.
To minimize movement artifact, perfusion images were coregistered to the 50th repetition. Next, for each repetition, images of the running difference between tagged and nontagged images were calculated and made into 4D (three spatial, one temporal) data sets. By using only adjacent time points, we further reduced the potential effects of movement over the course of the ASL run. Again, for this pulse sequence, the difference between tagged and control images is directly proportional to brain blood flow in ml blood/ml tissue/minute units (Wong et al., 1997, 1998; Clark et al., 2001) and is expressed in MR signal intensity units. At this point, spurious negative values were omitted for each repetition and each voxel. The first three repetitions and outlier repetitions were omitted for each voxel; the remaining repetitions were averaged. The study’s dependent variable was the mean perfusion-weighted signal averaged over an ROI.
To measure treatment response, we defined treatment change scores formed by subtracting post-PSD perfusion in an ROI from baseline perfusion. Planned comparisons, tested by standard t-tests on change scores, were used to investigate treatment response in the 12 ROIs. We used one planned comparison to compare the change from baseline to PSD among responders with change among nonresponders and controls. We used a second planned comparison to compare nonresponders and controls. Whenever either of these two-tailed tests were significant, we used a one-tailed test to investigate the directional hypothesis that perfusion would decline with treatment. Effect size for each statistical test was computed using η2.
For voxelwise analyses, we used within-sample or between-sample t-tests to test for the effect of PSD, as appropriate (Friston et al., 1994). We used a cluster threshold method to protect against Type I error (Forman et al., 1995). Our cluster threshold required a connectivity radius of 2.66 mm (e.g., the in-plane pixel length multiplied by the square root of 2), which identifies face-to-face or edge-to-edge voxels as connected, and a minimum volume of 443 mm3 (18 voxels, based on Monte Carlo simulations). Perfusion data for individual scans were spatially smoothed with a Gaussian kernel of 3.75 mm (e.g., twice the in-plane pixel length).
3. Results
Seventeen patients (male/female 5/12, 42.8 ± 9.7 years) and eight controls (male/female 4/4, 35.0 ± 9.5 years) participated in the study. Patients and controls did not differ significantly on demographic measures, nor did responders and nonresponders differ (Table 1). Baseline HDRS17 and HDRS17Mod did not differ between responders and nonresponders, although HDRS17Mod diverged with PSD (see Table 2). A group by time analysis of variance between these two groups and conditions revealed a significant interaction effect (F =11.0, df =1,15, P =0.005, η2=0.42). Five of the 17 patients were responders.
Table 1.
Demographic measures (percent or mean ± S.D.)
| Responders (n =5) | Nonresponders (n =17) | Controls (n =8) | |
|---|---|---|---|
| Female | 60.0% | 75.0% | 50% |
| Caucasian | 80.0% | 66.7% | 75% |
| Age | 43.4 ± 6.1 | 42.0 ± 10.8 | 35.0 ± 9.5 |
Responders are defined by having a decrease in the modified 17-item Hamilton Depression Rating Scale score of at least 40% with sleep deprivation.
Table 2.
Response to partial sleep deprivation
| Modified Hamilton scoresa |
||
|---|---|---|
| Baseline | Sleep-deprived | |
| Responders (5) | 16.6 ± 1.5 | 8.0 ± 2.5 |
| Nonresponders (12) | 15.3 ± 4.8 | 12.9 ± 3.7 |
17-item Hamilton Depression Rating Scale omitting sleep and weight loss items, mean ± S.D.
3.1. Regions of interest
3.1.1. Baseline
In the left ventral AC (LVAC), responders had higher baseline perfusion than nonresponders (t =2.1, df =15, 1-tailed P <0.025, η2=.23, between-groups t-test, 1-tailed) (see Table 3). No other AC/medial frontal ROIs showed significant differences between responders and nonresponders at baseline or with PSD. The maximum η2 for the other 11 a priori ROIs was 0.17. Perfusion values for left and right ventral AC, as well as the average perfusion for the remaining five ROIs in each hemisphere (e.g., rostral AC, ventral AC, dorsal medial frontal, rostral medial frontal, and ventral medial frontal) are shown in Table 3.
Table 3.
Medial frontal perfusion
| Side | Condition | Responders (5) | Nonresponders (12) | Controls (8) |
|---|---|---|---|---|
| RVAC | BL | 123.8 ± 32.2 | 124.4 ± 35.3 | 124.2 ± 33.4 |
| PSD | 111.1 ± 22.8 | 114.4 ± 38.7 | 140.4 ± 54.7 | |
| BL3PSD | 12.7 ± 23.6 | 10.0 ± 38.6 | −16.2 ± 34.2 | |
| LVAC | BL | 164.6 ± 24.1 | 135.9 ± 25.7a | 135.2 ± 53.4 |
| PSD | 115.7 ± 27.6b | 138.6 ± 41.9 | 170.0 ± 96.7 | |
| BL3PSD | 49.0 ± 26.7c | −3.3 ± 42.0 | −34.8 ± 51.5 | |
| RDAC | BL | 139.6 ± 25.5 | 115.7 ± 59.8 | 96.0 ± 32.2 |
| SD | 98.1 ± 35.4b | 108.2 ± 33.4 | 121.0 ± 42.9 | |
| BL3PSD | 41.5 ± 37.0c | 7.5 ± 40.4 | −25.0 ± 15.8 | |
| RComb | BL | 115.2 ± 26.4 | 107.7 ± 38.9 | 89.8 ± 19.6 |
| PSD | 93.7 ± 29.4 | 104.0 ± 24.3 | 94.9 ± 22.3 | |
| BL3PSD | 21.5 ± 27.2 | 3.7 ± 24.4 | −5.1 ± 24.1 | |
| LComb | BL | 130.0 ± 23.3 | 135.7 ± 36.4 | 124.9 ± 30.5 |
| PSD | 120.6 ± 17.9 | 151.3 ± 36.9 | 117.6 ± 17.4 | |
| BL3PSD | 9.4 ± 23.2 | −15.5 ± 32.1 | 7.3 ± 35.9 |
BL: baseline.
PSD: partial sleep deprivation.
BL – PSD: baseline minus partial sleep deprivation.
R: right.
L: left.
VAC: ventral anterior cingulate.
RDAC: right dorsal anterior cingulate.
Comb: combination of dorsal anterior cingulate, rostral anterior cingulate, dorsal medial frontal, rostral medial frontal, and ventral medial frontal regions.
Mean ± S.D.
Values are in gray scale MR units.
Responders greater than nonresponders.
Baseline greater than PSD.
Responders greater than nonresponders and controls.
3.1.2. Sleep-deprived condition
In the LVAC, responders’ perfusion dropped significantly from baseline compared with nonresponders and healthy volunteers (t =3.13, df =22, P =005, η2= 0.31, 2-tailed). Among responders, the magnitude of the perfusion drop from baseline to PSD was large (t = 4.10, df =4, P <0.008, η2=0.81, paired t-test, 1-tailed). Similarly, responders’ perfusion dropped significantly from baseline following PSD compared with nonresponders and controls in the right dorsal AC (RDAC) (t =2.42, df =22, P =0.035, η2=0.19). The magnitude of the perfusion drop in the RDAC of the responder group was also large (t =2.5, df =4, P <0.038, η2=0.61, paired t-test, 1-tailed). Effect sizes in all other ROIs were small and non-significant (all η2<.06). Mean perfusion among nonresponders did not significantly differ from healthy volunteers in either the LVAC or the RDAC. Finally, mean perfusion of depressed responders did not differ from controls or nonresponders in LVAC or RDAC following sleep deprivation, indicating a normalization of perfusion following PSD.
In the patient group as a whole, decrease in LVAC perfusion from baseline to PSD scans correlated directly with the decrease in the HDRS17Mod between baseline and PSD conditions (Pearson correlation coefficient 0.457, 1-tailed P <0.033). No other ROIs showed similar correlations; the second strongest Pearson correlation coefficient was −0.278.
3.2. Voxelwise analysis
3.2.1. Baseline
Cluster threshold adjusted t-test maps revealed several sites in which responders’ perfusion was greater than that of nonresponders. These occurred primarily in four general areas: LVAC (including a cluster in BA 25) extending forward into BA 11/medial frontal gyrus; left rostral AC (BAs 32/24); bilateral dorsal cingulate (BA 24 extending into BA 23); and bilateral temporal areas. Temporal lobe clusters of greater baseline perfusion in responders than in nonresponders tended to be in superior and anteromedial areas (see Fig. 2).
Fig. 2.
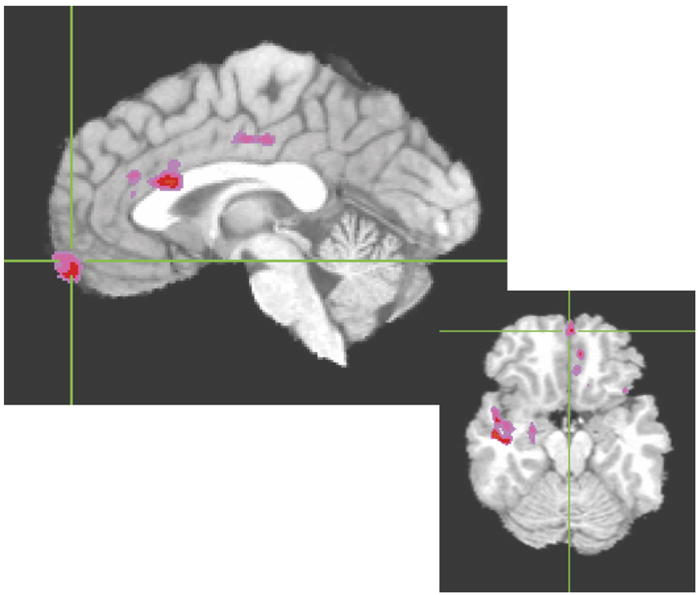
Areas in which baseline perfusion was significantly greater in responders than in nonresponders. Color areas survived cluster threshold analysis with an effect size (η2) of at least 0.2.
3.2.2. Sleep-deprived condition
Cluster threshold adjusted t-test maps revealed several sites in which responders’ perfusion decreased from baseline to PSD conditions. Most clusters were found in the following areas: ventral AC/medial frontal gyrus (mostly left) including portions of BAs 24 and 32 as well as a large distinct cluster in left BA 10 near the frontal pole; left rostral AC (BA 32); left dorsal cingulate (extending posteriorly into BAs 23 and 31); and bilateral temporal areas. Temporal lobe sites were primarily in superior and insular areas (see Fig. 3).
Fig. 3.
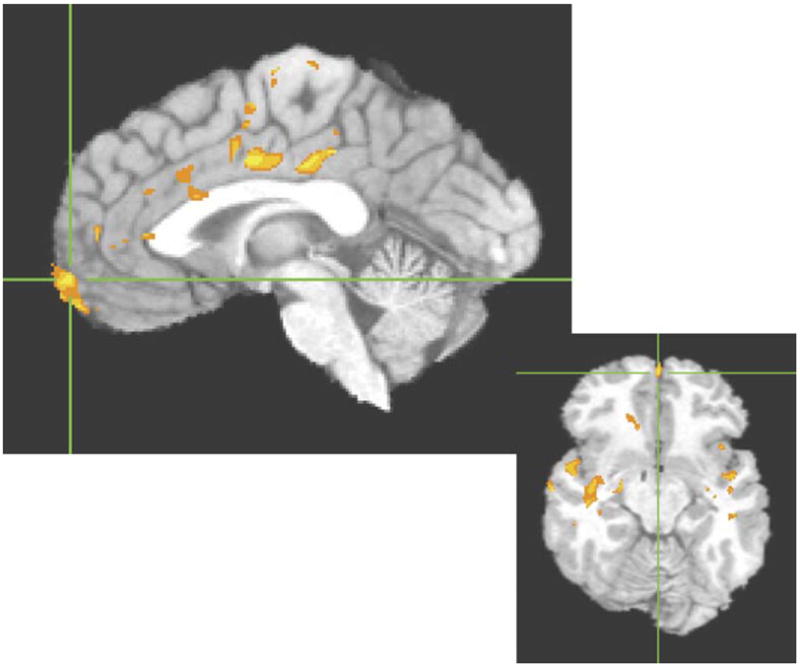
Areas in which responders’ perfusion significantly decreased from baseline to sleep-deprived scans. Color areas survived cluster threshold analysis with an effect size (η2) of at least 0.5.
4. Discussion
Our most important findings included increased baseline LVAC perfusion in responders, decreased LVAC and RDAC perfusion with PSD in the responder group, and a significant correlation between decrease in LVAC perfusion and decrease in HDRS17Mod with PSD in the patient group as a whole. These findings are consistent with previous PET and SPECT data reporting altered cerebral blood flow (CBF) or glucose metabolism in medial prefrontal areas. However, by a priori dividing AC and adjacent medial frontal cortex into a total of 12 ROIs bilaterally and testing each of these ROIs, we were able to demonstrate that these findings were most prominent in the LVAC and RDAC.
Most of our LVAC ROI consisted of subgenual and subcallosal cortex. Thus, our findings were more anatomically specific than those of previous PET and SPECT studies of the antidepressant response to SD. Based on Talairach coordinates, many of the clusters of significant voxelwise perfusion differences between groups (baseline responders vs. nonresponders) and within groups (responders at baseline vs. PSD) were located within our LVAC ROI as well. Because of the relatively small subject numbers, particularly for responders, we examined Tukey’s box plots (Tukey, 1977) of all ROI variables to verify that between-and within-group analyses were not spurious results caused by statistical outliers. Wu et al. (1999) reported that increased baseline relative glucose metabolism in responders extended from BA 25 forward into BA 24 and BA 32. Their area of decreased activity in responders with SD was in BAs 10 and 32, anterior to our ROI findings (Wu et al., 1999).
While our ROI analyses did not reveal significant findings in ventral medial frontal cortex, voxelwise analysis revealed clusters in left BAs 24 and 32 in which responders showed increased baseline perfusion (compared with nonresponders) as well as loci in left BAs 10 and 32 in which responders’ perfusion decreased with SD. Like the findings of Wu et al. (1999), we also found areas of overlap between baseline differences (between responders and nonresponders) and differences between baseline and SD in responders.
Exact reasons for modest differences in the location of the findings of Wu et al. (1999) and ours are not completely clear. However, in their study, PET data were superimposed on two slices of atlas-based templates (Matsui and Hirano, 1987; Talairach and Tournoux, 1988). Although they utilized statistical probability mapping and BA’s drawn by an expert neuroanatomist based on similar structural MRI scans, individual subjects’ structural MRI data were not available for coregistration. In addition, the superior spatial resolution of fMRI resulted in smaller voxels–and clusters–in our data set. The larger clusters of Wu et al. (1999) may well encompass several of our smaller clusters and “connect” them together.
Greater baseline perfusion in responders (compared with nonresponders) in LVAC is consistent with initial elevated activity in Mayberg’s ventral compartment. The responder group’s decrease in perfusion with PSD is also consistent with “normalization” of ventral compartment function in other studies, and predicted by Mayberg’s model (Mayberg et al., 1999). RDAC perfusion change was also associated with treatment response, although in the direction opposite of Mayberg’s theory. In our sample, baseline perfusion in the RDAC was not depressed, as predicted by the Mayberg model, and was reduced, rather than increased by successful treatment. The strong convergence between our findings in the ventral AC ROI and those of other treatment studies of depression supports the conclusion that baseline resting measurements of brain metabolism or perfusion in the LVAC is a consistent imaging treatment marker of antidepressant response.
Our exploratory voxelwise analyses revealed several other brain regions that appeared to be related to treatment response. These included clusters in left medial BA 10 near the frontal pole; left rostral AC (BA 32); left dorsal cingulate (extending posteriorly into BAs 23 and 31); and bilateral temporal areas, including insular areas. Most of these regions overlapped with our ROIs, yet either spanned parts of two ROIs or were small relative to the ROI so that averaging washed out their effect. Additional research will be required to confirm that these areas are consistent treatment markers of PSD response. Our clusters of significant between-and within-group differences in and near both temporal lobes are interesting in light of previous PET and SPECT findings. Greater baseline left superior temporal cortex metabolism in responders than nonresponders, and decreased right insular metabolism with TSD specific to the responder group (Wu et al., 1999) are consistent with our fMRI findings. Another group found greater baseline bilateral temporal CBF in responders than nonresponders, with responders uniquely showing decreased bilateral temporal CBF with TSD. However, their sites of altered CBF were located more inferiorly in the temporal lobes than our findings (Ebert et al., 1991). Most previous imaging studies of the antidepressant response to SD involved template-based ROIs or manually placed rectangular ROIs in predefined levels axially (Ebert et al., 1991; Volk et al., 1992; Kaendler et al., 1993). Thus, their ROIs might not have directly reflected activity in superior aspects of the temporal lobes. In any case, our fMRI findings, as well as previous PET and SPECT results, suggest that further investigation in the temporal areas may prove informative in subsequent studies.
The “overarousal” hypothesis of SD postulates that depression is associated with a pathological increase in some aspects of physiologic arousal and that SD works by “de-arousing” depressed patients, or at least those who respond clinically (Gillin et al., 1995). Evidence supporting the overarousal hypothesis includes behavioral (Szuba et al., 1991; Van Den Burg et al., 1992), neuroendocrine (Roy-Byrne et al., 1984) and polysomnographic (Benca et al., 1992; Benca, 1996) data, including increased nocturnal core temperature in SD responders (Elsenga and van den Hoofdakker, 1988). However, some of the most interesting support for the overarousal hypothesis of SD comes from the imaging literature. Elevated baseline limbic activity in depressed patients and decreased limbic activity in association with SD (Ebert et al., 1991; Wu et al., 1992), PSD (Clark et al., 2006), or other antidepressant treatments (Scott et al., 1994; Buchsbaum et al., 1997) also are consistent with the overarousal hypothesis in the sense that increased blood flow, perfusion, or metabolism reflect increased local brain activity.
In conclusion, our fMRI results have expanded on previous PET and SPECT studies of the antidepressant effects of SD in depression by providing improved localization of functional alterations in the medial frontal cortical area. Our findings of increased baseline LVAC perfusion in responders (vs. nonresponders) and decreased LVAC perfusion with PSD in the responder group also provide further support for the overarousal hypothesis of depression.
Acknowledgments
The research reported was supported by 5 K08 MH01642, M01RR00827, and the VISN 22 Mental Illness, Research, Education and Clinical Center, and by a Veterans’ Administration Merit Review Award.
We thank Lesley Wetherell, Anna Demodena, and Dexter Walpole for their help in conducting this study.
References
- Benca RM. Sleep in psychiatric disorders. Neurologic Clinics. 1996;14:739–764. doi: 10.1016/s0733-8619(05)70283-8. [DOI] [PubMed] [Google Scholar]
- Benca RM, Obermeyer WH, Thisted RA, Gillin JC. Sleep and psychiatric disorders: a meta-analysis. Archives of General Psychiatry. 1992;49:651–668. doi: 10.1001/archpsyc.1992.01820080059010. [DOI] [PubMed] [Google Scholar]
- Bondi MW, Houston WS, Eyler LT, Brown GG. FMRI evidence of compensatory mechanisms in older adults at genetic risk for Alzheimer’s disease. Neurology. 2005;64:501–508. doi: 10.1212/01.WNL.0000150885.00929.7E. [DOI] [PMC free article] [PubMed] [Google Scholar]
- Buchsbaum MS, Wu JC, Siegel BW, Hackett E, Trenary M, Abel L, Reynolds C. Effect of sertraline on regional metabolic rate in patients with affective disorders. Biological Psychiatry. 1997;41:15–22. doi: 10.1016/s0006-3223(96)00097-2. [DOI] [PubMed] [Google Scholar]
- Clark CP, Gillin JC, Golshan S, Demodena A, Smith TL, Danowski S, Irwin M, Schuckit M. Polysomnography and depressive symptoms in primary alcoholics with and without a lifetime diagnosis of secondary depression and in patients with primary major depression. Journal of Affective Disorders. 1999;52:177–185. doi: 10.1016/s0165-0327(98)00078-0. [DOI] [PubMed] [Google Scholar]
- Clark CP, Frank LR, Brown GG. Sleep deprivation, EEG, and functional MRI in depression: preliminary results. Neuropsychopharmacology. 2001;25:S79–S84. doi: 10.1016/S0893-133X(01)00324-4. [DOI] [PubMed] [Google Scholar]
- Clark CP, Brown GG, Archibald SL, Fennema-Notestine C, Braun DR, Thomas LS, Sutherland AN, Gillin JC. Does amygdalar perfusion correlate with antidepressant response to partial sleep deprivation in major depression? Psychiatry Research: Neuroimaging. 2006;146:43–51. doi: 10.1016/j.pscychresns.2005.09.007. [DOI] [PMC free article] [PubMed] [Google Scholar]
- Cox R. AFNI: software for analysis and visualization of functional magnetic resonance neuroimages. Computers and Biomedical Research. 1996;29:162–173. doi: 10.1006/cbmr.1996.0014. [DOI] [PubMed] [Google Scholar]
- Dale AM, Fischl B, Sereno MI. Cortical surface-based analysis: I. Segmentation and surface reconstruction. Neuroimage. 1999;9:179–194. doi: 10.1006/nimg.1998.0395. [DOI] [PubMed] [Google Scholar]
- Ebert D, Feistel H, Barocka A. Effects of sleep deprivation on the limbic system and the frontal lobes in affective disorders: a study with Tc-99m-HMPAO SPECT. Psychiatry Research: Neuroimaging. 1991;40:247–251. doi: 10.1016/0925-4927(91)90016-j. [DOI] [PubMed] [Google Scholar]
- Ebert D, Feistel H, Barocka A, Kaschka W. Increased limbic blood flow and total sleep deprivation in major depression with melancholia. Psychiatry Research: Neuroimaging. 1994;55:101–109. doi: 10.1016/0925-4927(94)90004-3. [DOI] [PubMed] [Google Scholar]
- Elsenga S, van den Hoofdakker R. Body core temperature and depression during total sleep deprivation in depressives. Biological Psychiatry. 1988;24:531–540. doi: 10.1016/0006-3223(88)90164-3. [DOI] [PubMed] [Google Scholar]
- Fennema-Notestine C, Ozyurt IB, Clark CP, Morris S, Bischoff-Grethe A, Bondi MW, Jernigan TL, Fischl B, Segonne F, Shattuck DW, Leahy RM, Rex DE, Toga AW, Zou KH, Brown GG. Quantitative evaluation of automated skull-stripping methods applied to contemporary and legacy images: effects of diagnosis, bias correction, and slice location. Human Brain Mapping. 2006;27:99–113. doi: 10.1002/hbm.20161. [DOI] [PMC free article] [PubMed] [Google Scholar]
- First MB, Spitzer RL, Williams JBW. Structured Clinical Interview for DSM-IVAxis I Disorders—Patient Edition (SCID-I/P, Version 2.0) Biometrics Research Department, New York State Psychiatric Institute; New York, NY: 1996. [Google Scholar]
- Forman SD, Cohen JD, Fitzgerald M, Eddy WF, Mintun MA, Noll DC. Improved assessment of significant activation in functional magnetic resonance imaging (fMRI): use of cluster-size threshold. Magnetic Resonance in Medicine. 1995;33:636–647. doi: 10.1002/mrm.1910330508. [DOI] [PubMed] [Google Scholar]
- Friston KJ, Jezzard P, Turner R. Analysis of fMRI time-series. Human Brain Mapping. 1994;1:153–171. [Google Scholar]
- Gillin JC, Ho AP, Buchsbaum MS, Wu J, Abel L, Bunney WE., Jr Functional brain imaging, sleep, and sleep deprivation: contributions to the “overarousal” hypothesis of depression. Acta Neuropsychiatrica. 1995;7:33–34. doi: 10.1017/S0924270800037492. [DOI] [PubMed] [Google Scholar]
- Glover GH, Lee AT. Motion artifacts in fMRI: comparison of 2DFT with PR and spiral scan methods. Magnetic Resonance in Medicine. 1995;33:624–635. doi: 10.1002/mrm.1910330507. [DOI] [PubMed] [Google Scholar]
- Hahn H, Peitgen HO. The skull stripping problem in MRI solved by a single 3D watershed transform. Proceedings of the MICCAI, LNCS. 2000;1935:134–143. [Google Scholar]
- Kaendler SH, Volk S, Maul FD, Weber R, Georgi K, Hertel A, Pflug B, Hor G. Evaluation of total sleep deprivation by single photon emission computerized tomography. In: Maurer K, editor. Imaging of the Brain in Psychiatry and Related Fields. Springer-Verlag; Berlin: 1993. pp. 115–120. [Google Scholar]
- Lancaster JL, Woldorff MG, Parsons LM, Liotti M, Freitas CS, Rainey L, Kochunov PV, Nickerson D, Mikiten SA, Fox PT. Automated Talairach atlas labels for functional brain mapping. Human Brain Mapping. 2000;10:120–131. doi: 10.1002/1097-0193(200007)10:3<120::AID-HBM30>3.0.CO;2-8. [DOI] [PMC free article] [PubMed] [Google Scholar]
- Li T-Q, Takahashi A, Moseley ME, Glover GH. A single-shot dual-echo spiral FAIR sequence for simultaneous measurements of CBF and oxygenation in fMRI. Paper Presented at the International Society for Magnetic Resonance in Medicine; 1999. [Google Scholar]
- Matsui T, Hirano A. An Atlas of the Human Brain for Computerized Tomography. Igaku-Shoin; Tokyo: 1987. [Google Scholar]
- Mayberg HS, Brannan SK, Mahurin RK, Jerabek PA, Brickman JS, Tekell JL, Silva A, McGinnis S, Glass TG, Martin CC, Fox PT. Cingulate function in depression: a potential predictor of treatment response. NeuroReport. 1997;8:1057–1061. doi: 10.1097/00001756-199703030-00048. [DOI] [PubMed] [Google Scholar]
- Mayberg HS, Liotti M, Brannan SK, McGinnis S, Mahurin RK, Jerabek PA, Silva JA, Tekell JL, Martin CC, Lancaster J, Fox PT. Reciprocal limbic–cortical function and negative mood: converging PET findings in depression and normal sadness. American Journal of Psychiatry. 1999;156:675–682. doi: 10.1176/ajp.156.5.675. [DOI] [PubMed] [Google Scholar]
- Roy-Byrne PG, Uhde TW, Post RM. Antidepressant effects of one night’s sleep deprivation: clinical and theoretical implications. In: Post RM, Ballenger J, editors. Neurobiology of Mood Disorders. William and Wilkins; Baltimore: 1984. pp. 817–835. [Google Scholar]
- Scott AIF, Dougall N, Ross M, O’Carroll RE, Riddle W, Ebmeier KP, Goodwin GM. Short-term effects of electroconvulsive treatment on the uptake of 99mTc-exametazime into brain in major depression shown with single photon emission tomography. Journal of Affective Disorders. 1994;30:27–34. doi: 10.1016/0165-0327(94)90148-1. [DOI] [PubMed] [Google Scholar]
- Segonne F, Dale AM, Busa E, Glessner M, Salat D, Hahn HK, Fischl B. A hybrid approach to the skull stripping problem in MRI. Neuroimage. 2004;22:1060–1075. doi: 10.1016/j.neuroimage.2004.03.032. [DOI] [PubMed] [Google Scholar]
- Sled JG, Zijdenbos AP, Evans AC. A nonparametric method for automatic correction of intensity nonuniformity in MRI data. IEEE Transactions on Medical Imaging. 1998;17:87–97. doi: 10.1109/42.668698. [DOI] [PubMed] [Google Scholar]
- Smith GS, Reynolds CF, III, Pollock B, Derbyshire S, Nofzinger E, Dew MA, Houck PR, Milko D, Meltzer CC, Kupfer DJ. Cerebral glucose metabolic response to combined total sleep deprivation and antidepressant treatment in geriatric depression. American Journal of Psychiatry. 1999;156:683–689. doi: 10.1176/ajp.156.5.683. [DOI] [PubMed] [Google Scholar]
- Smith GS, Reynolds CF, III, Houck PR, Dew MA, Ma Y, Mulsant BH, Pollock BG. Glucose metabolic response to total sleep deprivation, recovery sleep, and acute antidepressant treatment as functional neuroanatomic correlates of treatment outcome in geriatric depression. American Journal of Geriatric Psychiatry. 2002;10:561–567. [PubMed] [Google Scholar]
- Szuba MP, Baxter LR, Jr, Fairbanks LA, Guze BH, Schwartz JM. Effects of partial sleep deprivation on the diurnal variation of mood and motor activity in major depression. Biological Psychiatry. 1991;30:817–829. doi: 10.1016/0006-3223(91)90237-g. [DOI] [PubMed] [Google Scholar]
- Talairach J, Tournoux P. Co-Planar Stereotaxic Atlas of the Human Brain. Thieme Medical Publishers; New York: 1988. [Google Scholar]
- Tukey JW. Exploratory Data Analysis. Addison-Wesley; Reading, MA: 1977. [Google Scholar]
- Van Den Burg W, Beersma DGM, Bouhuys AL, Van Den Hoofdakker RH. Self-rated arousal concurrent with the antidepressant response to total sleep deprivation of patients with a major depressive disorder: a disinhibition hypothesis. Journal of Sleep Research. 1992;1:211–222. doi: 10.1111/j.1365-2869.1992.tb00042.x. [DOI] [PubMed] [Google Scholar]
- Volk S, Kaendler SH, Weber R, Georgi K, Maul F, Hertel A, Pflug B, Hoer G. Evaluation of the effects of total sleep deprivation on cerebral blood flow using single photon emission computerized tomography. Acta Psychiatrica Scandinavica. 1992;86:478–483. doi: 10.1111/j.1600-0447.1992.tb03301.x. [DOI] [PubMed] [Google Scholar]
- Wong EC, Buxton RB, Frank LR. Implementation of quantitative perfusion imaging techniques for functional brain mapping using pulsed arterial spin labeling. NMR in Biomedicine. 1997;10:237–249. doi: 10.1002/(sici)1099-1492(199706/08)10:4/5<237::aid-nbm475>3.0.co;2-x. [DOI] [PubMed] [Google Scholar]
- Wong EC, Buxton RB, Frank LR. Quantitative imaging of perfusion using a single subtraction (QUIPSS and QUIPSS II) Magnetic Resonance in Medicine. 1998;39:702–708. doi: 10.1002/mrm.1910390506. [DOI] [PubMed] [Google Scholar]
- Wu JC, Bunney WE., Jr The biological basis of an antidepressant response to sleep deprivation and relapse: review and hypothesis. American Journal of Psychiatry. 1990;147:14–21. doi: 10.1176/ajp.147.1.14. [DOI] [PubMed] [Google Scholar]
- Wu JC, Gillin JC, Buchsbaum MS, Hershey T, Johnson JC, Bunney WE., Jr Effect of sleep deprivation on brain metabolism of depressed patients. American Journal of Psychiatry. 1992;149:538–543. doi: 10.1176/ajp.149.4.538. [DOI] [PubMed] [Google Scholar]
- Wu J, Buchsbaum MS, Gillin JC, Tang C, Cadwell S, Keator D, Fallon JH, Wiegand M, Najafi A, Klein E, Hazen K, Bunney WE., Jr Prediction of antidepressant effects of sleep deprivation by metabolic rates in the ventral anterior cingulate and medial prefrontal cortex. American Journal of Psychiatry. 1999;156:1149–1158. doi: 10.1176/ajp.156.8.1149. [DOI] [PubMed] [Google Scholar]