

Abstract
Alzheimer’s disease (AD) is the most common form of dementia in the elderly. Classic symptoms of the disease include memory loss and confusion associated with the hallmark neuro-pathologic lesions of neurofibrillary tangles (NFT) and senile plaques (SP) and their sequelae, gray matter atrophy. Volumetric assessment methods measure tissue atrophy, which typically follows early biochemical changes. An alternate MRI contrast mechanism to visualize the early pathological changes is T1ρ (or “T-1-rho”), the spin lattice relaxation time constant in the rotating frame, which determines the decay of the transverse magnetization in the presence of a “spin-lock” radio-frequency field. Macromolecular changes (in plaques and tangles) that accompany early AD are expected to alter bulk water T1ρ relaxation times. In this work, we measure T1ρ MRI on patients with clinically diagnosed AD, MCI and in age-matched ognitively normal control subjects in order to compare T1ρ values with changes in brain volume in the same regions of the brain and demonstrate that T1ρ can potentially constitute an important biomarker of AD.
Keywords: T1rho, spin-lock imaging, Alzheimer’s Disease
1. Introduction
Alzheimer’s Disease (AD) is the most common form of dementia in the elderly (Dawbarn and Allen 2001). Classic symptoms of the disease include memory loss, confusion and biological features such as the formation of neurofibrillary tangles (NFT), senile plaques (SP) of amyloid-β protein and gray matter atrophy in the brain (Selkoe 1999; Lee et al. 2001; Uryu et al. 2002). As early diagnosis (10 years before the onset of neurological symptoms) could provide a more positive outcome and as specific drug therapies are developed, there is an increasing demand for an early and non-invasive diagnosis of AD.
Development of quantitative non-invasive imaging methods of diagnosing AD have resulted in MRI-based methods that rely on contrast generated by the variation of T1 and T2 relaxation times of water in tissue. The formation of NFT, SP, resulting cellular loss, and decreased gray matter are expected to change the biochemical environment of the affected brain region. There are situations where structural deformities may not be evident but other clinical diagnoses indicate the impairment of normal brain function. In such cases PET and fMRI techniques provide an alternate method of diagnosis. PET imaging uses radioactive tracers to measure glucose metabolism or blood flow. This technique suffers from poor resolution and wide-scale clinical applicability is hampered by the fact that the imaging center must possess a cyclotron that can produce radioactive tracers. Functional MRI permits the imaging of brain function, without the use of ionizing radiation while the patient is made to perform a cognitive task (Gonzalez et al. 1995; Moseley et al. 1996). But functional imaging has not been able to distinguish between AD and other dementias and has not been established as a diagnostic method for AD.
However, applications of these MRI techniques towards diagnosing AD in its early stages have not yielded conclusive results since clinical MRI resolution (>300μm pixel size) is inadequate to observe the actual plaques and NFT. For this reason, volumetric assessment methods are used in current state-of-the-art MRI of AD. Yet even these methods only measure tissue atrophy, subsequent to early biochemical changes.
Detecting atrophy in the early stages of any degenerative process would help distinguish patterns of atrophy and facilitate differential diagnosis. Regions of interest in the brain include substructures of the medial temporal lobe such as the hippocampus, amygdala and entorhinal cortex (Jack et al. 1999; De Santi et al. 2001; Hampel et al. 2002; Chetelat and Baron 2003; de Leon et al. 2006). Early AD is associated with neuronal loss and consequent changes in gray matter, which eventually leads to the atrophy of cortical gyri and widening of sulci. Structural imaging of the brain by MRI helps to differentiate tissue types, identify structural lesions and visualize spatial patterns of atrophy. The quantitative measurement of structural changes is sub-divided into linear, 2D cross-sectional or 3D volumetric analyses, each with its own advantages and shortcomings. With speed and simplicity, linear measurements of inter-object distances in the brain are able to differentiate between normal and AD-affected patients but with significant overlap between normal controls and mild AD-affected individuals (DeCarli et al. 1990). Morphological changes monitored in 2D cross-sections lack the full potential of volumetric analyses but are generally less time-consuming (Cook et al. 1992). The volume of CSF, gray matter (GM), and white matter (WM) change with the progression of AD (Sullivan et al. 1993; Convit et al. 1997; Thompson et al. 2007). But small and especially focal changes (1–2% decrease in volume) may not be detectable with enough sensitivity to distinguish between normal age-related volume decrease and AD-related changes. Furthermore, volumetric methods require correction for potential brain-size variations present before the onset of AD (Pfefferbaum et al. 1994). Although very high-resolution MRI (<100μm) has been used to image plaque formations in tissue specimens (Benveniste et al. 1999) and in mice in vivo (McDaniel et al. 2001), the required sub-micron resolution of this technique is not attainable on clinical MRI scanners.
MRI provides exquisite soft-tissue contrast provided by the T1 and T2 relaxation mechanisms in the different tissues in the brain. For example, tissues with highly mobile water e.g. CSF appear bright in T2-weighted MR images, whereas brain parenchyma is highlighted in T1-weighted images. Recent studies have shown that in vivo relaxometric measurements of T2 differ by ~3ms between transgenic (tg) mice and age-matched controls (Helpern et al. 2004). However, Campeau et al demonstrated that hippocampal T2 was not significantly different between Alzheimer’s disease patients and normal subjects (9). An alternate contrast mechanism is T1ρ, or “T-1-rho”, the spin lattice relaxation time constant in the rotating frame, which determines the decay of the transverse magnetization in the presence of a “spin-lock” radio-frequency field. T1ρ MRI has previously been used to measure T1ρ relaxation times in normal brains in vivo (Borthakur et al. 2004). The T1ρ relaxation time constant is influenced by molecular processes that occur in the millisecond range, such as chemical exchange of protons between water associated with macromolecules and free water. In biological tissues, T1ρ is dependent on the macromolecular composition and provides contrast unlike conventional T1/T2-based methods. Further, T1ρ displays a greater range of values compared to T2 in the human brain (Borthakur et al. 2004). T1ρ contrast has also shown promise in delineating tumors (Markkola et al. 1998), gliomas (Aronen et al. 1999), and other cancerous tissue (Santyr 1994; Dixon et al. 1996). Recent work by our group has demonstrated the feasibility of measuring plaque burden in the APP/PS1 transgenic mouse model of AD (Borthakur et al. 2006a).
Quantitative T1ρ MRI is, therefore, an attractive proposition for the diagnosis of neuro-degenerative diseases such as AD at clinically-feasible MRI resolution. In this study, we provide valuable baseline values of T1ρ in the brains of normal, MCI and AD-affected patients and determine whether there are any significant differences between these cohorts. These measurements were performed in the medial temporal lobe region of the brain that is primarily associated with AD pathology (DeCarli et al. 1990; Sandor et al. 1992; Jack et al. 2004).
2. Methods
2.1. Preparing for MRI
The Institutional Review Board of the University of Pennsylvania approved all experiments as part of a large ongoing study that will examine 350 AD and MCI patients and controls over the next 2 years. For the results presented here, MRI was performed on only 14 AD patients (mean age 79±2) classified as AD, 11 MCI patients (mean age: 76±2), and 16 elderly controls (mean age: 78±2) on a Siemens Sonata 1.5 Tesla clinical scanner with the vendor-supplied head coil. AD and MCI patients were diagnosed initially by a neurologist (C.M.C.) as such based on their psychiatric history and standard MMSE cognitive testing.
2.2. Estimation of T1ρ in the brain
An oblique coronal T1ρ-weighted image of a slice perpendicular to the AC/PC plane was obtained. This slice was chosen to include the head of the hippocampus. An inversion pulse-prepared (fluid-attenuated) T1ρ pre-encoded Turbo Spin-Echo (TSE) pulse sequence (Borthakur et al. 2004) was used to acquire all images. Imaging parameters were: TE/TR= 12/2000ms, TSL (duration of spin-lock pulse)= 20, 40, 60 and 80ms, slice thickness=2mm, FOV=22cm, Matrix size= 256 × 128, andwidth=130Hz/pixel, echo train length=4 for a total imaging time of 6 minutes for four images. The time of inversion (TI) was fixed at 860ms to remove the contribution from CSF to the T1ρ maps, especially in the AD patients that tend to display large sulcal and ventricular CSF. In the initial evaluation of the fluid-attenuated T1ρ MRI protocol, we also obtained T1ρ images and maps from a non-fluid-attenuated T1ρ MRI pulse sequence protocol with identical imaging parameters but without the inversion pulse. Each image pixel’s signal intensity was fitted as a function of TSL by a linear least-squares algorithm to generate T1ρ maps. In the fitting routine, pixels whose intensities correlated poorly (i.e. R2< 0.95) with the equation were set to zero. Pixels outside the brain were also set to zero in the T1ρ color maps. Reproducibility of T1ρ mapping in the human brain was previously measured as coefficients of variation of <2% in the brains of healthy controls (Borthakur et al. 2004) and in AD patients (Borthakur et al. 2006b).
The images were transferred to a G4 PowerBook computer (Apple Corp., Cupertino, CA) and images were processed in custom-written software in the IDL programming language (RSI Corp., Boulder, CO). T1ρ values were automatically reported from the GM and WM in the temporal lobes by an algorithm shown in a flow chart in Figure 1. Briefly, T1ρ MRI of the same slice of the brain are acquired at four different SL times and employed to generate a T1ρ relaxation time map. Each pixel on the map represents actual T1ρ values (in milliseconds) for that pixel. These maps are typically color-coded for display. GM and WM segmented masks were obtained by segmentation (details in the next paragraph), and an example is shown in the image in the left of center. A program written in IDL was used to automatically record T1ρ values from only pixels that were classified as GM or WM located in either the left or right medial temporal lobe (MTL) region of the brain. The four regions of interest (ROI) are shown in the bottom of the Figure 1.
Figure 1.
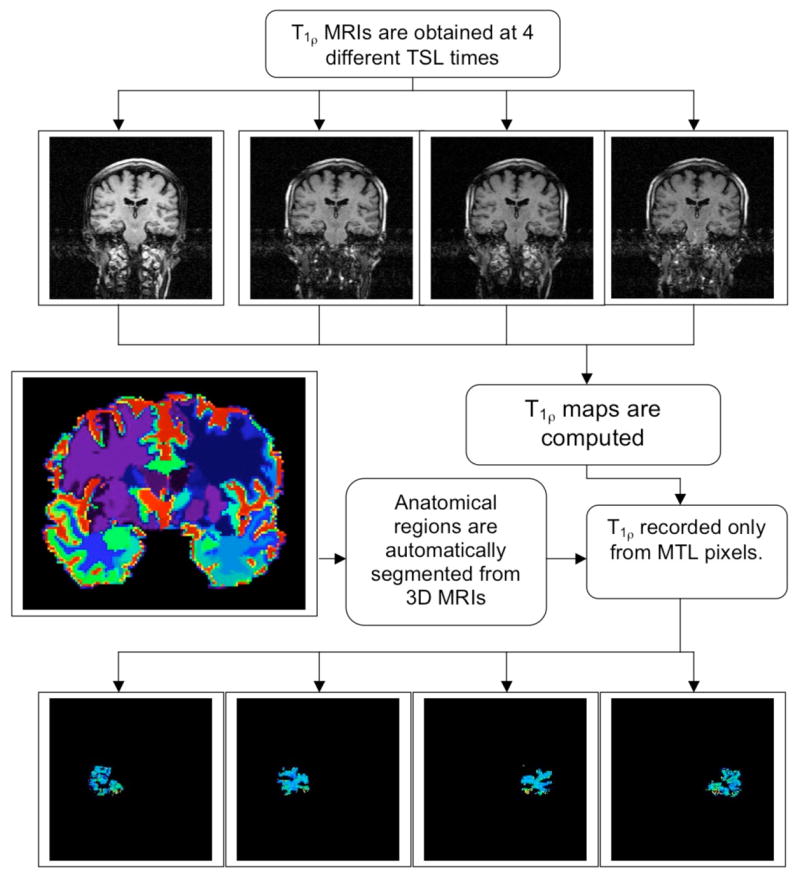
A flow-chart of automated T1ρ data reporting method. T1ρ maps are computed for the entire brain from 4 TSL time images. Atrophy in the brain is determined by using high-dimensional deformable registration methods developed by collaborator Davatzikos (Shen and Davatzikos 2002). 3D MRI scans of different brains are deformed into a standardized template to generate anatomical maps (a typical slice from a 3D data set is shown in color on the left). Once labeled, these are reformed into the original brain shape. Atrophy rates can then be measured from two time points using these deformation maps (Davatzikos et al. 2001). The labeled template can also be used to report T1ρ values from any region of the brain. As an example, GM and WM pixels from left and right medial temporal lobes are shown as four segmented images at the bottom of the figure.
2.3. Image segmentation
Immediately following T1ρ MRI, the entire volume of each subject’s brain was imaged in the coronal plane using a T1ρ-weighted 3D volumetric MPRAGE MRI sequence with 124 continuous slices, 1.2mm slice thickness, a FOV of 24cm and 192 phase-encode steps, and flip angle=8°. TE/TR=3.5ms/3000ms for a total imaging time ~10 minutes. A previously developed and validated (Davatzikos et al. 2006) method (HAMMER) based on a high-dimensional elastic warping of a digital atlas of the human brain (Kabani et al. 2001; Mazziotta et al. 2001) was used to partition an individual’s volumetric MRI brain scan into 92 ROIs incorporating all major cortical and sub-cortical structures. These methods deform MRI scans of different brains into anatomical co-registration with each other, and into co-registration with a standardized template. The template’s labels are then transferred to the individual scans by applying the elastic transformation that was found to co-register the respective images.
Using this approach, 4 ROIs were defined onto the T1ρ images: left and right temporal lobe WM and GM and automatically report T1ρ values from each region. It is also possible to compare rates of atrophy to T1ρ values in these subjects, however, that analysis is beyond the scope of the work described here.
2.4. Statistical analyses
Average T1ρ from both right and left MTL for GM and WM were separately recorded for each subject and recorded in an Excel spreadsheet (Microsoft Corp., Redmond, WA). An analysis of variance (ANOVA) using the JMP statistical package (SAS Inc., Cary, NC) was performed to determine any significant differences between the values obtained in the three volunteer cohorts. The mean and standard error of the average T1ρ values were also determined for both GM and WM in the MTL.
3. Results
Typical T1ρ images of the brain of a healthy adult with and without fluid-attenuation are shown for comparison (Figure 2). Note the decreased signal from the sulci and ventricles in image B. Fluid-attenuated T1ρ MRI reduces the likelihood that any elevation in T1ρ relaxation time is due to increased CSF. T1ρ maps from a subset of the test population (Figure 3) demonstrate a range of T1ρ values in the brains of AD patients, which are typically greater than the controls, as indicated magenta colored pixels. Some AD subjects are also characterized by abnormally large sulcal space (arrows on T1ρ maps of the 77 year-old male and 82 year-old female AD patients). This would suggest that integrating regional atrophy patterns and T1ρ would be a stronger classifier of subjects in to the AD – MCI – controls cohorts. The other AD patients, however, do not necessarily exhibit larger sulcal space but do still possess elevated T1ρ. This would indicate early biochemical changes in tissue composition that have not yet manifested in decreased brain volume.
Figure 2.

Conventional T1ρ (figure A) and fluid–attenuated T1ρ (figure B) images from the AD patient’s brain data are shown. Note the lack of signal from the CSF in the ventricles in figure B. As expected, the SNR of surrounding brain parenchyma was slightly lower in figure B than in A.
Figure 3.

T1ρ maps obtained in the brains of a control and 5 AD patients that were categorized by neurological tests. Color bar on the right ranges from 10ms to 200ms with red and magenta colors indicating higher T1ρ values. Pixels with higher T1ρ are more prominent in AD patients especially in the medial temporal lobe region as indicated by the circle on the 57 year-old AD patient. Also noted was increased sulcal space in AD subjects, especially in the older patients (dashed arrows), suggesting greater brain atrophy.
Average T1ρ for GM and WM is listed in Table 1. A statistically significant (p<0.01) increase in both the GM and WM in the MTL is seen in AD patients over age-matched controls. However, AD and MCI cohorts only displayed significant difference (p<0.01) in WM. There was no significance in the difference in T1ρ between control and MCI cohorts. A possible reason could be the fact that the MCI cohort displays a bi-modal distribution (Figure 4) with one group having increased T1ρ values in both ROIs while the other group shows no significant increase. While increased T1ρ in GM could indicate AD-related pathology, WM hyper-intensities have been previously reported in T2-weighted MRI of AD patients (Jefferson et al. 2007). One control patient showed significantly increased T1ρ in both GM and WM. This study will follow these patients for the next 3 years with the further goal of correlating these early T1ρ increases with cognitively normal and MCI patients who develop AD. It is possible that normal aging process may alter relative volume fractions of water and protein in brain tissue and this will be reflected as changes in T1ρ relaxation time. Therefore, we investigated whether T1ρ displays any trend with age. Figure 5, however, dispels any such expectations, as we did not observe any trend in T1ρ in both GM and WM with age in all subjects. This would suggest that the discrimination of the cohorts based on T1ρ is due to an underlying pathology related to AD other than normal age-related changes in the brain.
Table 1.
Mean T1ρ (ms) ± standard error of average T1ρ values in all three subject cohorts.
| Diagnosis | N | WM T1ρ* mean±std.err. (ms) | GM T1ρ** mean±std.err. (ms) |
|---|---|---|---|
| AD | 14 | 89.7±1.4 | 90.4±1.1 |
| Control | 16 | 82.8±1.3 | 86.4±1.1 |
| MCI | 11 | 84.7±1.6 | 87.6±1.3 |
indicates significant difference (p<0.01) between AD-MCI and AD-control cohorts.
indicates significant difference (p<0.01) between AD and control cohorts only. There was no significant difference between MCI-control cohorts for either tissue type.
Figure 4.

Average (±std. error, indicated as blue bars) of T1ρ in the AD, control, and MCI cohorts in WM (A) and GM (B) of the MTL. An 8% increase in T1ρ was present in AD over control in the WM (p<0.01), while only a 5% increase in T1ρ (p<0.05) was observed in GM. The MCI cohort’s average T1ρ values were between the AD and control cohorts. Also displayed are the 95% confidence limits (top and bottom apex of each diamond) and 95% overlap marks (horizontal lines within each diamond).
Figure 5.
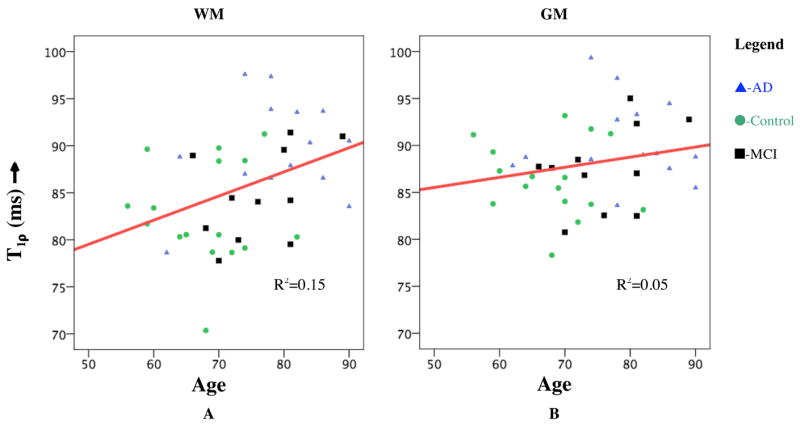
Plot of T1ρ in GM (A) and WM (B) with age of the subject. No significant correlation was observed in either tissue type (R2=0.15 and 0.04, respectively) with age.
4. Discussion
Evaluation of potential new therapies and longitudinal monitoring of disease progression requires objective and quantitative imaging strategies sensitive to early biochemical changes in brain tissue. The results presented here show that T1ρ MRI is increased by 6% in the AD cohort compared to controls. Both the normal controls and the MCI individuals displayed a somewhat bimodal distribution in the WM T1ρ signal (albeit the sample size if to small to draw any conclusions). Follow-up studies will allows one to examine whether the normal and MCI individuals with high values are the ones that progress to AD or not. However, there is ample evidence in the literature to suggest that a significant number of cognitive normal elderly, and the majority of MCI individuals, have quite pronounced AD pathology. Recently developed high-dimensional pattern classification methods (Davatzikos et al. 2006) have also shown that distinctive patterns of atrophy are present in those groups. Therefore, it is possible that the individuals with AD-like T1ρ levels do actually have significant amounts of plaques and tangles. Histo-pathological validation is beyond the scope of the present study.
Although there is abundant literature on studies of T1 and T2 relaxation times in biological systems, there are relatively few studies on T1ρ mechanisms in biological tissues. In biological tissues, the T1ρ relaxation could have contributions from several MR interactions such as chemical exchange, dipolar interaction, J-coupling, etc. Depending upon the tissue type, more than one mechanism may be operative simultaneously but with different relative contributions. T1ρ experiments have the potential to provide information about the low frequency motions (100 Hz to a few kHz) in biological systems. For example, protons exchanging between free water and those in a “bound” state (due to their proximity to proteins) occur in the timescale of a few milliseconds. These protons would preferentially contribute to T1ρ MR signal when spin-locked at amplitudes of 500Hz. For this reason, it is possible for T1ρ MRI to probe protein content in an indirect manner in tissues such as cartilage, brain and blood.
Implementing this research sequence into a clinical imaging protocol requires a few modifications. For instance, a 3D volumetric coverage of the entire brain has to be provided with high signal and temporal efficiency but without exceeding RF energy deposition limits, measured as SAR. Since T1ρ mapping involves collection of at least four 3D data sets at varying SL times, it is inherently inefficient. To overcome this limitation of the current imaging protocol, we recently incorporated T1ρ imaging with a balanced steady-state free precession (b-SSFP) sequence (Witschey et al. 2008). The performance of this new pulse sequence, named SLIPS, was verified by comparing T1ρ relaxation maps with that of the single-slice T1ρ-TSE sequence used in the current experiments. The average difference in T1ρ was less than 5% in T1ρ maps of the same brain, while the imaging time for a SLIPS-acquired 3D data set of 16 slices was only two minutes, indicating a total imaging time of less than 10 minutes for all four 3D data sets. Integrating SLIPS with parallel imaging techniques using a multi-channel head coil is expected to further reduce imaging time. Additionally, a low SAR version of T1ρ mapping sequence was developed by our group (Wheaton et al. 2004). This method exploits a partial k-space acquisition approach in which a full power spin-lock pulse is applied only to the central phase-encode lines of k-space, while the remaining phase encode lines receive a low-power (50% amplitude of the maximum) spin-lock pulse. Acquisition of high and low power phase-encode lines are interleaved temporally to minimize average power deposition. This strategy ensured that the majority of signal energy in the central portion of k-space was fully T1ρ weighted, while at the same time the overall SAR of the acquisition was lower, and consequently, total imaging time was reduced. It was demonstrated that using this approach in the human brain that SAR could be reduced by 40% while the measurements of T1ρ changed by only 2%. Similarly, a “keyhole” acquisition approach was exploited in reducing the overall imaging time by 40% for T1ρ mapping (Wheaton et al. 2003). These approaches can be combined with any of the acquisition sequences described above to reduce SAR and/or improve temporal resolution.
The long-term goals will be to extend this study in the following directions: longer follow-up and additional treatment modalities (e.g., rehabilitation, novel therapies, etc.), and basic science study of AD pathology.
Acknowledgments
This work was performed at a NIH supported resource center (NIH RR02305) and from a grant from the Pennsylvania State Tobacco Settlement. We thank Professor Ravinder Reddy for his thoughtful comments and funding support.
Footnotes
Disclosure Statement for Authors No conflicts of interest.
Publisher's Disclaimer: This is a PDF file of an unedited manuscript that has been accepted for publication. As a service to our customers we are providing this early version of the manuscript. The manuscript will undergo copyediting, typesetting, and review of the resulting proof before it is published in its final citable form. Please note that during the production process errors may be discovered which could affect the content, and all legal disclaimers that apply to the journal pertain.
References
- Aronen HJ, Ramadan UA, et al. 3D spin-lock imaging of human gliomas. Magn Reson Imaging. 1999;17(7):1001–10. doi: 10.1016/s0730-725x(99)00041-7. [DOI] [PubMed] [Google Scholar]
- Benveniste H, Einstein G, et al. Detection of neuritic plaques in Alzheimer’s disease by magnetic resonance microscopy. Proc Natl Acad Sci U S A. 1999;96(24):14079–84. doi: 10.1073/pnas.96.24.14079. [DOI] [PMC free article] [PubMed] [Google Scholar]
- Borthakur A, Gur T, et al. In vivo Measurement of Plaque Burden in a Mouse Model of Alzheimer’s Disease. J Magn Reson Imaging. 2006a;24(5):1011–1017. doi: 10.1002/jmri.20751. [DOI] [PMC free article] [PubMed] [Google Scholar]
- Borthakur A, Moonis G, et al. Fluid-attenuated T1rho of the Human Brain In Vivo. Proceedings of the International Society of Magnetic Resonance in Medicine, 14th Scientific Meeting; Seattle. 2006b. [Google Scholar]
- Borthakur A, Wheaton AJ, et al. In vivo measurement of T1rho dispersion in the human brain at 1.5 tesla. J Magn Reson Imaging. 2004;19(4):403–9. doi: 10.1002/jmri.20016. [DOI] [PubMed] [Google Scholar]
- Chetelat G, Baron JC. Early diagnosis of Alzheimer’s disease: contribution of structural neuroimaging. Neuroimage. 2003;18(2):525–41. doi: 10.1016/s1053-8119(02)00026-5. [DOI] [PubMed] [Google Scholar]
- Convit A, De Leon MJ, et al. Specific hippocampal volume reductions in individuals at risk for Alzheimer’s disease. Neurobiol Aging. 1997;18(2):131–8. doi: 10.1016/s0197-4580(97)00001-8. [DOI] [PubMed] [Google Scholar]
- Cook MJ, Fish DR, et al. Hippocampal volumetric and morphometric studies in frontal and temporal lobe epilepsy. Brain. 1992;115(Pt 4):1001–15. doi: 10.1093/brain/115.4.1001. [DOI] [PubMed] [Google Scholar]
- Davatzikos C, Fan Y, et al. Detection of prodromal Alzheimer’s disease via pattern classification of MRI. Neurobiol Aging. 2006 doi: 10.1016/j.neurobiolaging.2006.11.010. [DOI] [PMC free article] [PubMed] [Google Scholar]
- Davatzikos C, Genc A, et al. Voxel-Based Morphometry Using the RAVENS Maps: Methods and Validation Using Simulated Longitudinal Atrophy. NeuroImage. 2001;14:1361–1369. doi: 10.1006/nimg.2001.0937. [DOI] [PubMed] [Google Scholar]
- Dawbarn D, Allen SJ. Neurobiology of alzheimer’s disease. New York: Oxford University Press; 2001. [Google Scholar]
- de Leon MJ, DeSanti S, et al. Longitudinal CSF and MRI biomarkers improve the diagnosis of mild cognitive impairment. Neurobiol Aging. 2006;27(3):394–401. doi: 10.1016/j.neurobiolaging.2005.07.003. [DOI] [PubMed] [Google Scholar]
- De Santi S, de Leon MJ, et al. Hippocampal formation glucose metabolism and volume losses in MCI and AD. Neurobiol Aging. 2001;22(4):529–39. doi: 10.1016/s0197-4580(01)00230-5. [DOI] [PubMed] [Google Scholar]
- DeCarli C, Kaye JA, et al. Critical analysis of the use of computer-assisted transverse axial tomography to study human brain in aging and dementia of the Alzheimer type. Neurology. 1990;40(6):872–83. doi: 10.1212/wnl.40.6.872. [DOI] [PubMed] [Google Scholar]
- Dixon WT, Oshinski JN, et al. Myocardial suppression in vivo by spin locking with composite pulses. Magn Reson Med. 1996;36(1):90–4. doi: 10.1002/mrm.1910360116. [DOI] [PubMed] [Google Scholar]
- Gonzalez RG, Fischman AJ, et al. Functional MR in the evaluation of dementia: correlation of abnormal dynamic cerebral blood volume measurements with changes in cerebral metabolism on positron emission tomography with fludeoxyglucose F 18. Am J Neuroradiol. 1995;16(9):1763–70. [PMC free article] [PubMed] [Google Scholar]
- Hampel H, Teipel SJ, et al. Age transformation of combined hippocampus and amygdala volume improves diagnostic accuracy in Alzheimer’s disease. J Neurol Sci. 2002;194(1):15–9. doi: 10.1016/s0022-510x(01)00669-4. [DOI] [PubMed] [Google Scholar]
- Helpern JA, Lee SP, et al. MRI assessment of neuropathology in a transgenic mouse model of Alzheimer’s disease. Magn Reson Med. 2004;51(4):794–8. doi: 10.1002/mrm.20038. [DOI] [PubMed] [Google Scholar]
- Jack CR, Jr, Petersen RC, et al. Prediction of AD with MRI-based hippocampal volume in mild cognitive impairment. Neurology. 1999;52(7):1397–403. doi: 10.1212/wnl.52.7.1397. [DOI] [PMC free article] [PubMed] [Google Scholar]
- Jack CR, Jr, Shiung MM, et al. Comparison of different MRI brain atrophy rate measures with clinical disease progression in AD. Neurology. 2004;62(4):591–600. doi: 10.1212/01.wnl.0000110315.26026.ef. [DOI] [PMC free article] [PubMed] [Google Scholar]
- Jefferson AL, Massaro JM, et al. Inflammatory biomarkers are associated with total brain volume: the Framingham Heart Study. Neurology. 2007;68(13):1032–8. doi: 10.1212/01.wnl.0000257815.20548.df. [DOI] [PMC free article] [PubMed] [Google Scholar]
- Kabani N, Le Goualher G, et al. Measurement of cortical thickness using an automated 3-D algorithm: a validation study. Neuroimage. 2001;13(2):375–80. doi: 10.1006/nimg.2000.0652. [DOI] [PubMed] [Google Scholar]
- Lee VM, Goedert M, et al. Neurodegenerative tauopathies. Annu Rev Neurosci. 2001;24:1121–59. doi: 10.1146/annurev.neuro.24.1.1121. [DOI] [PubMed] [Google Scholar]
- Markkola AT, Aronen HJ, et al. Determination of T1rho values for head and neck tissues at 0.1 T: a comparison to T1 and T2 relaxation times. Magn Reson Imaging. 1998;16(4):377–83. doi: 10.1016/s0730-725x(98)00013-7. [DOI] [PubMed] [Google Scholar]
- Mazziotta J, Toga A, et al. A Four-Dimensional Probabilistic Atlas of the Human Brain. J Am Med Inform Assoc. 2001;8(5):401–430. doi: 10.1136/jamia.2001.0080401. [DOI] [PMC free article] [PubMed] [Google Scholar]
- McDaniel B, Sheng H, et al. Tracking brain volume changes in C57BL/6J and ApoE-deficient mice in a model of neurodegeneration: a 5-week longitudinal micro-MRI study. Neuroimage. 2001;14(6):1244–55. doi: 10.1006/nimg.2001.0934. [DOI] [PubMed] [Google Scholar]
- Moseley ME, deCrespigny A, et al. Magnetic resonance imaging of human brain function. Surg Neurol. 1996;45(4):385–91. doi: 10.1016/0090-3019(95)00421-1. [DOI] [PubMed] [Google Scholar]
- Pfefferbaum A, Mathalon DH, et al. A quantitative magnetic resonance imaging study of changes in brain morphology from infancy to late adulthood. Arch Neurol. 1994;51(9):874–87. doi: 10.1001/archneur.1994.00540210046012. [DOI] [PubMed] [Google Scholar]
- Sandor T, Jolesz F, et al. Comparative analysis of computed tomographic and magnetic resonance imaging scans in Alzheimer patients and controls. Arch Neurol. 1992;49(4):381–4. doi: 10.1001/archneur.1992.00530280069024. [DOI] [PubMed] [Google Scholar]
- Santyr GE. MR imaging of the breast. Imaging and tissue characterization without intravenous contrast. Magn Reson Imaging Clin N Am. 1994;2(4):673–90. [PubMed] [Google Scholar]
- Selkoe DJ. Translating cell biology into therapeutic advances in Alzheimer’s disease. Nature. 1999;399(6738 Suppl):A23–31. doi: 10.1038/399a023. [DOI] [PubMed] [Google Scholar]
- Shen D, Davatzikos C. HAMMER: hierarchical attribute matching mechanism for elastic registration. IEEE Trans Med Imaging. 2002;21(11):1421–39. doi: 10.1109/TMI.2002.803111. [DOI] [PubMed] [Google Scholar]
- Sullivan EV, Shear PK, et al. Greater abnormalities of brain cerebrospinal fluid volumes in younger than in older patients with Alzheimer’s disease. Arch Neurol. 1993;50(4):359–73. doi: 10.1001/archneur.1993.00540040021009. [DOI] [PubMed] [Google Scholar]
- Thompson PM, Hayashi KM, et al. Tracking Alzheimer’s disease. Ann N Y Acad Sci. 2007;1097:183–214. doi: 10.1196/annals.1379.017. [DOI] [PMC free article] [PubMed] [Google Scholar]
- Uryu K, Laurer H, et al. Repetitive mild brain trauma accelerates Abeta deposition, lipid peroxidation, and cognitive impairment in a transgenic mouse model of Alzheimer amyloidosis. J Neurosci. 2002;22(2):446–54. doi: 10.1523/JNEUROSCI.22-02-00446.2002. [DOI] [PMC free article] [PubMed] [Google Scholar]
- Wheaton AJ, Borthakur A, et al. Method for reduced SAR T1rho-weighted MRI. Magn Reson Med. 2004;51(6):1096–102. doi: 10.1002/mrm.20141. [DOI] [PubMed] [Google Scholar]
- Wheaton AJ, Borthakur A, et al. Application of the keyhole technique to T1rho relaxation mapping. J Magn Reson Imaging. 2003;18(6):745–9. doi: 10.1002/jmri.10412. [DOI] [PubMed] [Google Scholar]
- Witschey WR, Borthakur A, et al. T1rho-Prepared Balanced Steady-State Free Precession for Rapid 3D T1rho-weighted MRI. J Magn Reson Imaging. 2008 doi: 10.1002/jmri.21444. in press. [DOI] [PMC free article] [PubMed] [Google Scholar]