

Summary
Extracting biological insight from microarray data is important but challenging. Here we describe TAPPA, a java-based tool, for identification of phenotype-associated genetic pathways utilizing the pathway topological measures. This is achieved by first calculating a Pathway Connectivity Index (PCI) for each pathway, followed by evaluating its correlation to the phenotypic variation. Our PCI definition not only efficiently captures the contributions from genes that show subtle but consistent changes in expression, but also naturally overweighs the hub genes that interact with a large number of other genes in the pathway. TAPPA also allows evaluation of sub-modules within a pathway and their association to phenotypes.
1 Introduction
Since its introduction more than a decade ago, the challenge of gene expression profiling using microarrays has changed from obtaining quality data to elucidating biological meanings of the expression data. Pathways are sets of genes that act together to achieve certain cellular or physiologic functions. Prioritizing pathways relevant to a particular phenotype can help researchers focus on the subset of most relevant genes, and generate further biological hypotheses. Functional pathway enrichment analysis has become popular in advanced microarray data analyses. Usually significant gene lists are created with P-value or fold change, followed by identification of pathways that have enhanced representation in the gene lists. Genes belonging to the same pathway often exhibit subtle, coordinated changes in their expressions. Such approaches are not sensitive to these genes. To address this issue, Gene Set Enrichment Analysis (GSEA) was developed by examining the overall differences in expression patterns between predefined gene sets and the whole gene list on the array (Subramanian et al., 2003).
All these methods ignore the topological property of gene interaction networks within the pathway, thus treating all genes in the pathway equally. However, it is believed that ‘hub’ genes with a high degree of connections with other genes (i.e. topologically important) usually are most critical to network function (Carter et al., 2004). What is worse that ‘hub genes’ often show low level of changes, their changes are easily overshadowed by the non-hub genes (Lu et al., 2007). Recently, topological properties of networks have been utilized to characterize disease states, based on number of regulatory links between transcription factors and target genes (Tuck et al., 2006); and in cancer classification and identification of class-specific pathways, based on the fraction of network edges that are specific to the subclasses (Liu et al., 2006). Here, we define a novel pathway connectivity index (PCI) to characterize the topology of pathway at expression level, and then utilize it to identify pathways that are significantly associated to a certain phenotype.
2 Method
2.1 Pathway connectivity index
Our approach adopts the molecular connectivity concept in chemoinformatics. The molecular connectivity index is a widely used topological descriptor of chemical compounds and has been successfully used in many other fields, including protein structure and drug discovery. Typically, for a chemical molecule the zero and first-order indices are defined by:
| (1) |
where g(i) and g(j) are the contributions attributed to atom i and j, first defined as the vertex degrees (or their reciprocals) of atoms, and later extended to other chemical properties (Hu et al., 2003). n(atoms) is the number of atoms in the molecule, quantity g(i)0.5*g(j)0.5 can be considered as the description of the i − j bond. 0χ and 1χ can be regarded as the contributions of all atoms and all chemical bonds, respectively, and 1χ reflects the inner atomic connectivity in the molecule.
Following this idea, we define PCI for a specific pathway:
A pathway, such as hsa00010 in KEGG, can be represented by a graph G(V, E), where V = {g1, g2,…, gn} represents the vertex set, and E = {(gi, gj)| genes gi and gj interact} represents the edge set. The adjacency matrix is defined as A = (aij), where aij = 1 if i = j or (gi, gj) ∈ E and aij = 0 if (gi, gj) ∉ E.
Assuming that xis is the normalized log expression measurement [e.g. each column expression values are normalized to zero mean and same scope with , and further normalized to (−0.5, 0.5) with Sigmoid function (Sigmoid (xis) − 0.5) to lower the effects of extremely large/small values] for gene i in sample s. For each pathway we define:
| (2) |
where N is the number of genes in it. Sgn(xis + xjs) represents the overall expression status (up- or down-regulation) of the gene pair, and helps to reduce the information loss resulted from using absolute values.
It is important to note that xis and xjs tend to have same signs (positive or negative), e.g. in KEGG pathways, most of interacting gene pairs have been found to be evolutionally conserved, and thus often show high correlation in their expressions (Bhardwaj and Lu, 2005). Evidently, PCI incorporates information of all available genes in the pathway, subtle yet consistent gene expression modification would lead to a significant change of PCI. Further, PCI captures well the topological property of the pathway, as hub genes contribute more to PCI. Normalized PCIs (divided by the gene number in pathway) follow roughly a normal distribution (Fig. S6).
2.2 Association between pathway and phenotype
TAPPA is designed to handle both binary and quantitative traits. For binary traits, Mann–Whitney test is used to evaluate the significance of association between pathway PCI and phenotype. For continuous traits, Spearman correlation is used. The false discovery rate (FDR) is further determined through a permutation test. In a pathway, higher correlation can be obtained between PCI and phenotype if more genes correlate with the phenotype. PCI defined in this article would degenerate into the average of expression values if there is no (or if we do not consider) connections among genes. This corresponds to the approach described by Li et al., where correlation between average expression values of transcription modules and classical traits is used to evaluate the strength of association between them (Li et al., 2006). Note that this is conceptually equivalent to the definition of 0χ. PCI is expected to be advantageous as it incorporates consideration of the network topological structure.
3 Implementation
TAPPA was written in JAVA, a platform-independent language. The main functions of TAPPA include: (1) prioritize pathways associated with discrete or quantitative phenotypic traits, and calculate the corresponding FDR; (2) visualize the pathway with different zoom ratios and highlight the genes closely related to the phenotype and (3) examine phenotype association of the sub-modules within a pathway. This step is particularly helpful to determine the biological relevance of the associated genes, as correlation with genes in a sub-module is more meaningful than with the genes are dispersed in the pathway.
4 Conclusion and Future Work
Pathway analysis is a useful approach to uncover the biological meaning from expression data. However, the inner connectivity should not be ignored, and hub genes need to be emphasized. PCI utilizes expression information of all genes in a pathway, and can well capture its topological properties. We have evaluated the ability of TAPPA to identify genetic pathways associated with clinical traits (both binary and continuous) with three published gene expression datasets, and compared it with existing pathway mining programs, the results can be found in the Supplementary Material. So far, we have collected KEGG pathways with gene number higher than 8, and are in the process of parsering the BioCarta pathways (http://cmap.nci.nih.gov/Pathways/BioCarta). We will also extend our tool, such that it is suitable for protein interaction networks.
Fig. 1.
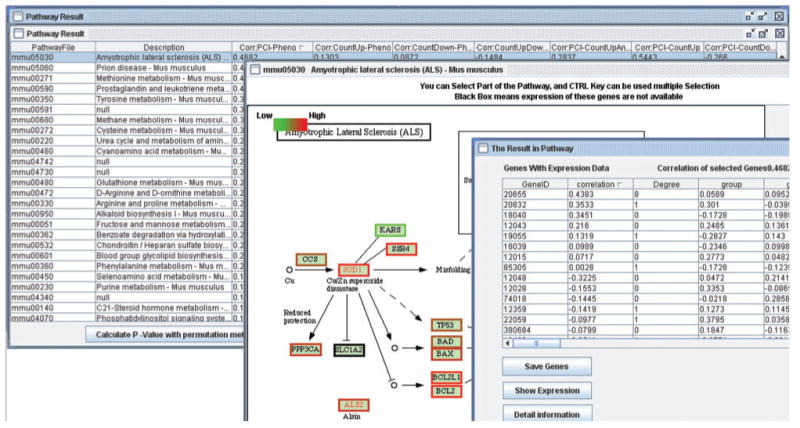
An exemplary result of TAPPA to prioritize and visualize pathways. The data are from GEO (http://www.ncbi.nlm.nih.gov; accession number: GSE3330), gluc8 is selected as phenotype. The results accords with clinical view that type 2 diabetes may lead to ALS, both the PCI and hub gene SOD1 (geneid: 20655) highly correlate with the phenotype values (04682 and 0.4383). In mmu05030, the correlation coefficient between the average of normalized gene expression of all genes and phenotype is only 0.199.
Acknowledgments
The project described was supported by the National Institute of Diabetes and Digestive and Kidney Diseases under grant No. R01DK080100.
Footnotes
Associate Editor: Olga Troyanskaya
Availability: TAPPA and data for Figure 1 are freely available from http://watson.mcgee.mcw.edu:8080/∼sgao
Supplementary information: Supplementary data are available at Bioinformatics online.
Conflict of Interest: none declared.
References
- Bhardwaj N, Lu H. Correlation between gene expression profiles and protein–protein interactions within and across genomes. Bioinformatics. 2005;21:2730–2738. doi: 10.1093/bioinformatics/bti398. [DOI] [PubMed] [Google Scholar]
- Carter SL, et al. Gene co-expression network topology provides a framework for molecular characterization of cellular state. Bioinformatics. 2004;20:2242–2250. doi: 10.1093/bioinformatics/bth234. [DOI] [PubMed] [Google Scholar]
- Hu QN, et al. The matrix expression, topological index and atomic attribute of molecular topological structure. J Data Sci. 2003;1:361–389. [Google Scholar]
- Li H, et al. Integrative genetic analysis of transcription modules: towards filling the gap between genetic loci and inherited traits. Hum Mol Genet. 2006;15:481–492. doi: 10.1093/hmg/ddi462. [DOI] [PubMed] [Google Scholar]
- Liu CC. Topology-based cancer classification and related pathway mining using microarray data. Nucleic Acids Res. 2006;34:4069–4080. doi: 10.1093/nar/gkl583. [DOI] [PMC free article] [PubMed] [Google Scholar]
- Lu X, et al. Hubs in biological interaction networks exhibit low changes in expression in experimental asthma. Mol Syst Biol. 2007;3:98. doi: 10.1038/msb4100138. [DOI] [PMC free article] [PubMed] [Google Scholar]
- Subramanian A, et al. Gene set enrichment analysis: a knowledge-based approach for interpreting genome-wide expression profiles. Proc Natl Acad Sci USA. 2003;102:15545–15550. doi: 10.1073/pnas.0506580102. [DOI] [PMC free article] [PubMed] [Google Scholar]
- Tuck DP, et al. Characterizing disease states from topological properties of transcriptional regulatory networks. BMC Bioinformatics. 2006;7:236. doi: 10.1186/1471-2105-7-236. [DOI] [PMC free article] [PubMed] [Google Scholar]