

Abstract
The cerebellum, which forms from anterior hindbrain, coordinates motor movements and balance. Sensory input from the periphery is relayed and modulated by cerebellar interneurons, which are organized in layers. The mechanisms that specify the different neurons of the cerebellum and direct its layered organization remain poorly understood. Drawing from investigations of spinal cord, we hypothesized that the embryonic cerebellum is patterned on the dorsoventral axis by opposing morphogens. We tested this using zebrafish. Here we show that expression of olig2, which encodes a bHLH transcription factor, marks a distinct subset of neurons with similarities to eurydendroid neurons, the principal efferent neurons of the teleost cerebellum. In combination with other markers, olig2 reveals a dorsoventral organization of cerebellar neurons in embryos. Disruption of Hedgehog signaling, which patterns the ventral neural tube, produced a two-fold increase in the number of olig2+ neurons. By contrast, olig2+ neurons did not develop in embryos deficient for Wnt signaling, which patterns dorsal neural tube, nor did they develop in embryos deficient for both Hedgehog and Wnt signaling. Our data indicate that Hedgehog and Wnt work in opposition across the dorsoventral axis of the cerebellum to regulate formation of olig2+ neurons. Specifically, we propose that Hedgehog limits the range of Wnt signaling, which is necessary for olig2+ neuron development.
Keywords: cerebellum, Purkinje neuron, eurydendroid neuron, Hedgehog, Wnt, zebrafish, dorsoventral, olig2
Introduction
The cerebellum functions as the main control center for balance and motor function and also contributes to cognitive learning (Fiez, 1996; Holmes, 1939; Ito, 2000; Morton and Bastian, 2004; Raymond et al., 1996; Schutter and van Honk, 2005; Thach et al., 1992). It is radially organized into several distinct layers, which are interconnected by axonal projections and synaptic contacts (Altman and Bayer, 1978; Altman and Bayer, 1985; Wang and Zoghbi, 2001). The molecular layer is the outermost and consists of stellate and basket neurons, which make synaptic connections with dendrites of Purkinje neurons. Golgi cells and the cell bodies of Purkinje neurons comprise the Purkinje layer, just below the molecular layer. Purkinje neurons are the chief output neuron of the mammalian cerebellum and their axons project to deep cerebellar nuclei (Altman and Bayer, 1985), which relay signals to various output peduncles that synapse with midbrain structures (thalamus, red nuclei and premotocortex), dorsal brainstem or cerebral neocortex (de Zeeuw and Berrebi, 1996). The granule layer, located below the Purkinje layer, consists of granule neurons, which are excitatory cells that also synapse with Purkinje neuron dendrites. In teleosts, Purkinje neurons project within the cerebellum directly onto eurydendroid neurons, located ventral to Purkinje cell bodies, instead of to the deep brainstem. Eurydendroid neurons in turn make connections to the diencephalon and caudal medulla and thus serve the same function as deep cerebellar nuclei in mammalian systems (Diaz-Regueira and Anadon, 2000; Finger, 1978; Ikenaga et al., 2006; Lannoo et al., 1991b).
Of these cerebellar features, the development of granule neurons is perhaps best understood. Granule neuron progenitors arise from the rhombic lip, a specialized proliferative zone along the dorsolateral rhombencephelon. Guided, at least in part, by Netrin1 and Slit2, they migrate over the surface of the cerebellum to form a transient external granule layer (Gilthorpe et al., 2002) Subsequently, signals secreted by Purkinje neurons cause granule neuron progenitors to proliferate and migrate into the cerebellum to form the inner granule layer (Dahmane and Ruiz i Altaba, 1999; Traiffort et al., 1998).
Many other neurons of the cerebellum, including Purkinje neurons, stellate, basket and Golgi neurons, apparently originate within the proliferative ventricular zone (VZ) (Altman and Bayer, 1978; Altman and Bayer, 1985). Retrospective lineage analysis in mouse and chick showed that some clones included Purkinje neurons, molecular layer neurons and glia (Lin and Cepko, 1999; Mathis et al., 1997). Thus, many cerebellar VZ precursors are multipotent, producing distinct cell types that occupy different layers. Although several genes that are important for Purkinje neuron migration and maintenance have been described (Wang and Zoghbi, 2001), very little is known about the mechanisms that specify cerebellar cell type and determine the layered organization of the cerebellum.
Here we describe experiments designed to investigate mechanisms of cerebellar patterning during development, using zebrafish as a model system. We hypothesized that signals that pattern the dorsoventral (DV) axis of the neural tube influence the fate of cells that arise from the cerebellar VZ, similar to neuronal specification in the spinal cord. Consistent with this, we found that Hedgehog (Hh) signaling, which is active in ventral neural tube, limits the number of neurons that express olig2. Expansion in olig2+ neuron number resulting from loss of Hh signaling was accompanied by an expansion of wnt1 expression. Conversely, embryos deficient for Wnt signaling failed to form olig2+ neurons, even in the absence of Hh signaling. Our data support a model in which Wnt signaling, limited to dorsal cerebellum by Hh, is necessary for olig2+ neuron specification.
Materials and methods
Zebrafish staging and strains
Embryos were produced by pairwise matings and raised at 28.5°C, then staged according to hours post fertilization (hpf) and days post fertilization (dpf) in addition to morphological criteria (Kimmel et al., 1995). Mutant alleles included smob641 (Barresi et al., 2000; Varga et al., 2001) and Df(LG01:lef1)x8 (Phillips et al., 2006). Transgenic alleles included Tg(olig2:egfp)vu12 (Shin et al., 2003) and Tg(hsp70:dkk1-GFP)w32 (Stoick-Cooper et al., 2007).
In situ RNA hybridization
In situ RNA hybridization was performed as described previously (Hauptmann and Gerster, 2000). Antisense RNA probes included olig2 (Park et al., 2002), ptc1 (Concordet et al., 1996), shh (Krauss et al., 1993), atoh1a (Kim et al., 1997) and wnt1 (Molven et al., 1991). Hybridization was detected using anti-digoxigenin antibody conjugated to alkaline phosphatase, followed by a color reaction using a solution of BM Purple AP Substrate (Roche Diagnostics). All embryos for sectioning were embedded in 1.5% agar/5% sucrose and frozen in 2-methyl-butane chilled by immersion in liquid nitrogen. Sections of 10 µm thickness were obtained using a cryostat microtome. Whole embryos were deyolked for imaging and placed in 75% glycerol solution on bridged slides and coverslipped. Images were collected using a QImaging Retiga Exi color CCD camera mounted on an Olympus AX70 compound microscope and imported into Adobe Photoshop. All image manipulations were restricted to adjustment of levels, curves, saturation, hue and color balance.
Immunohistochemistry
We used the following primary antibodies for immunohistochemistry on fixed embryos and larvae: mouse anti-Zebrin II (1:1000, gift of Dr. R Hawkes) (Brochu et al., 1990), mouse anti-HuC/D (16A11, 1:100, Molecular Probes) (Marusich et al., 1994), rabbit anti-Calretinin (1:1000, Swant Products) (Schwaller et al., 1993), mouse anti-Parvalbumin (1:1000, Chemicon) (Porteros et al., 1998) and rabbit anti-GABA (1:10,000, Sigma) (Villani et al., 1982). For fluorescent detection we used Alexa Fluor 568 goat anti-mouse conjugate and Alexa Fluor 647 goat anti-rabbit (1:200, Molecular Probes). All embryos and larvae for sectioning were embedded in 1.5% agar/5% sucrose and frozen in 2-methyl-butane chilled by immersion in liquid nitrogen. Sections of 10 µm thickness were obtained using a cryostat microtome. Fluorescent images of sectioned embryos were collected using a 40X oil-immersion (NA = 1.3) objective mounted on a motorized Zeiss Axiovert 200 microscope equipped with a PerkinElmer ERS spinning disk confocal system or a Zeiss LSM510 Meta laser scanning confocal microscope and imported into Volocity (Improvision). Whole mount fluorescent images were collected using a QImaging Retiga Exi color CCD camera mounted on an Olympus AX70 compound microscope and imported into Adobe Photoshop. All image manipulations were restricted to adjustment of levels, curves, saturation and hue.
Cyclopamine treatments
Embryos were incubated in Embryo Medium (EM) (15 mM NaCl, 0.5 mM KCl, 1 mM CaCl2, 1 mM MgSO4, 0.15 mM KH2PO4, 0.05 mM NH2PO4, 0.7 mM NaHCO3) containing 50 µM cyclopamine (CA) (Toronto Research Chemicals), diluted from a 10 µM stock dissolved in ethanol. Embryos were treated in their chorions at shield stage or following manual dechorionation with any treatments that began after 24 hpf.
Heat-shock induction
To induce expression of Dkk1, hsDkk1GFP embryos were collected from matings of heterozygous hsDkk1GFP fish and raised in EM at 28.5°C. Embryos were cooled to 24°C for one hour at 29 hpf then transferred to a microfuge tube filled with EM in a 40°C water bath for one hour. Embryos were sorted by GFP expression and only highly-expressing embryos were selected for analysis. These embryos were then placed back in EM at 28.5°C and raised until 48 hpf.
Quantification of EGFP+ neurons
To quantify the number of EGFP+ cells in a whole cerebellum Tg(olig2:egfp) embryos were fixed at 48 hpf. The embryos were dissected using watch maker’s forceps, removing the eyes, yolk, forebrain and trunk to isolate the cerebellum. Cerebellums were mounted in 75% glycerol on bridged coverslips. Images were collected at 2 µM intervals through the entire depth of the cerebellum using a confocal microscope. The images were imported into Volocity and then exported to Openlab (Improvision). Each Z stack image was examined and individual EGFP+ cells were labeled and counted.
Results
Zebrafish cerebellar cells express olig2
To initiate an investigation of cerebellar patterning we examined expression of olig2, which encodes a bHLH transcription factor (Zhou et al., 2000; Takebayashi et al., 2000; Park et al., 2002; Lu et al., 2000), by in situ RNA hybridization. At 24 hours post fertilization (hpf), expression was evident in ventral spinal cord, as previously described (Park et al., 2002), and in ventral diencephalon but not in the cerebellum (Fig. 1A). By 36 hpf, a prominent domain of olig2 expression appeared near the dorsal boundary between midbrain and hindbrain (data not shown). Expression was maintained at 48, 72, and 96 hpf (Fig. 1B–D) through at least 7 days post fertilization (dpf) (data not shown). Transverse and sagital tissue sections revealed that cerebellar cells dorsal to the anterior medulla oblongata expressed olig2 (Fig. 1H–J, N–P) in a pattern consistent with that of other cerebellar genes (Mueller et al., 2006; Mueller and Wullimann, 2003).
Fig. 1.
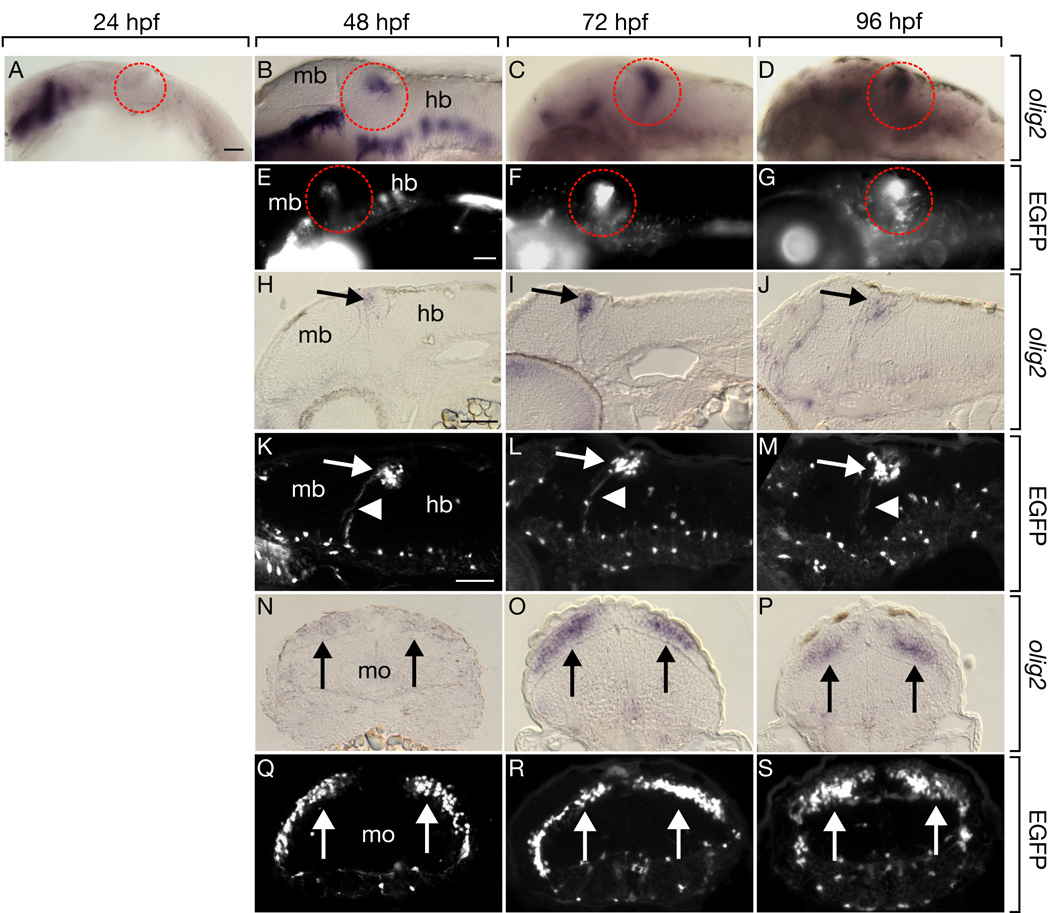
Transgenic reporter gene expression recapitulates endogenous olig2 RNA expression in zebrafish cerebellum. Lateral whole mount views and sagital sections are shown with dorsal up and anterior to the left. Transverse sections are oriented dorsal up. Midbrain (mb), hindbrain (hb) and medulla oblongata (mo) are marked. (A–D) Developmental time course of olig2 expression detected by in situ RNA hybridization in whole embryos. Dashed circles mark where cerebellum is located. (E–G) EGFP expression driven by the Tg(olig2:egfp) transgene in live embryos. Expression within cerebellum is circled. (H–J) Sagital sections through cerebellum with olig2 RNA expression marked by arrows. (K–M) Arrows mark EGFP+ cells in cerebellum of sagitally sectioned Tg(olig2:egfp) embryos and arrowheads show axonal extensions from EGFP+ cells. Transverse sections through cerebellum showing olig2 RNA (N–P) and EGFP (Q–S) expression marked by arrows. Scale bars represent 20 µm in all panels.
Previously, we described a transgenic line in which olig2 regulatory DNA drives expression of EGFP, recapitulating endogenous olig2 expression in spinal cord (Shin et al., 2003). The pattern of cerebellar EGFP expression was also identical to that of olig2 RNA (Fig. 1E–G, K–M, Q–S), with the exception that EGFP was first detectable at 40 hpf, presumably reflecting a delay in EGFP folding and fluorescence following translation (data not shown). EGFP in Tg(olig2:egfp) embryos is cytosolic and reveals both cell bodies and processes. Notably, cerebellar EGFP+ cells extended long processes to the deep brainstem (Fig. 1K–M).
olig2 expression identifies a subset of cerebellar neurons
The long EGFP+ projections evident at 48 hpf were suggestive of axons. To determine if cerebellar olig2+ cells are neurons we labeled sections of Tg(olig2:egfp) 48 hpf embryos with anti-Hu antibody, which marks newly born postmitotic neurons (Marusich et al., 1994). The majority of the cerebellar olig2+ cells expressed Hu, identifying them as neuronal (Fig. 2A–C). To examine more closely the morphology of olig2+ cells we next imaged living Tg(olig2:egfp) larvae using confocal microscopy. High magnification dorsal views of 54 hpf animals revealed deep ventral projections, as noted above (Fig. 2D). By 7 dpf, olig2+ cells appeared to project single, extensively branched dendrites toward the exterior surface of the cerebellum (Fig. 2E).
Fig. 2.
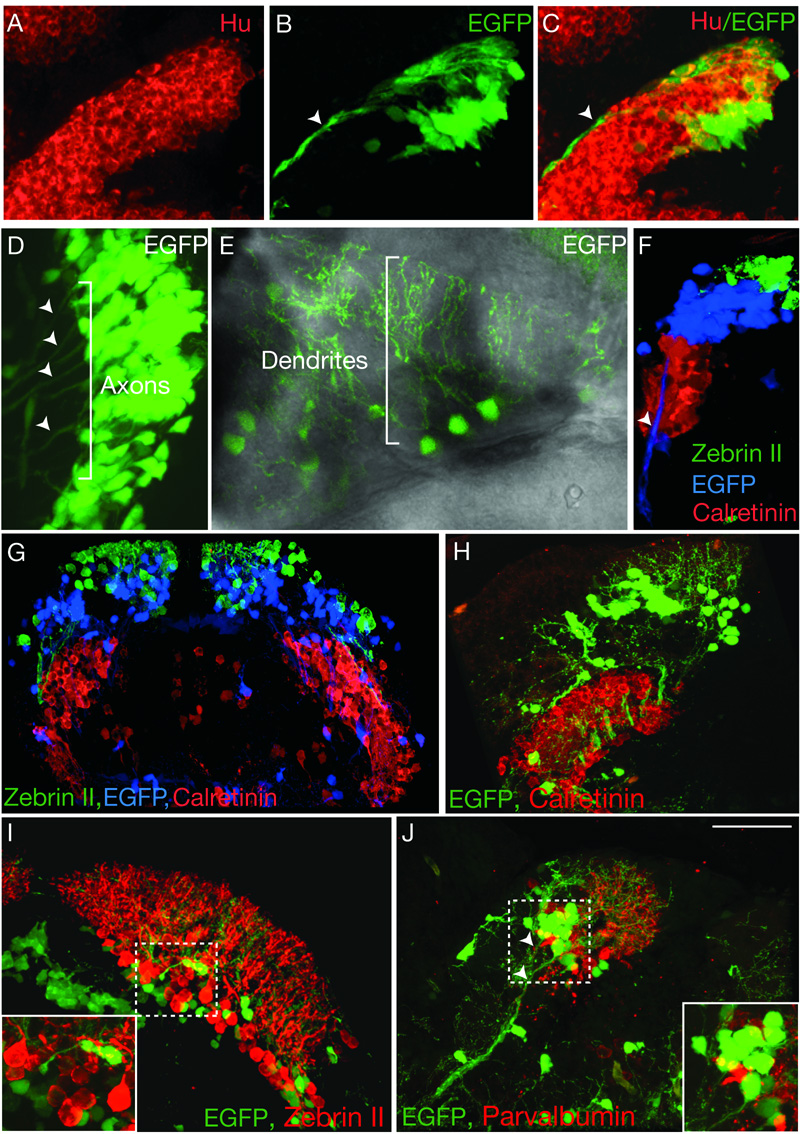
Identification of cerebellar cell types reveals distinct populations of olig2+ neurons organized alng the DV axis. (A–C) Sagital section through cerebellum of 48 hpf Tg(olig2:egfp) transgenic embryo showing EGFP+ cells expressed Hu (red). Arrowheads mark long axonal projections. (D) Dorsal view with anterior to left of one half of the cerebellum in living Tg(olig2:egfp) embryo at 56 hpf. Bracket and arrowheads mark EGFP+ axons extending from EGFP+ cells ventrally along midbrain-hindbrain boundary. (E) Dorsal view of cerebellum in living Tg(olig2:egfp) larva at 7 dpf, anterior is along the bottom. Bracket indicates extensive dendritic branches originating from EGFP+ cells. (F) 3-D reconstruction of 5 dpf sagital section of a Tg(olig2:egfp) larva illustrating DV organization of Zebrin II+ (green), EGFP+ (blue) and Calretinin+ (red) cells. Arrowhead marks ventrally extending EGFP+ axons. (G) Transverse section a 5 dpf Tg(olig2:egfp) larva showing Zebrin II, EGFP and Calretinin labeling of distinct populations and DV arrangement. (H–J) Sections of 14 dpf Tg(olig2:egfp) transgenic larvae labeled with Calretinin, Parvalbumin and Zebrin II antibodies. (H) Transverse hemisection shows EGFP+ cells dorsal to Calretinin+ eurydendroid cells. (I) Transverse hemisection showing EGFP+ cells intermixed with Zebrin II+ Purkinje neurons. Inset shows enlargement of area framed by dashed lines. (J) Sagital section showing distinct populations of Parvalbumin+ Purkinje neurons and EGFP+ neurons. Arrowheads mark EGFP+ axons extending toward deep brainstem. Inset shows enlargement of area framed by dashed lines. Scale bar = 20 µm for all panels except G, for which it represents 40 µm.
We next tried to identify olig2+ cells using antibodies previously used as Purkinje neuron and eurydendroid cell markers. First, we labeled transverse and sagital sections of 5 dpf Tg(olig2:egfp) larvae with Zebrin II antibody, which identifies Purkinje neurons in both mammals and teleosts (Brochu et al., 1990; Lannoo et al., 1991a; Lannoo et al., 1991b; Meek et al., 1992), and antibody specific to Calretinin, a calcium-binding protein expressed by a subset of eurydendroid neurons (Castro et al., 2006; Diaz-Regueira and Anadon, 2000). As expected, Zebrin II and Calretinin immunofluorescence did not colocalize, with Zebrin II+ Purkinje neurons dorsal to Calretinin+ eurydendroid neurons (Fig. 2F, G). However, neither antibody labeled olig2+ cells (Fig. 2F, G). Instead, most olig2+ cells occupied space between Zebrin II+ Purkinje neurons and Calretinin+ eurydendroid cells, although some olig2+ cells were intermixed with Zebrin II+ and Calretinin+ cells (Fig. 2F, G). Thus, Zebrin II, olig2 and Calretinin expression mark distinct cerebellum cell populations that occupy dorsal, intermediate and ventral positions, respectively.
We reasoned that olig2+ cells might be relatively immature at 5 dpf and not yet express markers of differentiated neurons. Therefore, we labeled sections obtained from 14 dpf transgenic animals. Although olig2+ cells were closely associated with Calretinin+ and Zebrin II+ cells, they remained as distinct cell populations (Fig. 2H, I). We also used anti-Parvalbumin antibody, which has been used to mark Purkinje neurons (Porteros et al., 1998). Consistent with Zebrin II labeling, olig2+ cells did not express Parvalbumin (Fig. 2J). In goldfish, three morphologically distinct types of eurydendroid cells are distributed in the Purkinje, granule and molecular cell layers, many of which are intimately associated with Zebrin II+ cells and fibers (Ikenaga et al., 2005). Many olig2+ cells are similarly in close contact with Zebrin II+ and Parvalbumin+ cells (Fig. 2I, J). Because olig2+ cells extend axons to the deep brainstem they most likely are a subpopulation of eurydendroid neurons although, lacking definitive molecular marker evidence, we cannot rule out other possibilities.
The cerebellar olig2+ cell population is enlarged in the absence of Hh signaling
The distribution of Zebrin II+, olig2+ and Calretinin+ cells in the cerebellum was reminiscent of the DV organization of spinal cord neurons. In the spinal cord, specification of different cell types along the DV axis is influenced by graded Hh signaling (Jessell, 2000). Ventral spinal cord cells in mouse and zebrafish embryos that lack Hh signaling fail to express olig2 (Lu et al., 2000; Park et al., 2002), indicating Hh promotes olig2 expression. To test the possibility that Hh also patterns the cerebellar DV axis, we investigated olig2 expression in embryos that were homozygous for a mutation of the smoothened homolog (smo) gene, which encodes a seven transmembrane protein necessary for Hh signaling (Alcedo et al., 1996; Huangfu and Anderson, 2006). As previously described (Park et al., 2002), spinal cord cells of smo mutant embryos did not express olig2 (Fig. 3D). By contrast, cerebellar olig2 expression was elevated in smo mutant embryos (Fig. 3E, F). From a dorsal view, the stripe of olig2 expression was both broader in the anteroposterior axis and extended more ventrally than normal (Fig. 3B, C, E, F).
Fig. 3.
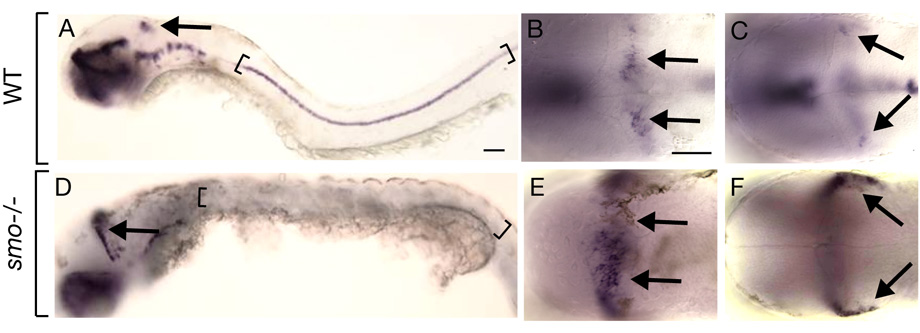
Hh signaling restricts cerebellar olig2 expression. Lateral (A, D) and dorsal (B, C, E, F) views of 48 hpf embryos with anterior to the left. Arrows indicate cerebellar olig2 expression. Brackets mark ventral spinal cord. (A) Wild-type embryo illustrating olig2 expression within cerebellum and spinal cord. Dorsal (B) and ventral (C) focal planes of wild-type cerebellum. (D–F) Similar views of olig2 expression in smo mutant embryo. Note expansion of cerebellar expression and absence of spinal cord expression. Scale bars represent 20 µm for all panels.
To quantify cerebellar olig2+ cells, we used confocal microscopy to count EGFP+ cells of Tg(olig2:egfp) embryos. At 48 hpf, an average of approximately 65 olig2+ cells occupied each half of the cerebellum of wild-type transgenic embryos (Fig. 4A). Similarly staged smo−/−;Tg(olig2:egfp) embryos had nearly a two-fold increase in the number of olig2+ cells (Fig. 4A). Thus in normal development, Hh limits formation of olig2+ cells in the cerebellum.
Fig. 4.
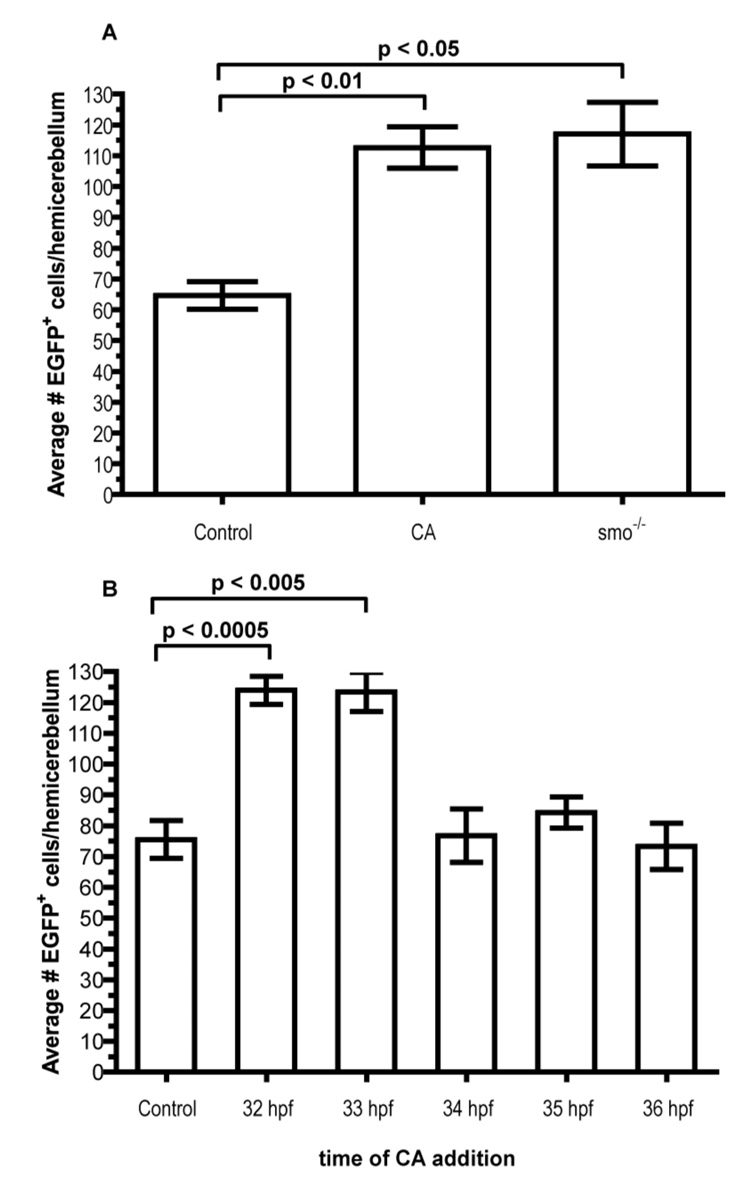
Temporal regulation of olig2+ cell number by Hh signaling. (A) Graph depicting average number of EGFP+ cerebellar cells. n = 14 hemicerebellums for each condition. Statistical significance calculated in accordance to Student’s t-test. (B) Time course assay of EGFP+ cells in Tg(olig2:egfp) embryos treated with CA. 32 and 33 hpf treatments produced significant increases compared to control. n = 10 hemicerebellums for each time point except 35 hpf, where n = 11.
Previous studies have shown the pharmacological agent cyclopamine (CA) directly binds to Smoothened and specifically inhibits Hh signal transduction (Chen et al., 2002). Consistent with this, zebrafish embryos incubated with CA had a deficit of motor neurons, similar to smo mutant embryos (Chen et al., 2001; Lewis and Eisen, 2001; Park et al., 2004). To determine if CA treatment phenocopies the smo mutant cerebellar defect, we treated Tg(olig2:egfp) embryos at 6 hpf, an early gastrulation stage, and counted EGFP+ cells as described above. Similar to smo mutant embryos, CA treated embryos had an almost two-fold increase in olig2+ cell number when compared to control embryos (Fig. 4A).
To determine the time during which Hh signaling is necessary for regulating olig2+ cell formation, we utilized CA to selectively block Smoothened function at different intervals. We treated Tg(olig2:egfp) embryos at 24, 28, 32, 33, 34, 35, and 36 hpf, allowed them to mature to 48 hpf and counted EGFP+ cells. Embryos treated at 33 hpf and earlier had approximately the same number of olig2+ cerebellar cells as smo mutant embryos and embryos treated continuously from 6 hpf with CA. By contrast, those treated at 34 hpf and later had approximately the same number as control embryos (Fig. 4B). These data indicate Hh signaling regulates olig2+ cell development in the cerebellum before 33 hpf.
Expression patterns of Hh pathway genes do not coincide with cerebellar olig2+ cells
To investigate if Hh signaling is active in cerebellar cells we used in situ RNA hybridization to analyze expression of genes that encode components of the Hh pathway. shh expression was ventral to the cerebellum at 30 hpf and 48 hpf (Fig. 5A–C), spanning the critical time period for Hh regulation of olig2+ PN formation. As previously reported (Ekker et al., 1995) tiggy winkle hedgehog (twhh) was expressed similarly to shh, whereas echidna hedgehog (ehh) was restricted to the trunk notochord (Currie and Ingham, 1996) (data not shown). patched 1 (ptc1) RNA, which is expressed by cells in which the Hh pathway is active (Concordet et al., 1996; Marigo and Tabin, 1996), was prominent along the lower rhombic lip of the hindbrain but not within the cerebellum (Fig. 5D–F). gli1, which encodes a transcription factor that mediates Hh signaling (Karlstrom et al., 2003; Lee et al., 1997), was expressed similarly to ptc1 (data not shown). Thus, although our functional data show that Hh signaling limits formation of cerebellar olig2+ cells, our gene expression data indicate that Hh signaling is active only in cells located at a distance from them. This raised the possibility that Hh signaling influences cerebellar olig2+ cell development indirectly, by regulating other pathways.
Fig. 5.
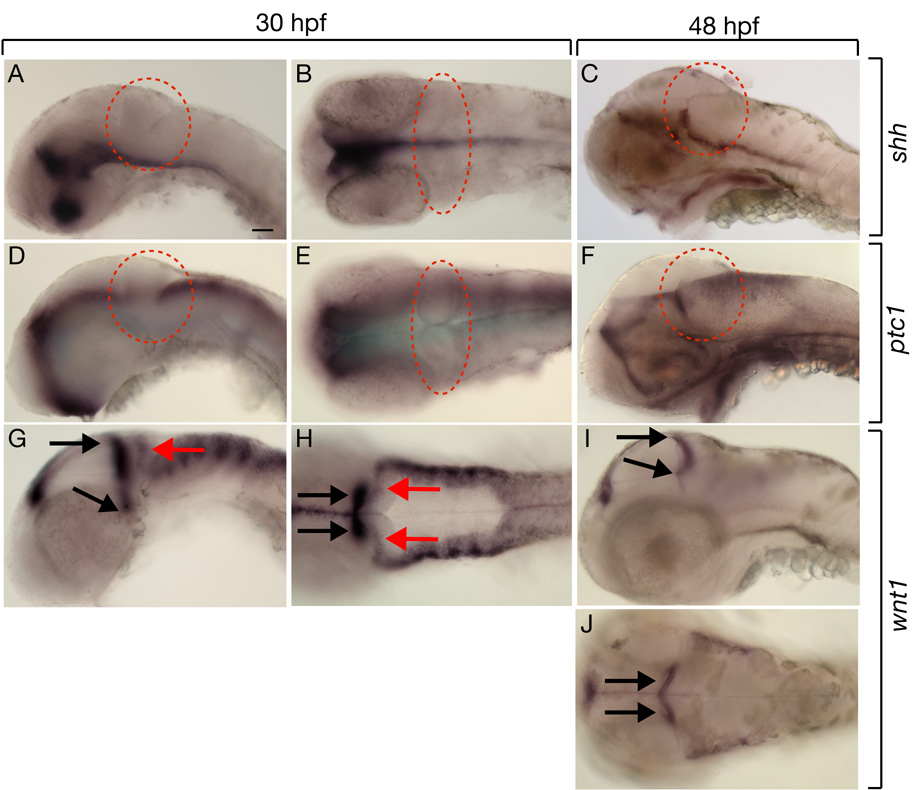
Zebrafish cerebellum expresses wnt1 but not Hh pathway genes. All panels are lateral or dorsal views with anterior to the left. Dashed circles mark cerebellums. (A–C) Expression of shh was ventral to cerebellum. (D–F) Expression of ptc1 at 30 hpf was absent from cerebellum but by 48 hpf was present in the lower rhombic lip. (G, H) Expression of wnt1 at 30 hpf, red arrows mark transient wnt1 expression within the cerebellum and black arrows mark expression at the midbrain-hindbrain boundary. (I, J) By 48 hpf, wnt1 expression was no longer present within the cerebellum but persisted at the midbrain-hindbrain boundary. Scale bars represent 20 µm in all panels.
Spinal cord patterning and specification of neurons along the DV axis is dependant on opposing gradients of morphogens secreted from the roof plate and floor plate (Wilson and Maden, 2005). Notably, dorsal spinal cord and roof plate cells secrete Wnt1 and Wnt3a (Lee and Jessell, 1999; McMahon and Bradley, 1990; Roelink and Nusse, 1991). To investigate whether wnt1 is a candidate to regulate cerebellar olig2+ cell development, we examined its expression using in situ RNA hybridization. At 30 hpf there were two domains of wnt1 expression close to the cerebellum. The first domain included cells along the dorsal midbrain, extending ventrally at the midbrain-hindbrain boundary. The second domain, marked by a relatively low level of wnt1 transcripts, included the dorsal cerebellum (Fig. 5G, H). At 48 hpf expression near the midbrain-hindbrain boundary remained strong whereas wnt1 transcripts were no longer evident in dorsal cerebellum (Fig. 5I, J). Thus, cerebellar wnt1 expression coincides with the critical period for Hh regulation of olig2+ neuron formation.
Wnt signaling is necessary for cerebellar olig2+ cell development
We tested whether Wnt signaling regulates formation of cerebellar neurons by investigating olig2 expression. Lymphoid enhancer 1 (Lef1) mediates nuclear response to Wnt signals and functions as a transcriptional activator in the presence of β-catenin (Clevers and van de Wetering, 1997). The chromosomal deficiency Df(LG01:lef1)x8 deletes approximately 2–8 cM of Linkage Group 1, spanning the lef1 locus (Phillips et al., 2006). In situ RNA hybridization revealed that, in contrast to smo mutants, Df(LG01:lef1)x8 mutant cerebellar cells failed to express olig2 at 48 hpf whereas spinal cord expression was normal (Fig. 6D–F). Because Wnt signaling has an earlier role in forming the midbrain-hindbrain boundary (Bally-Cuif et al., 1995; Kelly and Moon, 1995) and the Df(LG01:lef1)x8 deletion removes additional genes, we used a heat-shock activated transgenic line, hsDkk1GFP, to conditionally express the Wnt inhibitor Dkk1. Dkk1 is a secreted ligand for LRP6, a coreceptor necessary for Wnt signal transduction (Liu et al., 2003; Semenov et al., 2001). LRP6 preferentially binds to Dkk1 in the presence of Wnt, prohibiting it from forming a complex with the Frizzled receptor and preventing pathway activation. We induced expression of Dkk1 using heat shock at 30 hpf and examined olig2 expression at 48 hpf using in situ RNA hybridization. Similar to Df(LG01:lef1)x8 mutant embryos, transgenic heat-shocked embryos expressed olig2 in spinal cord but not cerebellum (Fig. 6J–L). These data indicate Wnt signaling is necessary for cerebellar olig2+ neuron formation.
Fig. 6.
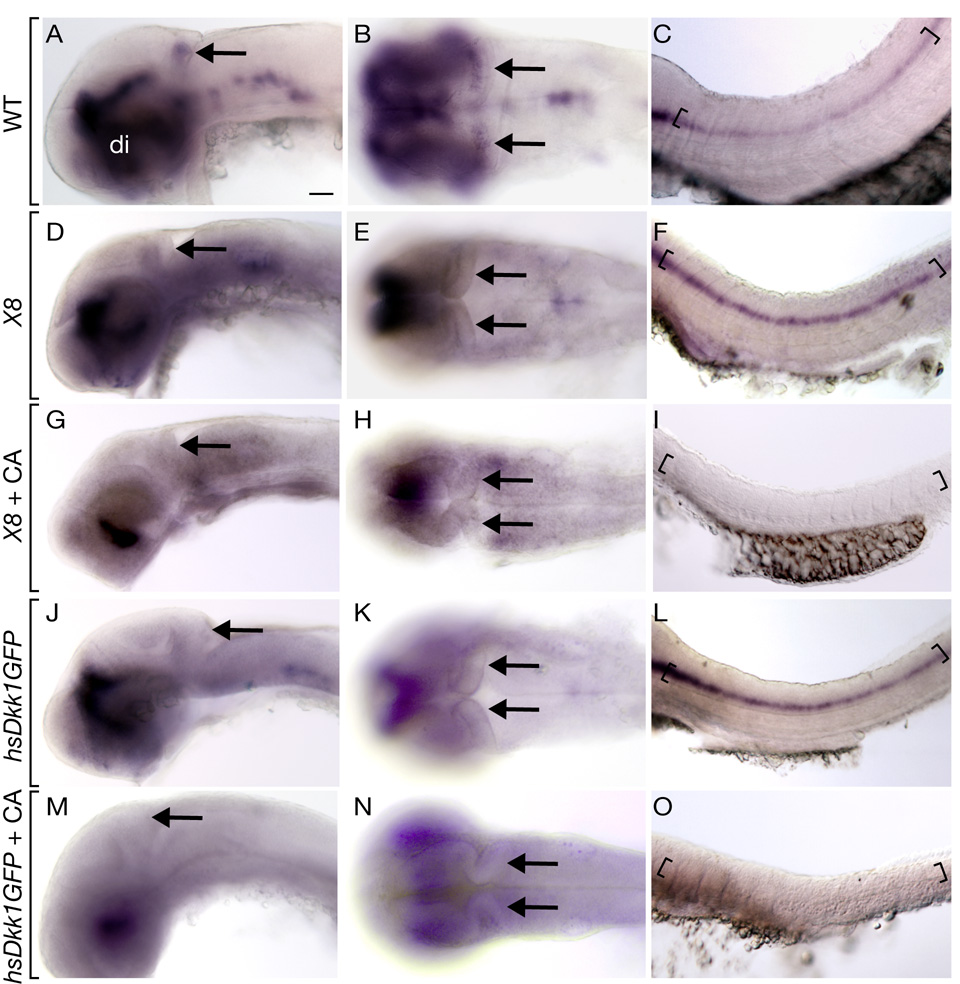
Wnt signaling is necessary for cerebellar olig2 expression. All embryos shown are 48 hpf. Anterior is to the left in all panels, the first column depicts a lateral whole mount view, the second column a dorsal view and the third a lateral view of the spinal cord. Black arrows mark cerebellum, brackets mark ventral spinal cord and ventral diencephalon is labeled (di). (A–C) Wild-type olig2 expression. (D–F) Df(LG01:lef1)x8 (X8) mutant embryos expressed olig2 in spinal cord but not cerebellum. (G–I) Df(LG01:lef1)x8 mutant embryos treated with CA at 6 hpf expressed olig2 in ventral diencephalon but not cerebellum or spinal cord. (J–L) hsDkk1GFP embryos heat shocked at 30 hpf expressed olig2 in ventral diencephalon and spinal cord but not cerebellum. (M–O) hsDkk1GFP embryos treated with CA at 6 hpf expressed olig2 in ventral diencephalon but not spinal cord or cerebellum. Scale bars represent 20 µm in all panels.
Our data raised the possibility that Hh signaling limits the range of Wnt activity, which is necessary for olig2+ neuron formation. Thus, we predicted that the absence of Wnt would be epistatic to loss of Hh signaling. To test this we treated Df(LG01:lef1)x8 mutant embryos with CA at 6 hpf and examined olig2 expression at 48 hpf. As expected, spinal cord cells did not express olig2 in the absence of Hh (Fig. 6I). Notably, cerebellar cells also did not express olig2 (Fig. 6G, H). Similarly, heat shock induction of Dkk1 at 30 hpf entirely blocked formation of olig2+ cells in transgenic embryos treated with CA at 6 hpf (Fig. 6M–O). Expression of atoh1a, which marks the rhombic lip, appeared normal in Df(LG01:lef1)x8 mutant embryos and transgenic embryos in which Dkk1 expression was induced at 30 hpf (Supplementary Fig. 1), indicating that the cerebellar primordium was intact. Thus, absence of olig2+ cells in these embryos was not due to the absence of a cerebellum. We conclude that expansion of olig2+ cell number in the absence of Hh signaling is dependent on Wnt activity, consistent with the idea that Hh limits the range of Wnt signals in the cerebellum.
Shh could limit Wnt signaling by restricting production of ligand or blocking cell response to ligand. To investigate these possibilities we first examined wnt1 expression by in situ RNA hybridization. As shown above, at 48 hpf, wnt1 is normally expressed at the midbrain-hindbrain boundary and seems to be restricted to a small number of cells (Fig 7A–D). By contrast, in the CA treated embryos, wnt1 expression was expanded both posteriorly and ventrally at the midbrain-hindbrain boundary (Fig. 7E–H). Additionally, whereas overexpression of Dkk did not affect wnt1 RNA expression (Fig. 7I, J), the wnt1 expression domain was expanded in embryos treated with CA and overexpressing Dkk (Fig. 7K, L). These data suggest that Hh activity limits the range of Wnt signaling by limiting the number of cells that express wnt1 RNA.
Fig. 7.
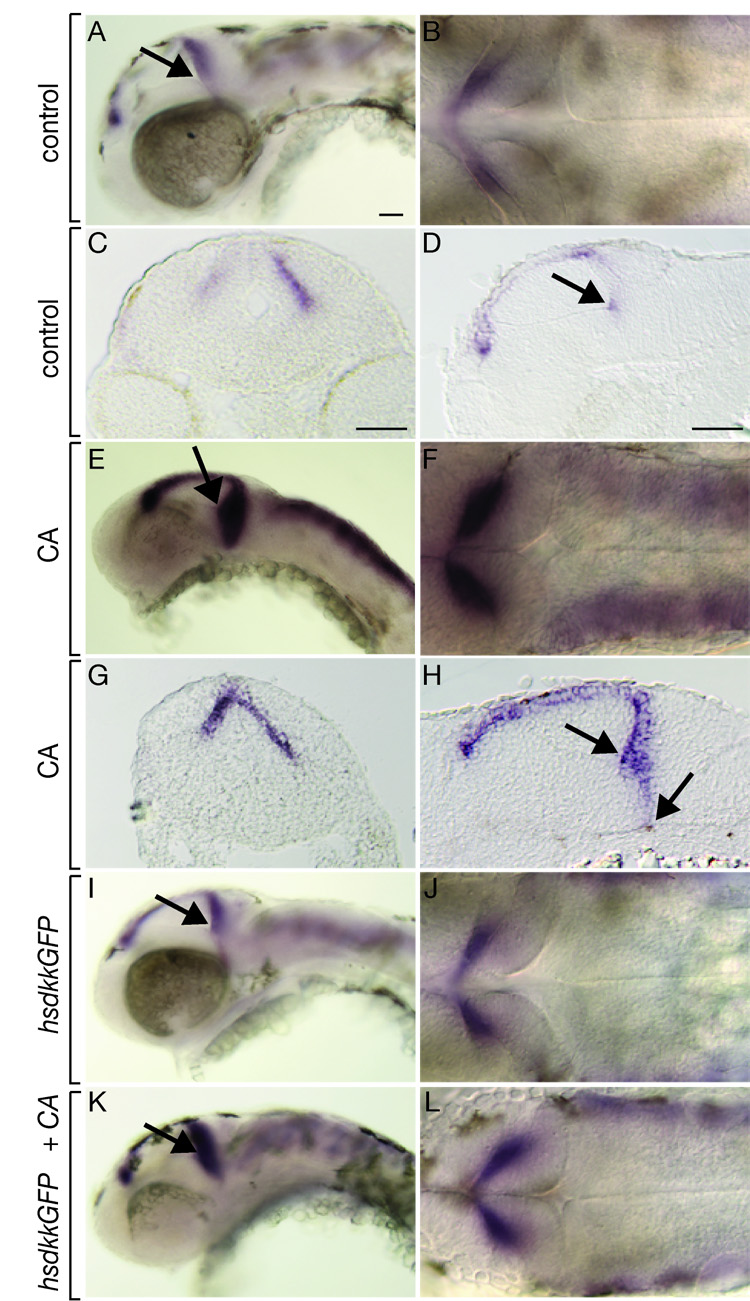
Inhibition of Hh signaling causes expansion of the wnt1 expression domain. All embryos shown are 48 hpf. Black arrows in whole mount views depict the morphological line of the midbrain adjoining the midbrain-hindbrain boundary. Lateral whole mount (A), dorsal whole mount (B), transverse section (C) and sagital section (D) showing wnt1 expression in control embryos. The black arrows mark the base of the 3rd ventricle, with which the ventral extent of wnt1 expression coincides in the midbrain-hindbrain region. (E–H) Similar views of wnt1 expression in embryos treated with CA beginning at 6 hpf. wnt1 expression in the midbrain-hindbrain region is expanded both ventrally and posteriorly. (I, J) Expression of wnt1 in embryos that overexpressed Dkk1 at 30 hpf was similar to controls. (K, L) wnt1 expression was expanded in embryos treated with CA at 6 hpf and heat shocked to induce Dkk1 expression at 30 hpf. Scale bars represent 20 µm in all panels.
We also tested the effect of Wnt signaling on the range of Hh activity by examining ptc1 expression. Whereas ptc1 expression was not evident in the cerebellum of wild-type embryos (Supplementary Fig. 2A, B), ptc1 expression appeared to be expanded into the cerebellum of Df(LG01:lef1)x8 mutant embryos (Supplementary Fig. 2C, D). In contrast, ptc1 expression was not evident in the cerebellum of 48 hpf transgenic embryos in which Dkk was induced at 30 hpf (Supplementary Fig. 2E, F). Taken together, these data raise the possibility that, prior to 30 hpf, Wnt signaling limits the range of Hh activity in the cerebellum and is later required for formation of olig2+ neurons.
Discussion
olig2 expression marks a subset of cerebellar neurons
Although zebrafish have become an increasingly important model for investigating neural development, the composition and organization of the zebrafish cerebellum remains poorly described. Consequently, understanding of the mechanisms that pattern the zebrafish cerebellum and regulate specification of cerebellar cell fate remains incomplete. We noted that cerebellar cells of zebrafish embryos prominently express olig2 RNA and EGFP driven by olig2 regulatory sequences. EGFP+ cells of transgenic animals extend axons to the deep brainstem and form extensive dendritic arbors. Olig2 genes, which are conserved among mammals, birds and fish, encode bHLH transcription factors necessary for motor neuron and oligodendrocyte development (Lu et al., 2002; Park et al., 2002; Zhou and Anderson, 2002) but have not yet been implicated in cerebellum development. Our data reveal olig2 expression as a new marker of developing cerebellar cells in zebrafish and raise the possibility that olig2 promotes specification or differentiation of some cerebellar neurons.
The long axons and highly branched dendrites of olig2+ cerebellar cells are characteristic of eurydendroid neurons. However, olig2+ neurons do not express the canonical markers of eurydendroid neurons nor of Purkinje neurons. During early larval stages cells that express Zebrin II, which marks Purkinje neurons, were mostly located just dorsal to olig2+ cells whereas Calretinin+ eurydendroid neurons, which occupy the granule layer of teleosts (Castro et al., 2006; Diaz-Regueira and Anadon, 2000), were located just ventral to olig2+ cells. At later larval stages Zebrin II+, Calretinin+ and olig2+ cells remained as separate populations, although many Zebrin II+ and olig2+ cells were intermixed. Interestingly, subdivision of eurydendroid neurons into Calretinin+ olig2− and Calretinin− olig2+ cells might reflect morphological differences between eurydendroid neurons. Goldfish have at least three types of eurydendroid neurons that can be distinguished by the shapes of their soma and dendrite number: fusiform and polygonal cells, which are distributed throughout the molecular, Purkinje and granule layers, and monopolar cells, which have single dendrites and are mostly associated with the Purkinje layer of the ventrocaudal corpus cerebelli (Ikenaga et al., 2005). The soma of olig2+ cells are rounded, and each appears to extend a single, extensively branched dendrite into the molecular layer. This raises the possibility that olig2 expression marks monopolar eurydendroid neurons, although definitive molecular marker evidence is still required.
Hh signaling and cerebellar patterning
Hh proteins, secreted by ventral neural tube cells and underlying notochord, function as morphogens to pattern the DV axis of the CNS (Ingham and McMahon, 2001; Jessell, 2000). This is best documented in spinal cord, where different concentrations of Shh specify distinct types of neurons that occupy different DV positions. Loss of Shh function results in loss of ventral spinal cord identity and expansion of dorsal identity (Chiang et al., 1996). Similarly, Shh is necessary for formation of dopaminergic and serotonergic neurons in the ventral midbrain and anterior hindbrain (Ye et al., 1998), indicating that its role in DV patterning extends along the entire length of the neural tube.
Hh signaling has a well established role in promoting granule neuron precursor proliferation in mice (Dahmane and Ruiz i Altaba., 1999; Corrales et al., 2004; Lewis et al., 2004) but whether it also influences formation of other cerebellar cells is less clear. Calbindin+ Purkinje neurons were present in mice in which Shh or Gli2 were conditionally inactivated in the cerebellar primordium (Blaess et al., 2006, Lewis et al., 2004; Corrales et al., 2004). However, the distribution of Purkinje neurons was somewhat altered and they occupied slightly broader layers in mutant animals compared to wild type, reminiscent of the broadened domain of olig2+ cells we observed in zebrafish embryos deficient for Hh signaling. However, Shh conditional mutants had progressively fewer Purkinje neurons than wild-type mice when compared from E18.5 into adulthood (Lewis et al., 2004). The progressive decrease in cell number suggests that Purkinje neurons were lost due to lack of trophic support by the diminished granule cell population of these mice, leaving the possible role of Hh in the initial formation of Purkinje neurons an open question.
Our data raise the possibility that in zebrafish Hh signaling regulates DV pattern of the cerebellum. We found that smo mutant embryos had morphologically distinct cerebellums and that the olig2 expression domain appeared to be broader in the anteroposterior axis and to extend more ventrally. Quantification of olig2+ cells using a transgenic reporter revealed a two-fold excess relative to wild type and we found no evidence of changes in the number of apoptotic cells. Pharmacological inhibition of Hh signaling using cyclopamine produced similar effects and also revealed that Hh is required as late as 33 hpf, well after formation of the cerebellar anlage, to limit the number of olig2+ cells. Although we were unable to investigate formation of Calretinin+ eurydendroid cells and Purkinje neurons, because mutant and cyclopamine-treated larvae die before expression of Calretinin and Zebrin II, the ventral expansion of olig2 expression is strongly consistent with a role for DV pattern formation in the cerebellum by Hh signaling.
Wnt signaling is necessary for cerebellar olig2+ neuron development
Similar to ventral neural tube, patterning of dorsal neural tube also depends on secreted factors (Lee and Jessell, 1999; Liem et al., 1995). In particular, Wnt1 and Wnt3a are expressed throughout nearly the entire AP extent of the dorsal CNS (Parr et al., 1993). Mouse Wnt1 mutants had greatly reduced or nearly absent cerebellums (Bally-Cuif et al., 1995; Thomas and Capecchi, 1990), precluding investigation of cerebellar DV patterning, but Wnt1/Wnt3a double mutants had a deficit of dorsal spinal cord interneurons (Ikeya et al., 1997; Muroyama et al., 2002). Zebrafish wnt1 and wnt3l are expressed prominently in the midbrain at the boundary with hindbrain (Buckles et al., 2004), similar to mouse Wnt1 and Wnt3. Additionally, we detected a lower level of wnt1 transcripts in dorsal cerebellum at 30 hpf but not 48 hpf, which temporally coincides with Hh-dependent patterning of olig2+ cells. Notably, the midbrain-hindbrain boundary appeared present in embryos homozygous for a chromosomal deletion spanning lef1, which encodes a transcription factor that mediates Wnt signaling. This is a milder phenotype than that produced by Wnt1 mutation in mice or simultaneous disruption of wnt1, wnt3l and wnt10b functions in zebrafish (Buckles et al., 2004). olig2 expression was entirely absent from the cerebellums of lef1 deficient embryos, suggesting that Wnt signals are required for olig2+ neuron development. To test this further without the complications of eliminating multiple genes within the chromosomal deficiency or disruption of an early developmental role of Wnt signaling in forming the cerebellar anlage, we induced expression of Dkk1, a Wnt inhibitor, at 30 hpf. Similar to lef1 deficient embryos, Dkk1 expression blocked olig2 expression within cerebellum but not in ventral diencephelon or spinal cord. Thus, our data provide evidence that Wnt signaling is necessary for specification of olig2+ neurons in cerebellum.
The complementary effects of loss of Hh and Wnt signaling on olig2 expression suggested that they act in opposition to regulate the number and distribution of olig2+ cells. Consistent with this, wnt1 expression was expanded ventrally and posteriorly in CA-treated embryos. Notably, Wnt1 expression was also expanded in the midbrain-hindbrain region of mice in which Smo was conditionally inactivated (Blaess et al., 2006). We also found that ptc1 expression, which serves as an indicator of Hh signaling activity, was expanded dorsally in lef1 deficient embryos. Finally, embryos deficient for both Hh and Wnt signaling were identical to embryos that lacked only Wnt signaling in that neither had cerebellar olig2 expression. We propose that Hh activity limits olig2+ cell formation by restricting the ventral extent of Wnt signaling, which is necessary for olig2+ cell specification.
Pattern formation via antagonistic signaling between the Hh and Wnt pathways is an established development mechanism. For example, in the ventral spinal cord Wnt inhibitors regulate transcription of Hh-responsive genes (Lei et al., 2006) whereas in dorsal spinal cord Gli3 repressor inhibits Wnt signaling (Ulloa et al., 2007). Within the epithelium of the colon, high levels of Wnt signaling are restricted to the base of the proliferative crypt by Indian Hedgehog (Ihh), expressed by mature colonocytes, and Ihh reciprocally inhibits expression of Wnt target genes (van den Brink et al., 2004). Our data indicate that antagonistic Hh and Wnt signaling also pattern the DV axis of the zebrafish cerebellum.
Supplementary Material
Supplementary. Fig. 1. atoh1a expression reveals cerebellum formation. All embryos shown are 48 hpf. Anterior is to the left in all panels, the first column depicts a lateral whole mount view, the second column a dorsal view. Black arrows point to the cerebellum. (A, B) Wild-type control embryos. Black dashed line indicates the width of the cerebellum (C, D) Embryos treated with CA at 6 hpf. From a dorsal view, the cerebellum appears thicker than in control embryos. Expression of atoh1a appears normal in transgenic embryos heat shocked to induce expression of Dkk1 at 30 hpf (E, F) and Df(LG01:lef1)x8 mutant embryos (G, H). Scale bars represent 20 µm in all panels.
Supplementary Fig. 2. Effects of Wnt signaling on ptc1 expression. All embryos shown are 48 hpf. The first column are whole mount views with anterior to the left and the second column shows transverse sections through the cerebellum. (A, B) ptc1 expression is not evident within the cerebellum of wild-type embryos. (C, D) Df(LG01:lef1)x8 mutants show an expansion of ptc1 expression into the dorsal regions of the cerebellum. (E, F) ptc1 expression is not evident in the cerebellum of transgenic embryos heat shocked to induce Dkk1 at 30 hpf. Scale bars represent 20 µm in all panels.
Acknowledgements
We thank Richard Hawkes for Zebrin II antibody and advice and Randall Moon for use of Tg(HSP70:dkk1) embryos. This work was supported by a Vanderbilt University Discovery Grant, a zebrafish initiative funded by the Vanderbilt University Academic Venture Capital Fund and NIH grant NS04668 (B.A).
Footnotes
Publisher's Disclaimer: This is a PDF file of an unedited manuscript that has been accepted for publication. As a service to our customers we are providing this early version of the manuscript. The manuscript will undergo copyediting, typesetting, and review of the resulting proof before it is published in its final citable form. Please note that during the production process errors may be discovered which could affect the content, and all legal disclaimers that apply to the journal pertain.
References
- Alcedo J, Ayzenzon M, Von Ohlen T, Noll M, Hooper JE. The Drosophila smoothened gene encodes a seven-pass membrane protein, a putative receptor for the hedgehog signal. Cell. 1996;86:221–232. doi: 10.1016/s0092-8674(00)80094-x. [DOI] [PubMed] [Google Scholar]
- Altman J, Bayer SA. Prenatal development of the cerebellar system in the rat. I. Cytogenesis and histogenesis of the deep nuclei and the cortex of the cerebellum. J Comp Neurol. 1978;179:23–48. doi: 10.1002/cne.901790104. [DOI] [PubMed] [Google Scholar]
- Altman J, Bayer SA. Embryonic development of the rat cerebellum. III. Regional differences in the time of origin, migration, and settling of Purkinje cells. J Comp Neurol. 1985;231:42–65. doi: 10.1002/cne.902310105. [DOI] [PubMed] [Google Scholar]
- Bally-Cuif L, Cholley B, Wassef M. Involvement of Wnt-1 in the formation of the mes/metencephalic boundary. Mech Dev. 1995;53:23–34. doi: 10.1016/0925-4773(95)00421-1. [DOI] [PubMed] [Google Scholar]
- Barresi MJ, Stickney HL, Devoto SH. The zebrafish slow-muscle-omitted gene product is required for Hedgehog signal transduction and the development of slow muscle identity. Development. 2000;127:2189–2199. doi: 10.1242/dev.127.10.2189. [DOI] [PubMed] [Google Scholar]
- Brochu G, Maler L, Hawkes R. Zebrin II: a polypeptide antigen expressed selectively by Purkinje cells reveals compartments in rat and fish cerebellum. J Comp Neurol. 1990;291:538–552. doi: 10.1002/cne.902910405. [DOI] [PubMed] [Google Scholar]
- Buckles GR, Thorpe CJ, Ramel MC, Lekven AC. Combinatorial Wnt control of zebrafish midbrain-hindbrain boundary formation. Mech Dev. 2004;121:437–447. doi: 10.1016/j.mod.2004.03.026. [DOI] [PubMed] [Google Scholar]
- Castro A, Becerra M, Manso MJ, Anadon R. Calretinin immunoreactivity in the brain of the zebrafish, Danio rerio: distribution and comparison with some neuropeptides and neurotransmitter-synthesizing enzymes. I. Olfactory organ and forebrain. J Comp Neurol. 2006;494:435–459. doi: 10.1002/cne.20782. [DOI] [PubMed] [Google Scholar]
- Chen JK, Taipale J, Cooper MK, Beachy PA. Inhibition of Hedgehog signaling by direct binding of cyclopamine to Smoothened. Genes Dev. 2002;16:2743–2748. doi: 10.1101/gad.1025302. [DOI] [PMC free article] [PubMed] [Google Scholar]
- Chen W, Burgess S, Hopkins N. Analysis of the zebrafish smoothened mutant reveals conserved and divergent functions of hedgehog activity. Development. 2001;128:2385–2396. doi: 10.1242/dev.128.12.2385. [DOI] [PubMed] [Google Scholar]
- Chiang C, Litingtung Y, Lee E, Young KE, Corden JL, Westphal H, Beachy PA. Cyclopia and defective axial patterning in mice lacking Sonic hedgehog gene function. Nature. 1996;383:407–413. doi: 10.1038/383407a0. [DOI] [PubMed] [Google Scholar]
- Clevers H, van de Wetering M. TCF/LEF factor earn their wings. Trends Genet. 1997;13:485–489. doi: 10.1016/s0168-9525(97)01305-x. [DOI] [PubMed] [Google Scholar]
- Concordet JP, Lewis KE, Moore JW, Goodrich LV, Johnson RL, Scott MP, Ingham PW. Spatial regulation of a zebrafish patched homologue reflects the roles of sonic hedgehog and protein kinase A in neural tube and somite patterning. Development. 1996;122:2835–2846. doi: 10.1242/dev.122.9.2835. [DOI] [PubMed] [Google Scholar]
- Currie PD, Ingham PW. Induction of a specific muscle cell type by a hedgehog-like protein in zebrafish. Nature. 1996;382:452–455. doi: 10.1038/382452a0. [DOI] [PubMed] [Google Scholar]
- Dahmane N, Ruiz i Altaba A. Sonic hedgehog regulates the growth and patterning of the cerebellum. Development. 1999;126:3089–3100. doi: 10.1242/dev.126.14.3089. [DOI] [PubMed] [Google Scholar]
- de Zeeuw CI, Berrebi AS. Individual Purkinje cell axons terminate on both inhibitory and excitatory neurons in the cerebellar and vestibular nuclei. Ann N Y Acad Sci. 1996;781:607–610. doi: 10.1111/j.1749-6632.1996.tb15736.x. [DOI] [PubMed] [Google Scholar]
- Diaz-Regueira S, Anadon R. Calretinin expression in specific neuronal systems in the brain of an advanced teleost, the grey mullet (Chelon labrosus) J Comp Neurol. 2000;426:81–105. doi: 10.1002/1096-9861(20001009)426:1<81::aid-cne6>3.0.co;2-e. [DOI] [PubMed] [Google Scholar]
- Ekker SC, Ungar AR, Greenstein P, von Kessler DP, Porter JA, Moon RT, Beachy PA. Patterning activities of vertebrate hedgehog proteins in the developing eye and brain. Curr Biol. 1995;5:944–955. doi: 10.1016/s0960-9822(95)00185-0. [DOI] [PubMed] [Google Scholar]
- Fiez JA. Cerebellar contributions to cognition. Neuron. 1996;16:13–15. doi: 10.1016/s0896-6273(00)80018-5. [DOI] [PubMed] [Google Scholar]
- Finger TE. Efferent neurons of the teleost cerebellum. Brain Res. 1978;153:608–614. doi: 10.1016/0006-8993(78)90346-3. [DOI] [PubMed] [Google Scholar]
- Gilthorpe JD, Papantoniou EK, Chedotal A, Lumsden A, Wingate RJ. The migration of cerebellar rhombic lip derivatives. Development. 2002;129:4719–4728. doi: 10.1242/dev.129.20.4719. [DOI] [PubMed] [Google Scholar]
- Hauptmann G, Gerster T. Multicolor whole-mount in situ hybridization. Methods Mol Biol. 2000;137:139–148. doi: 10.1385/1-59259-066-7:139. [DOI] [PubMed] [Google Scholar]
- Holmes G. The Cerebellum of Man. Brain. 1939;62:30. [Google Scholar]
- Huangfu D, Anderson KV. Signaling from Smo to Ci/Gli: conservation and divergence of Hedgehog pathways from Drosophila to vertebrates. Development. 2006;133:3–14. doi: 10.1242/dev.02169. [DOI] [PubMed] [Google Scholar]
- Ikenaga T, Yoshida M, Uematsu K. Morphology and immunohistochemistry of efferent neurons of the goldfish corpus cerebelli. J Comp Neurol. 2005;487:300–311. doi: 10.1002/cne.20553. [DOI] [PubMed] [Google Scholar]
- Ikenaga T, Yoshida M, Uematsu K. Cerebellar efferent neurons in teleost fish. Cerebellum. 2006;5:268–274. doi: 10.1080/14734220600930588. [DOI] [PubMed] [Google Scholar]
- Ikeya M, Lee SM, Johnson JE, McMahon AP, Takada S. Wnt signalling required for expansion of neural crest and CNS progenitors. Nature. 1997;389:966–970. doi: 10.1038/40146. [DOI] [PubMed] [Google Scholar]
- Ingham PW, McMahon AP. Hedgehog signaling in animal development: paradigms and principles. Genes Dev. 2001;15:3059–3087. doi: 10.1101/gad.938601. [DOI] [PubMed] [Google Scholar]
- Ito M. Mechanisms of motor learning in the cerebellum. Brain Res. 2000;886:237–245. doi: 10.1016/s0006-8993(00)03142-5. [DOI] [PubMed] [Google Scholar]
- Jessell TM. Neuronal specification in the spinal cord: inductive signals and transcriptional codes. Nat Rev Genet. 2000;1:20–29. doi: 10.1038/35049541. [DOI] [PubMed] [Google Scholar]
- Karlstrom RO, Tyurina OV, Kawakami A, Nishioka N, Talbot WS, Sasaki H, Schier AF. Genetic analysis of zebrafish gli1 and gli2 reveals divergent requirements for gli genes in vertebrate development. Development. 2003;130:1549–1564. doi: 10.1242/dev.00364. [DOI] [PubMed] [Google Scholar]
- Kelly GM, Moon RT. Involvement of wnt1 and pax2 in the formation of the midbrain-hindbrain boundary in the zebrafish gastrula. Dev Genet. 1995;17:129–140. doi: 10.1002/dvg.1020170205. [DOI] [PubMed] [Google Scholar]
- Kimmel CB, Ballard WW, Kimmel SR, Ullmann B, Schilling TF. Stages of embryonic development of the zebrafish. Dev Dyn. 1995;203:253–310. doi: 10.1002/aja.1002030302. [DOI] [PubMed] [Google Scholar]
- Krauss S, Concordet JP, Ingham PW. A functionally conserved homolog of the Drosophila segment polarity gene hh is expressed in tissues with polarizing activity in zebrafish embryos. Cell. 1993;75:1431–1444. doi: 10.1016/0092-8674(93)90628-4. [DOI] [PubMed] [Google Scholar]
- Lannoo MJ, Brochu G, Maler L, Hawkes R. Zebrin II immunoreactivity in the rat and in the weakly electric teleost Eigenmannia (gymnotiformes) reveals three modes of Purkinje cell development. J Comp Neurol. 1991a;310:215–233. doi: 10.1002/cne.903100207. [DOI] [PubMed] [Google Scholar]
- Lannoo MJ, Ross L, Maler L, Hawkes R. Development of the cerebellum and its extracerebellar Purkinje cell projection in teleost fishes as determined by zebrin II immunocytochemistry. Prog Neurobiol. 1991b;37:329–363. doi: 10.1016/0301-0082(91)90022-s. [DOI] [PubMed] [Google Scholar]
- Lee J, Platt KA, Censullo P, Ruiz i Altaba A. Gli1 is a target of Sonic hedgehog that induces ventral neural tube development. Development. 1997;124:2537–2552. doi: 10.1242/dev.124.13.2537. [DOI] [PubMed] [Google Scholar]
- Lee KJ, Jessell TM. The specification of dorsal cell fates in the vertebrate central nervous system. Annu Rev Neurosci. 1999;22:261–294. doi: 10.1146/annurev.neuro.22.1.261. [DOI] [PubMed] [Google Scholar]
- Lei Q, Jeong Y, Misra K, Li S, Zelman AK, Epstein DJ, Matise MP. Wnt signaling inhibitors regulate the transcriptional response to morphogenetic Shh-Gli signaling in the neural tube. Dev Cell. 2006;11:325–337. doi: 10.1016/j.devcel.2006.06.013. [DOI] [PubMed] [Google Scholar]
- Lewis KE, Eisen JS. Hedgehog signaling is required for primary motoneuron induction in zebrafish. Development. 2001;128:3485–3495. doi: 10.1242/dev.128.18.3485. [DOI] [PubMed] [Google Scholar]
- Liem KF, Jr, Tremml G, Roelink H, Jessell TM. Dorsal differentiation of neural plate cells induced by BMP-mediated signals from epidermal ectoderm. Cell. 1995;82:969–979. doi: 10.1016/0092-8674(95)90276-7. [DOI] [PubMed] [Google Scholar]
- Lin JC, Cepko CL. Biphasic dispersion of clones containing Purkinje cells and glia in the developing chick cerebellum. Dev Biol. 1999;211:177–197. doi: 10.1006/dbio.1999.9316. [DOI] [PubMed] [Google Scholar]
- Liu G, Bafico A, Harris VK, Aaronson SA. A novel mechanism for Wnt activation of canonical signaling through the LRP6 receptor. Mol Cell Biol. 2003;23:5825–5835. doi: 10.1128/MCB.23.16.5825-5835.2003. [DOI] [PMC free article] [PubMed] [Google Scholar]
- Lu QR, Sun T, Zhu Z, Ma N, Garcia M, Stiles CD, Rowitch DH. Common developmental requirement for Olig function indicates a motor neuron/oligodendrocyte connection. Cell. 2002;109:75–86. doi: 10.1016/s0092-8674(02)00678-5. [DOI] [PubMed] [Google Scholar]
- Lu QR, Yuk D, Alberta JA, Zhu Z, Pawlitzky I, Chan J, McMahon AP, Stiles CD, Rowitch DH. Sonic hedgehog--regulated oligodendrocyte lineage genes encoding bHLH proteins in the mammalian central nervous system. Neuron. 2000;25:317–329. doi: 10.1016/s0896-6273(00)80897-1. [DOI] [PubMed] [Google Scholar]
- Marigo V, Tabin CJ. Regulation of patched by sonic hedgehog in the developing neural tube. Proc Natl Acad Sci U S A. 1996;93:9346–9351. doi: 10.1073/pnas.93.18.9346. [DOI] [PMC free article] [PubMed] [Google Scholar]
- Marusich MF, Furneaux HM, Henion PD, Weston JA. Hu neuronal proteins are expressed in proliferating neurogenic cells. J Neurobiol. 1994;25:143–155. doi: 10.1002/neu.480250206. [DOI] [PubMed] [Google Scholar]
- Mathis L, Bonnerot C, Puelles L, Nicolas JF. Retrospective clonal analysis of the cerebellum using genetic laacZ/lacZ mouse mosaics. Development. 1997;124:4089–4104. doi: 10.1242/dev.124.20.4089. [DOI] [PubMed] [Google Scholar]
- McMahon AP, Bradley A. The Wnt-1 (int-1) proto-oncogene is required for development of a large region of the mouse brain. Cell. 1990;62:1073–1085. doi: 10.1016/0092-8674(90)90385-r. [DOI] [PubMed] [Google Scholar]
- Meek J, Hafmans TG, Maler L, Hawkes R. Distribution of zebrin II in the gigantocerebellum of the mormyrid fish Gnathonemus petersii compared with other teleosts. J Comp Neurol. 1992;316:17–31. doi: 10.1002/cne.903160103. [DOI] [PubMed] [Google Scholar]
- Molven A, Njolstad PR, Fjose A. Genomic structure and restricted neural expression of the zebrafish wnt-1 (int-1) gene. Embo J. 1991;10:799–807. doi: 10.1002/j.1460-2075.1991.tb08012.x. [DOI] [PMC free article] [PubMed] [Google Scholar]
- Morton SM, Bastian AJ. Cerebellar control of balance and locomotion. Neuroscientist. 2004;10:247–259. doi: 10.1177/1073858404263517. [DOI] [PubMed] [Google Scholar]
- Mueller T, Vernier P, Wullimann MF. A phylotypic stage in vertebrate brain development: GABA cell patterns in zebrafish compared with mouse. J Comp Neurol. 2006;494:620–634. doi: 10.1002/cne.20824. [DOI] [PubMed] [Google Scholar]
- Mueller T, Wullimann MF. Anatomy of neurogenesis in the early zebrafish brain. Brain Res Dev Brain Res. 2003;140:137–155. doi: 10.1016/s0165-3806(02)00583-7. [DOI] [PubMed] [Google Scholar]
- Muroyama Y, Fujihara M, Ikeya M, Kondoh H, Takada S. Wnt signaling plays an essential role in neuronal specification of the dorsal spinal cord. Genes Dev. 2002;16:548–553. doi: 10.1101/gad.937102. [DOI] [PMC free article] [PubMed] [Google Scholar]
- Park HC, Mehta A, Richardson JS, Appel B. olig2 is required for zebrafish primary motor neuron and oligodendrocyte development. Dev Biol. 2002;248:356–368. doi: 10.1006/dbio.2002.0738. [DOI] [PubMed] [Google Scholar]
- Park HC, Shin J, Appel B. Spatial and temporal regulation of ventral spinal cord precursor specification by Hedgehog signaling. Development. 2004;131:5959–5969. doi: 10.1242/dev.01456. [DOI] [PubMed] [Google Scholar]
- Parr BA, Shea MJ, Vassileva G, McMahon AP. Mouse Wnt genes exhibit discrete domains of expression in the early embryonic CNS and limb buds. Development. 1993;119:247–261. doi: 10.1242/dev.119.1.247. [DOI] [PubMed] [Google Scholar]
- Phillips BT, Kwon HJ, Melton C, Houghtaling P, Fritz A, Riley BB. Zebrafish msxB, msxC and msxE function together to refine the neural-nonneural border and regulate cranial placodes and neural crest development. Dev Biol. 2006;294:376–390. doi: 10.1016/j.ydbio.2006.03.001. [DOI] [PubMed] [Google Scholar]
- Porteros A, Arevalo R, Brinon JG, Crespo C, Aijon J, Alonso JR. Parvalbumin immunoreactivity during the development of the cerebellum of the rainbow trout. Brain Res Dev Brain Res. 1998;109:221–227. doi: 10.1016/s0165-3806(98)00085-6. [DOI] [PubMed] [Google Scholar]
- Raymond JL, Lisberger SG, Mauk MD. The cerebellum: a neuronal learning machine? Science. 1996;272:1126–1131. doi: 10.1126/science.272.5265.1126. [DOI] [PubMed] [Google Scholar]
- Roelink H, Nusse R. Expression of two members of the Wnt family during mouse development--restricted temporal and spatial patterns in the developing neural tube. Genes Dev. 1991;5:381–388. doi: 10.1101/gad.5.3.381. [DOI] [PubMed] [Google Scholar]
- Schutter DJ, van Honk J. The cerebellum on the rise in human emotion. Cerebellum. 2005;4:290–294. doi: 10.1080/14734220500348584. [DOI] [PubMed] [Google Scholar]
- Schwaller B, Buchwald P, Blumcke I, Celio MR, Hunziker W. Characterization of a polyclonal antiserum against the purified human recombinant calcium binding protein calretinin. Cell Calcium. 1993;14:639–648. doi: 10.1016/0143-4160(93)90089-o. [DOI] [PubMed] [Google Scholar]
- Semenov MV, Tamai K, Brott BK, Kuhl M, Sokol S, He X. Head inducer Dickkopf-1 is a ligand for Wnt coreceptor LRP6. Curr Biol. 2001;11:951–961. doi: 10.1016/s0960-9822(01)00290-1. [DOI] [PubMed] [Google Scholar]
- Shin J, Park HC, Topczewska JM, Mawdsley DJ, Appel B. Neural cell fate analysis in zebrafish using olig2 BAC transgenics. Methods Cell Sci. 2003;25:7–14. doi: 10.1023/B:MICS.0000006847.09037.3a. [DOI] [PubMed] [Google Scholar]
- Stoick-Cooper CL, Weidinger G, Riehle KJ, Hubbert C, Major MB, Fausto N, Moon RT. Distinct Wnt signaling pathways have opposing roles in appendage regeneration. Development. 2007;134:479–489. doi: 10.1242/dev.001123. [DOI] [PubMed] [Google Scholar]
- Thach WT, Goodkin HP, Keating JG. The cerebellum and the adaptive coordination of movement. Annu Rev Neurosci. 1992;15:403–442. doi: 10.1146/annurev.ne.15.030192.002155. [DOI] [PubMed] [Google Scholar]
- Thomas KR, Capecchi MR. Targeted disruption of the murine int-1 proto-oncogene resulting in severe abnormalities in midbrain and cerebellar development. Nature. 1990;346:847–850. doi: 10.1038/346847a0. [DOI] [PubMed] [Google Scholar]
- Traiffort E, Charytoniuk DA, Faure H, Ruat M. Regional distribution of Sonic Hedgehog, patched, and smoothened mRNA in the adult rat brain. J Neurochem. 1998;70:1327–1330. doi: 10.1046/j.1471-4159.1998.70031327.x. [DOI] [PubMed] [Google Scholar]
- Ulloa F, Itasaki N, Briscoe J. Inhibitory Gli3 activity negatively regulates Wnt/beta-catenin signaling. Curr Biol. 2007;17:545–550. doi: 10.1016/j.cub.2007.01.062. [DOI] [PubMed] [Google Scholar]
- van den Brink GR, Bleuming SA, Hardwick JC, Schepman BL, Offerhaus GJ, Keller JJ, Nielsen C, Gaffield W, van Deventer SJ, Roberts DJ, Peppelenbosch MP. Indian Hedgehog is an antagonist of Wnt signaling in colonic epithelial cell differentiation. Nat Genet. 2004;36:277–282. doi: 10.1038/ng1304. [DOI] [PubMed] [Google Scholar]
- Varga ZM, Amores A, Lewis KE, Yan YL, Postlethwait JH, Eisen JS, Westerfield M. Zebrafish smoothened functions in ventral neural tube specification and axon tract formation. Development. 2001;128:3497–3509. doi: 10.1242/dev.128.18.3497. [DOI] [PubMed] [Google Scholar]
- Wang VY, Zoghbi HY. Genetic regulation of cerebellar development. Nat Rev Neurosci. 2001;2:484–491. doi: 10.1038/35081558. [DOI] [PubMed] [Google Scholar]
- Wilson L, Maden M. The mechanisms of dorsoventral patterning in the vertebrate neural tube. Dev Biol. 2005;282:1–13. doi: 10.1016/j.ydbio.2005.02.027. [DOI] [PubMed] [Google Scholar]
- Ye W, Shimamura K, Rubenstein JL, Hynes MA, Rosenthal A. FGF and Shh signals control dopaminergic and serotonergic cell fate in the anterior neural plate. Cell. 1998;93:755–766. doi: 10.1016/s0092-8674(00)81437-3. [DOI] [PubMed] [Google Scholar]
- Zhou Q, Anderson DJ. The bHLH transcription factors OLIG2 and OLIG1 couple neuronal and glial subtype specification. Cell. 2002;109:61–73. doi: 10.1016/s0092-8674(02)00677-3. [DOI] [PubMed] [Google Scholar]
Associated Data
This section collects any data citations, data availability statements, or supplementary materials included in this article.
Supplementary Materials
Supplementary. Fig. 1. atoh1a expression reveals cerebellum formation. All embryos shown are 48 hpf. Anterior is to the left in all panels, the first column depicts a lateral whole mount view, the second column a dorsal view. Black arrows point to the cerebellum. (A, B) Wild-type control embryos. Black dashed line indicates the width of the cerebellum (C, D) Embryos treated with CA at 6 hpf. From a dorsal view, the cerebellum appears thicker than in control embryos. Expression of atoh1a appears normal in transgenic embryos heat shocked to induce expression of Dkk1 at 30 hpf (E, F) and Df(LG01:lef1)x8 mutant embryos (G, H). Scale bars represent 20 µm in all panels.
Supplementary Fig. 2. Effects of Wnt signaling on ptc1 expression. All embryos shown are 48 hpf. The first column are whole mount views with anterior to the left and the second column shows transverse sections through the cerebellum. (A, B) ptc1 expression is not evident within the cerebellum of wild-type embryos. (C, D) Df(LG01:lef1)x8 mutants show an expansion of ptc1 expression into the dorsal regions of the cerebellum. (E, F) ptc1 expression is not evident in the cerebellum of transgenic embryos heat shocked to induce Dkk1 at 30 hpf. Scale bars represent 20 µm in all panels.