

Abstract
The modular nature of repeat proteins has made them a successful target for protein design. Ankyrin repeat, TPR, and leucine rich repeat domains that have been designed solely on consensus information have been shown to have higher thermostability than their biological counterparts. We have previously shown that we can reshape the energy landscape of a repeat protein by adding multiple C-terminal consensus ankyrin repeats to the five N-terminal repeats of the Notch ankyrin domain. Here we explore how the folding mechanism responds to reshaping of the energy landscape. We have used analogous substitutions of a conserved alanine with glycine in each repeat to determine the distribution of structure in the transitions state ensembles of constructs containing one (Nank1-5C1) and two consensus (Nank1-5C2) ankyrin repeats. Whereas folding of the wild-type Notch ankyrin domain is slowed by substitutions in its central repeats,1 folding of Nank1-5C1 and Nank1-5C2 is slowed by substitutions in the C-terminal repeats. Thus, the addition of C-terminal stabilizing repeats shifts the transition state ensemble towards the C-terminal repeats, rerouting the folding pathway of the ankyrin repeat domain. These findings indicate that for the Notch ankyrin domain, folding pathways are selected based on local energetics.
Introduction
The process of protein folding is one of the more remarkable examples of spontaneous self-organization in nature. In most cases, the search for the native structure from a very large ensemble of denatured states occurs on a relatively short timescale. A variety of mechanisms have been proposed to describe how this very large search can be executed so quickly.2-5 Some proposed mechanisms involve specific low energy pathways that restrict the search from the denatured to the native state.2,6,7 In the last two decades, experimental studies have shown that specific pathways are common in the folding of globular proteins, as shown both by the formation of specific structures in transition state ensembles,8-12 and the formation of specific kinetic intermediates during folding.13-18 However, the factors that determine which pathways are followed and their relative importance remain unresolved.
One factor that may specify folding pathways is local stability of structural elements. As the native state is of lowest energy under folding conditions, individual segments of chain are likely to have low energies in their native configurations (both in terms of secondary structures and tertiary contacts), even when much of the chain remains unstructured. Thus, experimentally observed pathway preferences may reflect the most stable elements of structure. However, for globular proteins, it has been notoriously difficult to determine which elements of structure are most stable, which likely results from the highly interconnected structure of the native state.19
Another factor that clearly influences folding kinetics is the degree to which contacts in the native state are local in primary sequence. The influence of sequence-local interactions, a reflection of native state chain “topology” or “contact order”, in accelerating folding has been developed into several models for protein folding,20,21 and has been invoked as a major factor behind the successful prediction of folding pathways in globular proteins by simple funneled Go-models,22 in which all native contacts are treated as uniformly favorable.23-25 The success of Go-models in predicting the folding pathways of several proteins without energetic bias for specific contacts calls into question the importance of local stability in determining folding pathways, although a few recent simulations have indicated that folding is influenced by essential energetic components not accounted for by overall topological features.24,26,27
In comparison to globular proteins, the structures of repeat proteins are highly conducive to testing for the existence of preferred pathways, and for determining how such pathways are specified. Repeat proteins are constructed of a linear array of structural elements, giving rise a regular topology lacking contacts that are distant in primary sequence. The large (and open-ended) size of repeat proteins, along with high structural similarity from repeat to repeat, might be expected to result in multiple distributed folding pathways. Folding of repeat proteins through multiple parallel pathways is especially likely if folding is guided by topology rather than local stability. In contrast, folding of repeat-proteins by specific pathways would highlight the importance of additional factors in pathway selection. The relationship between pathways selection and local stability can be experimentally determined by taking advantage of the modular architecture and structural redundancy of repeat proteins to map the folding energies of different fragments at single-repeat resolution.28
Previous studies on the folding pathway of several ankyrin repeat proteins suggest a limited number of pathways during folding.1,29,30 For the ankyrin domain from the Drosophila Notch receptor, the subject of this study, folding appears to proceed through a short-lived on-pathway kinetic intermediate.31,32 Φ-value analysis demonstrates that folding of this intermediate is limited by structure formation in the central repeats (primarily repeats 3-5), and that the C-terminal repeats become structured in a fast step that converts the intermediate to the native state.1 The experimentally determined energy landscape suggests that compared to a more C-terminal folding route, the observed folding route is low in energy.
To stringently test whether the observed folding route is selected based on its relatively low energy, we replaced the C-terminal repeats of the Notch ankyrin domain with highly stabilizing consensus repeats.33 These consensus repeats substantially stabilize the entire Notch ankyrin domain, decreasing the free energy of folding by approximately 6 kcal/mol.34 To determine how the distribution of structure in the folding pathway and transition state ensemble changes by this alteration of the energy landscape, we have measured the effects of conserved alanine to glycine substitutions in each repeat of the C-terminally stabilized Notch ankyrin domain consensus fusions. The results support the existence of specific folding pathways, provide a measure of the degree to which the transition state ensemble can be re-routed, and demonstrate a direct connection between the equilibrium energy landscape and kinetic folding pathways, suggesting that folding pathways are determined by local thermodynamic stabilities.
Results
Ankyrin repeats are a class of repeat-proteins composed of multiple tandem structural elements that are 33 residues in length. Ankyrin repeats contain two anti-parallel α-helices that are connected by a short loop; adjacent repeats are connected to each other through an extended loop with a tight β-turn. Adjacent repeats are packed extensively against their nearest-neighbors to form an extended linear array. The Notch ankyrin domain has seven ankyrin sequence repeats, six of which are structured (Figure 1).35
Figure 1.
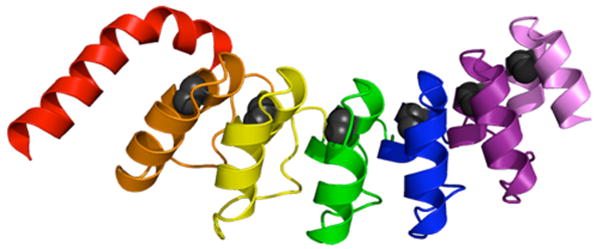
Ribbon representation of the 2.0 Å crystal structure of the Notch ankyrin domain35. The N-terminal repeat, which is partly disordered, is colored red; repeats two through seven are colored orange through lavender. The conserved alanine in each repeat is represented in CPK. This figure was generated using MacPymol.45
Thermodynamic consequences of alanine to glycine substitutions
The tandem architecture of repeat proteins allows substitutions to made to residues that are in structurally similar environments in different parts of the chain. We have used a series of substitutions of a conserved alanine (Figure 1) with a glycine in each repeat to probe the limits of structure in the transition state ensembles of our C-terminally stabilized constructs.1,36 Because each alanine contacts residues within the same repeat, this substitution series allows us to interrogate the extent of structure formation within each repeat.
The effect of each substitution on stability in different backgrounds (Nank1-5, Nank1-5C1, and Nank1-5C2*) was determined by equilibrium CD- and fluorescence-monitored urea denaturation. With the exception of the first repeat, all glycine substitutions are destabilizing (Figure 2). Moreover, the effect of each glycine substitution is similar in the three different backgrounds (Table 1, supplemental Figure 1), suggesting that the structure of the naturally occurring repeats are not strongly perturbed by C-terminal consensus stabilization. The most destabilizing substitutions are in the second and third repeat (supplemental Figure 1). The substitutions made in fourth, fifth, and consensus repeats are less destabilizing: ΔΔG° values in these repeats are less than half that of substitutions in the second and third repeats. The substitutions in the first repeat have little to no effect on the unfolding free energy, consistent with it being partly disordered.35 The variation in ΔΔG° among repeats two through seven (Figure S1) is surprisingly large, given the similar structures of each repeat. This variation, which must be a result of the high sequence variation among repeats, underscores the fact that very subtle structural differences can lead to large variations in the free energy of folding.
Figure 2.
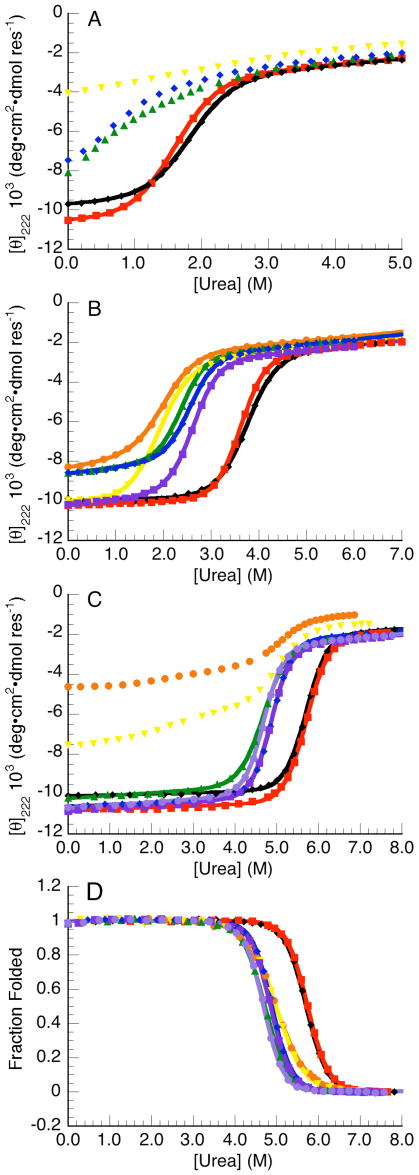
Effects of conserved alanine to glycine substitutions on equilibrium stability. CD-monitored urea-induced unfolding transitions of constructs that contain alanine to glycine subsitutions in Nank1-5 (A), Nank1-5C1 (B), and Nank1-5C2 (C). Fluorescence-monitored transitions of substitutions in Nank1-5C2 (D). The position of each substitution is indicated as follows: first repeat, red; second repeat, orange; third repeat, yellow; fourth repeat, green; fifth repeat, blue; first designed, purple; second designed repeat, light purple.
Table 1. Urea-induced unfolding parameters for variants that contain alanine to glycine substitutions in Nank1-5, Nank1-5C1, and Nank1-5C2.
| ΔG°H2O (kcal•mol-1) | m-value (kcal•mol-1•M-1) | Cm (M) | ||||
|---|---|---|---|---|---|---|
| CD | Fluorescence | CD | Fluorescence | CD | Fluorescence | |
| Nank1-5 | 3.21 ± 0.09 | 3.29 ± 0.03 | 1.78 ± 0.03 | 1.84 ± 0.01 | 1.80 ± 0.09 | 1.78 ± 0.02 |
|
| ||||||
| Nank1-5 (AG1) | 3.06 ± 0.06 | 3.17 ± 0.13 | 1.83 ± 0.02 | 1.89 ± 0.05 | 1.67 ± 0.02 | 1.68 ± 0.03 |
| Nank1-5C1 | 7.31 ± 0.17 | 7.50 ± 0.09 | 1.98 ± 0.10 | 2.05 ± 0.03 | 3.67 ± 0.04 | 3.65 ± 0.02 |
|
| ||||||
| Nank1-5C1 (AG1) | 8.21 ± 0.06 | 8.16 ± 0.24 | 2.25 ± 0.01 | 2.22 ± 0.07 | 3.65 ± 0.01 | 3.67 ± 0.01 |
| Nank1-5C1 (AG2) | 3.72 ± 0.09 | 3.88 ± 0.09 | 1.77 ± 0.04 | 1.85 ± 0.05 | 2.10 ± 0.07 | 2.10 ± 0.07 |
| Nank1-5C1 (AG3) | 3.61 ± 0.13 | 4.00 ± 0.16 | 1.84 ± 0.03 | 2.01 ± 0.07 | 1.96 ± 0.04 | 1.99 ± 0.01 |
| Nank1-5C1 (AG4) | 5.52 ± 0.04 | 5.69 ± 0.11 | 2.32 ± 0.01 | 2.41 ± 0.04 | 2.38 ± 0.01 | 2.36 ± 0.01 |
| Nank1-5C1 (AG5) | 5.71 ± 0.09 | 5.77 ± 0.07 | 2.22 ± 0.03 | 2.26 ± 0.02 | 2.58 ± 0.01 | 2.56 ± 0.01 |
| Nank1-5C1 (AGC1) | 5.68 ± 0.06 | 5.66 ± 0.08 | 2.18 ± 0.01 | 2.17 ± 0.02 | 2.61 ± 0.01 | 2.61 ± 0.02 |
| Nank1-5C2 | 13.0 ± 0.03 | 13.25 ± 0.40 | 2.28 ± 0.01 | 2.30 ± 0.07 | 5.70 ± 0.01 | 5.70 ± 0.01 |
|
| ||||||
| Nank1-5C2 (AG1) | 12.8 ± 0.12 | 12.62 ± 0.09 | 2.21 ± 0.02 | 2.17 ± 0.01 | 5.77 ± 0.02 | 5.82 ± 0.01 |
| Nank1-5C2 (AG2) | NAa | (8.98, 7.95) | NAa | (1.78, 1.59) | NAa | (5.06, 4.98) |
| Nank1-5C2 (AG3) | NAa | 8.12 ± 0.22 | NAa | 1.64 ± 0.04 | NAa | 4.97 ± 0.01 |
| Nank1-5C2 (AG4) | 10.1 ± 0.05 | 9.59 ± 0.10 | 2.14 ± 0.01 | 2.06 ± 0.03 | 4.72 ± 0.02 | 4.66 ± 0.02 |
| Nank1-5C2 (AG5) | 11.9 ± 0.07 | 11.46 ± 0.28 | 2.44 ± 0.02 | 2.35 ± 0.05 | 4.89 ± 0.01 | 4.88 ± 0.01 |
| Nank1-5C2 (AGC1) | 11.8 ± 0.08 | 11.65 ± 0.13 | 2.45 ± 0.02 | 2.41 ± 0.03 | 4.85 ± 0.01 | 4.84 ± 0.01 |
| Nank1-5C2 (AGC2) | 11.7 ± 0.04 | 11.61 ± 0.14 | 2.50 ± 0.01 | 2.48 ± 0.03 | 4.69 ± 0.01 | 4.68 ± 0.01 |
Parameters were estimated by fitting urea-induced unfolding transitions using nonlinear least-squares as described.42 Uncertainties are standard errors on the mean of at least three titrations.
Unfolding parameters determined using CD could not be obtained for Nank1-5C2 (AG2) and Nank1-5C2 (AG3) due to the existence of a folding intermediate. Conditions: 25 mM Tris•HCl (pH 8.0), 150 mM NaCl, 20 °C.
Because the unfolding free energy of Nank1-5 is approximately 3.2 kcal/mol, the substitutions made in the second and third repeat, which are the most destabilizing, result in polypeptides that are unfolded under native conditions. Indeed, for Nank1-5 (AG3)†, no clear transition is observed and it is likely that the observed signal represents only the denatured baseline. This is consistent with decreased CD in both the far- and near-UV regions. For the less destabilizing substitutions in the fourth and fifth repeat, only a partial unfolding transition is observed in the Nank1-5 background (Figure 2A).
In Nank1-5C2, the most C-terminally stabilized construct, the substitutions in the second and third repeats [Nank1-5C2 (AG2) and Nank1-5C2 (AG3)] results in an equilibrium unfolding intermediate separated from the native and denatured states by two distinct far-UV CD unfolding transitions (Figure 2C). The transition at low urea concentrations is broad, whereas that at higher concentrations is steep. In contrast, fluorescence-monitored unfolding curves of Nank1-5C2 (AG2) and Nank1-5C2 (AG3) show a single unfolding transition at the same urea concentration as the second transition seen by CD (Figure 2D). The thermodynamic parameters obtained from fits to the fluorescence-monitored unfolding transitions of Nank1-5C2 (AG2) and Nank1-5C2 (AG3) indicate a 5 kcal/mol decrease in the ΔG°u,H2O (corresponding to the unfolding of the intermediate) and an 0.6 kcal/mol•M decrease in the m-value, consistent with a smaller cooperative unit (Table 1).
Kinetic consequences of alanine to glycine substitutions
To determine the effect that each substitution has on the refolding and unfolding kinetics as the energy landscape is shifted by addition of C-terminally stabilizing consensus repeats, we measured the kinetics of refolding and unfolding of the alanine to glycine substitutions in Nank1-5, Nank1-5C1, and Nank1-5C2 using stopped-flow fluorescence. Previous studies have shown that Nank1-5, Nank1-5C1, and Nank1-5C2 show two kinetic refolding phases: a dominant fast phase, and a second, minor phase that is limited by prolyl-isomerization, consistent with Nank1-7Δ (the parent construct).33 With the exception of the highly destabilized Nank1-5 (AG4), all of the alanine to glycine substitutions also show two refolding phases.
However, in contrast to the parent construct, Nank1-5, Nank1-5C1, and Nank1-5C2 show a single unfolding phase,33 as do the glycine substitutions in those backgrounds. For the parent construct, a second observed unfolding phase results from an on-pathway kinetic intermediate; the observation of two unfolding phases and their urea dependences allows a kinetic three-state mechanism to be fitted to the rate constants and amplitudes for unfolding and refolding, providing tight constraints on the underlying kinetic constants.31 Although the urea dependences of the refolding and unfolding rate constants (Figure 3) are nonlinear for the glycine variants, suggesting a complex kinetic mechanism, for most variants this nonlinearity is not sufficient to adequately constrain the underlying kinetic constants in a three-state fit. Thus, we have simply used a nonlinear model (equation 2, Materials and Methods) to fit the urea dependences of the refolding and unfolding rate constants of the glycine variants. Although this model is comparatively phenomenological, it provides an accurate estimate for the rate of folding in the absence of denaturant, allowing the effect of glycine substitution on the rate-limiting step in folding to be determined.
Figure 3.
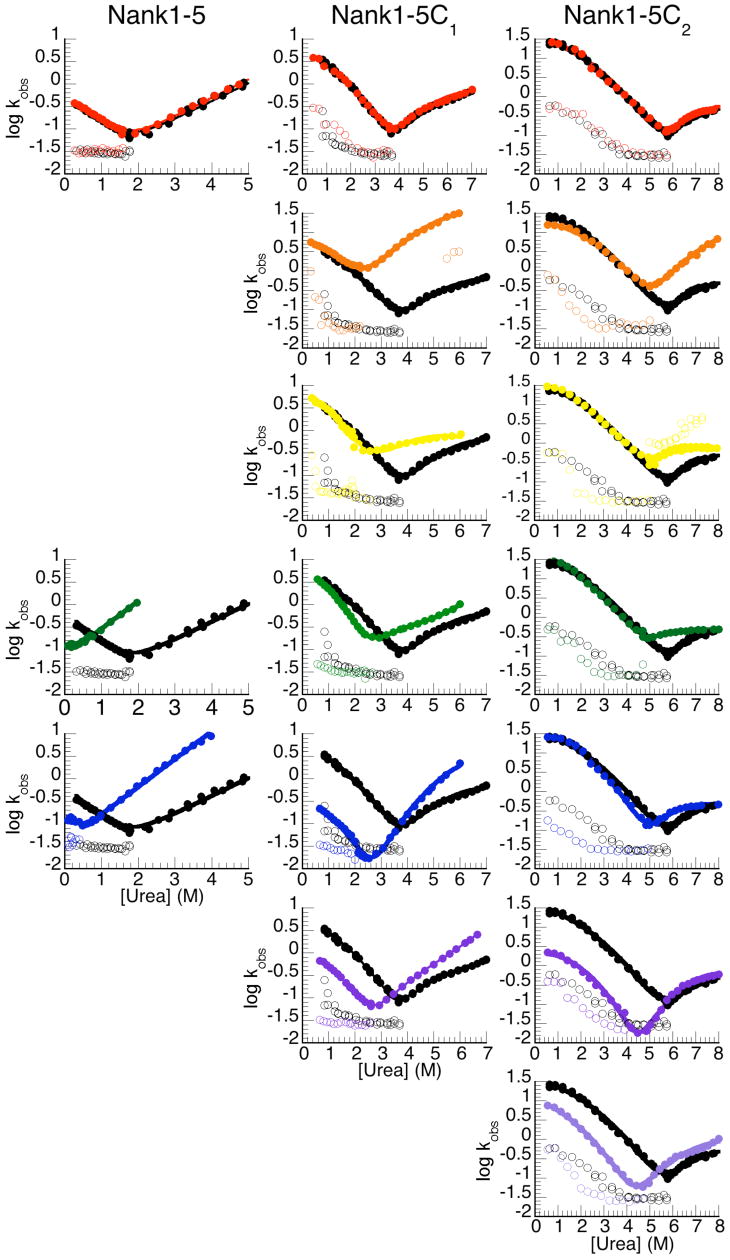
Effects of conserved alanine to glycine substitutions on folding kinetics. Chevron plots (log kobs vs. urea concentraion), monitored by tryptophan fluorescence, alanine to glycine variants. Rate constants of constructs that contain alanine to glycine substitutions in Nank1-5 (left column), Nank1-5C1 (center column), and Nank1-5C2 (right column). Filled circles represent rate constants for the major refolding and unfolding phases, open circles represent rate constants for the minor refolding and unfolding phases. Each panel shows a single alanine to glycine substitution (colored as in Figure 2), compared to the parent construct (black), starting in the first repeat (top) and progressing toward the consensus repeats (bottom, see numbering at right).
The glycine substitutions in Nank1-5C1 have varied effects on the refolding and unfolding rate constants. Substitutions in the first, second, third, and fourth repeat have little effect on the refolding rate constants, although at urea concentrations near the Cm, the refolding rate constant of Nank1-5C1 (AG4) is smaller than that of Nank1-5C1 (Figure 3). Instead, the destabilization seen in the equilibrium data seems to arise from increases in the unfolding rates. In contrast, the substitutions in the two C-terminal repeats (the fifth and consensus repeat) decrease the refolding rate constants at all urea concentrations, corresponding to decreases in kf,H2O of ten- and six-fold for Nank1-5C1 (AG5) and Nank1-5C1 (AGC1‡), respectively (Table 2).
Table 2. Fitted unfolding and refolding kinetic parameters for variants that contain alanine to glycine substitutions in Nank1-5, Nank1-5C1, and Nank1-5C2a.
| kf,H2O (sec-1) | mf (M-1) | ku,H2O (sec-1) | mu (M-1) | b (M-2) | c (M-3) | ||
|---|---|---|---|---|---|---|---|
| Nank1-7Δb | 0.48 | -0.22 | 0.00 | 1.702 | -0.17 | ||
|
| |||||||
| Nank1-5 | 0.69 | -0.76 | 0.01 | 0.40 | |||
|
| |||||||
| Nank1-5 (AG1) | 0.65 | -0.72 | 0.01 | 0.41 | 0c | ||
| Nank1-5 (AG4) | 0.07 | -1.76 | 0.07 | 0.61 | 0.60 | ||
| Nank1-5 (AG5) | 0.13 | -1.52 | 0.04 | 0.62 | 0.69 | ||
| Nank1-5C1 | 5.92 | -0.24 | 1.68×10⁻⁵ | 1.27 | -0.09 | ||
|
| |||||||
| Nank1-5C1 (AG1) | 5.92 | -0.20 | 1.78×10⁻⁵ | 1.28 | -0.09 | 0c | |
| Nank1-5C1 (AG2) | 6.97 | -0.26 | 3.54×10⁻³ | 1.14 | -0.08 | -0.03 | |
| Nank1-5C1 (AG3) | 8.43 | -0.43 | 3.64×10⁻³ | 0.86 | -0.08 | -0.06 | |
| Nank1-5C1 (AG4) | 4.53 | -0.01 | 3.70×10⁻⁴ | 1.65 | -0.33 | 0.02 | 0.09 |
| Nank1-5C1 (AG5) | 0.44 | -0.32 | 1.59×10⁻⁶ | 1.72 | -0.12 | 0.87 | |
| Nank1-5C1 (AGC1) | 0.89 | -0.03 | 4.04×10⁻⁵ | 1.62 | -0.22 | 0.02 | 0.6 |
| Nank1-5C2 | 34.7 | -0.11 | 1.16×10⁻⁶ | 1.25 | -0.07 | ||
|
| |||||||
| Nank1-5C2 (AG1) | 37.2 | -0.14 | 1.71×10⁻⁶ | 1.21 | 0.07 | 0c | |
| Nank1-5C2 (AG2) | 18.4 | -0.02 | 7.01×10⁻⁷ | 1.47 | -0.07 | 0.08 | |
| Nank1-5C2 (AG3) | 35.3 | -0.06 | 1.83×10⁻⁵ | 1.27 | -0.09 | 0.00 | |
| Nank1-5C2 (AG4) | 51.5 | -0.20 | 1.36×10⁻⁴ | 0.98 | -0.07 | -0.06 | |
| Nank1-5C2 (AG5) | 32.3 | -0.03 | 4.77×10⁻⁷ | 1.60 | -0.11 | 0.02 | |
| Nank1-5C2 (AGC1) | 1.91 | 0.10 | 5.02×10⁻¹⁰ | 2.24 | -0.14 | 1.05 | |
| Nank1-5C2 (AGC2) | 11.1 | -0.21 | 5.70×10⁻⁷ | 1.47 | -0.09 | 0.40 | |
Parameters were estimated by fitting equation (2) to the urea dependencies of the rate constants of the major refolding and unfolding phases.
Data taken from reference (22).
Φ-values of zero were assumed for substitutions in the first repeat, because folding rates are not affected by the substitution. Conditions: 25 mM Tris•HCl (pH 8.0), 150 mM NaCl, 20 °C.
As with the glycine substitutions in Nank1-5C1, only the C-terminal substitutions in Nank1-5C2 have an effect on the refolding rate constants. None of the substitutions in the N-terminal or central repeats of Nank1-5C2 (repeats one through five) significantly affect the refolding rate constants, but instead increase the unfolding rate constants (Figure 3). In contrast, substitutions in the two C-terminal consensus repeats have a large effect on the refolding rate constants at all urea concentrations. Values for kf,H2O are decreased by twenty- and three-fold for Nank1-5C2 (AGC1) and Nank1-5C2 (AGC2), respectively.
Since the cost of the alanine to glycine substitutions in repeats two and three exceeds the global stability of Nank1-5 (3.2 kcal/mol), we have only been able to examine the kinetic consequences of glycine substitutions in the first, fourth, and fifth repeat. The refolding and unfolding rates of Nank1-5 (AG1) are nearly identical to those measured for Nank1-5 at all urea concentrations (Figure 3). In contrast, the refolding rate constants of the variants that contain substitutions in fourth and fifth repeat are smaller than the refolding rate constants of Nank1-5 at all urea concentrations. The extrapolated refolding rate constants in water (kf,H2O; 0 M urea) are decreased by a factor of ten and five, respectively (Table 2) for Nank1-5 (AG4) and Nank1-5 (AG5). In addition, the unfolding rate constants of Nank1-5 (AG4) and Nank1-5 (AG5) are larger than the unfolding rate constants of Nank1-5.
Discussion
The tolerance of the Notch ankyrin domain to deletion of multiple repeats has allowed the equilibrium energy landscape to be mapped at single-repeat resolution.28 We have used the same analysis to compare how the folding energy landscape of Nank1-5C2 is altered from that of the Nank1-7Δ.33 Although Nank1-7Δ and Nank1-5C2 contain the same number of ankyrin repeats, the unfolding free energy of Nank1-5C2 is 13 kcal/mol, which is over 5 kcal/mol more stable than Nank1-7Δ (Figure 4A and 4D). Because this enhancement results from stabilization on the end of this linear domain, it results in a major perturbation in the energy landscape of Nank1-5C2 (compare Figures 4A and 4D). The partially folded forms that include the two C-terminal consensus repeats are much more stable than other partially folded forms of the same repeat length, whereas in Nank1-7Δ the same C-terminal conformations are less stable than those including repeats three through five. This shift suggests that if the kinetic pathways for refolding are thermodynamically selected, the folding pathway of Nank1-5C2 should be C-terminally rerouted.
Figure 4.
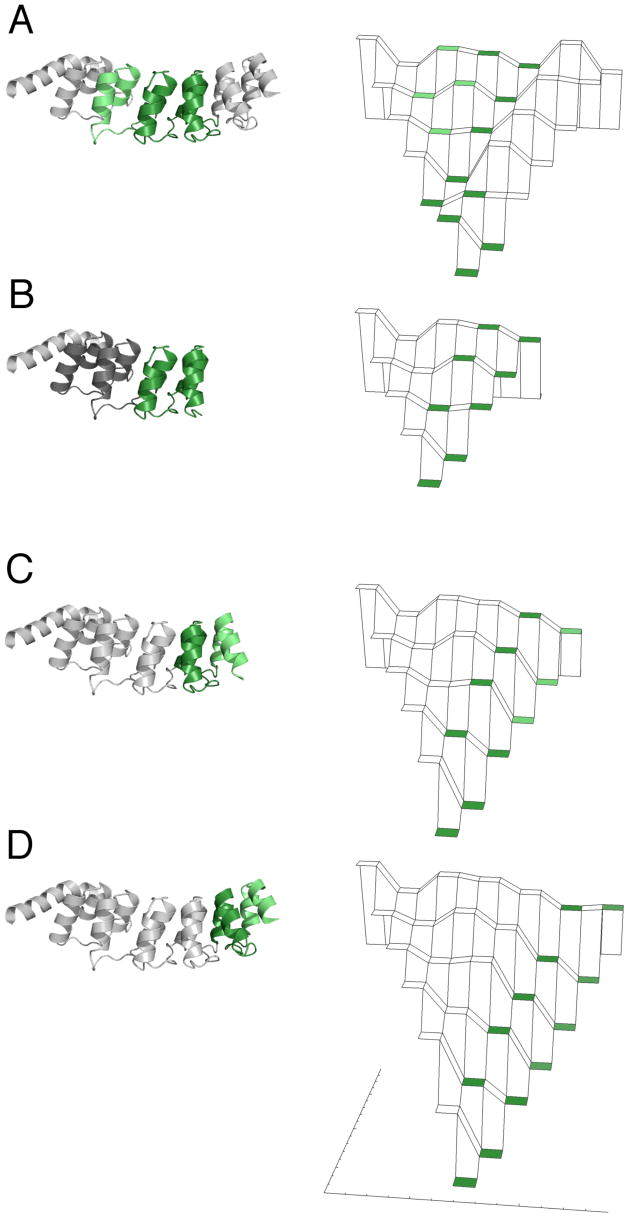
The distribution of structure in the transition state ensembles of C-terminally stabilized ankyrin repeat constructs, and the shift in the energy landscape from adding consensus repeats. Left: the transition state ensemble of the full length Notch ankyrin domain (A) is compared with that of Nank1-5 (B), Nank1-5C1 (C), and Nank1-5C2 (D). Repeats with high Φ-values are shaded green; those with zero Φ-values are shaded white. Constructs for which Φ-values could not be determined, Nank1-5 (AG2) and Nank1-5 (AG3), are colored grey. All Φ-values are mapped onto the crystal structure of Nank1-7Δ. Ribbon diagrams were generated using MacPymol.45. Right: energy landscapes, showing free energy (vertical direction) as a function of the number of folded repeats (back to front for denatured to native state, respectively) and the localization of structure (left to right for N- and C-terminally localized structure, respectively). Landscape tiers are shaded corresponding to Φ-values as in the ribbon diagrams.
Structure of the transition state ensemble of Nank1-5, Nank1-5C1, and Nank1-5C2
The structure of the transition state ensembles in refolding of the C-terminally stabilized constructs can be compared using Φ-values obtained for glycine substitutions in different repeats, which represent the degree to which folding is slowed by destabilizing substitutions. The structure of the transition state for Nank1-5 folding appears to be similar to that of in Nank1-7Δ, in that Φ-values in repeats four and five are high, but that in repeat one is low (Figure 4A, B; Table 1).
In contrast the structure in the transition state for folding of Nank1-5C1 appears to be shifted C-terminally compared to Nank1-5 and Nank1-7Δ (Figure 4C; Table 2). The Φ-values determined for first through fourth repeats are zero, whereas the Φ-values determined for the fifth and consensus (sixth) repeat are near one (0.87 and 0.6, respectively). The distribution of Φ-values in Nank1-5C1 suggests that the transition state ensemble involves structure in the fifth and consensus repeat.
This shift in the transition state structure continues toward the stabilized C-terminus in Nank1-5C2. In this construct, the Φ-values for the five N-terminal repeats are zero, whereas the Φ-values for the two C-terminal consensus (sixth and seventh) repeats are non-zero (1.05 and 0.4, respectively). The distribution of Φ-values in Nank1-5C2 suggests that structure in the transition state ensemble has shifted away from repeats four and five to the two C-terminal consensus repeats (Figure 4D). These findings are consistent with recent results showing that the transition state structure of myotrophin, a four-ankyrin repeat protein, can be shifted by destabilizing substitutions.30
Alteration of the transition state ensemble and the folding pathway through C-terminal stabilization
Previous studies have determined the distribution of structure in the transition state ensemble of Nank1-7Δ using analogous alanine to glycine substitutions in each repeat.1 Whereas no kinetic effect was found for substitutions in the first, sixth or seventh repeats, a large kinetic effect was found in the third, fourth, and fifth repeats. Thus, the Notch ankyrin domain has a polarized transition state with high Φ-values in the three internal repeats and Φ-values of zero elsewhere. This picture of the transition state ensemble is consistent with the observation that Nank1-5 folds with the same rate as Nank1-7Δ (Table 2)31, and with the observation that repeats four and five remain structured in the transition state during Nank1-5 folding.
In contrast, substitutions in the third and fourth repeats in the C-terminally stabilized constructs have no kinetic effect, producing Φ-values of zero. Furthermore, in Nank1-5C2, where C-terminal stabilization is largest, substitution in repeat five has no effect on refolding kinetics, whereas in Nank1-7Δ, it defines the C-terminal boundary for the transition state ensemble. Instead, for the consensus-stabilized constructs, the transition state ensemble is shifted towards the C-terminus (Figure 4). This shift matches the new low energy channel through the consensus stabilized landscape (Figure 4C, D), demonstrating that for the Notch ankyrin domain, folding pathway selection is under thermodynamic control. This conclusion is consistent with the observation that Nank1-5C1 and Nank1-5C2 fold one and two orders of magnitude faster than either parent construct (Nank1-7Δ and Nank1-5).33 Thus, the addition of the terminal consensus repeats not only stabilizes the entire domain but also alters the dominant folding pathway of the domain.
Conclusions
We have taken advantage of the modularity, sequence simplicity, and linear structure of a repeat protein to probe the robustness and determinants of protein folding pathways. By C-terminally stabilizing the Notch ankyrin domain using consensus sequence repeats and interrogating the folding pathway using conservative, structurally homologous substitutions in each repeat, we find that a single well-defined folding pathway is identified in each construct. Moreover, the folding pathway shifts to track the lowest channel through the energy landscape, demonstrating experimentally that folding pathways are determined by local energetics. Given that the folding pathway in this repeat protein is localized to a subset of the repeats, even though multiple structurally and topologically similar pathways are available, it seems likely that the finding here of selection of specific pathways by local thermodynamics can be generalized to globular proteins. Indeed, in the rotationally symmetric globular proteins G and protein L, the folding pathway has been shown to correspond to the region of local stability,37,38 a result that can be captured by both an all-atom Gō model 39 and the sequence dependent components of the diffusion-collision model.40 These results underscore the importance of developing accurate energy functions (that can accurately reproduce the stability differences among the ankyrin repeats of Notch, for example) for accurate prediction of folding.
Materials and Methods
Mutagenesis, protein expression and purification
Constructs encoding Nank1-5, Nank1-5C1, and Nank1-5C2 have been described previously.33,41 The conserved alanine in the first helix of each repeat was substituted with glycine using QuickChange (Stratagene, La Jolla, CA). Constructs that contain individual alanine to glycine substitutions are referred to as Nank1-5 (AG1), Nank1-5 (AG2), etc. depending on whether the single alanine to glycine substitution is in repeat one, two, etc. Proteins were expressed in E. coli BL21 (DE3) and purified as described.33,41
Equilibrium unfolding experiments
Urea-induced unfolding was performed using an Aviv 62A DS Spectropolarimeter, equipped with a computer-controlled Hamilton Microlab syringe titrator (Hamilton, Reno, NV) as described.42 36 34 CD measurements were made at 222 nm, monitoring α-helical structure. Tryptophan fluorescence was measured by exciting at 280 nm, and recording emission using a perpendicular 320 nm cutoff filter. Samples contained 2-4 μM protein, 25 mM Tris•HCl, 150 mM NaCl, pH 8.0, and were maintained at 20 °C. With the exception of Nank1-5C2 (AG2) and Nank1-5C2 (AG3), equilibrium unfolding was assumed to follow a two-state process.
Thermodynamic parameters were estimated assuming a linear dependence of the unfolding free energy on denaturant (ΔG=ΔG°H2O−m[urea]).43,44 Free energies were related to unfolding transitions by treating the observed spectroscopic signal as a population-weighted average of native and denatured signals, as described.36,42
Kinetic refolding and unfolding experiments
Refolding and unfolding kinetic measurements were made on an Applied Photophysics SX.18MV-R stopped-flow rapid mixing device (Leatherhead, UK). Fluorescence measurements were detected perpendicular to a 280 nm excitation using a 320 nm cutoff filter. For each variant, refolding was initiated from urea concentration just above the Cm, to permit refolding to be measured as close to 0 M urea as possible. For variants made in the stabilized Nank1-5C2 background, unfolding was initiated from moderate urea concentrations, to allow unfolding to be measured at high urea concentrations. Final protein concentrations, following dilution, were between 1.0 and 3.0 μM.
Rates of refolding and unfolding were obtained from fits of the individual progress curves to the following equation:
| (1) |
where the observed signal (Yobs) is a function of the signal at infinite time (Y∞) and exponentials that correspond to individual kinetic phases, each with amplitudes Yi and rate constants ki, where n=1 for unfolding, and n=2 for refolding to account for the additional proline isomerization phase.
Analysis of Chevron plots and Φ-values. The urea dependence of the rate constants for the major refolding and unfolding phases (chevron plot) were fit according to the following equation:
| (2) |
The log of the refolding and unfolding rate constants are allowed to have a linear, quadratic, and cubic dependence, given by mf and mu, b, and c, as required. In general, the nonlinear terms, which are the same for both folding and unfolding, were needed when a large range of urea concentrations was required to fully define the chevron (i.e. Nank1-5C2 and Nank1-5C1).
Φ-values were calculated using the following equation:
| (3) |
where the folding rate constant of variants and the parent constructs were determined from fits of the chevron plots. Equilibrium unfolding free energies were determined from urea-induced denaturations. Φ-values could not be determined for Nank1-5 (AG2) and Nank1-5 (AG3) because these constructs are not folded.
The Φ -values calculated for Nank1-5C2 (AG2) and Nank1-5C2 (AG3) are from kinetic and thermodynamic data obtained monitoring folding with fluorescence. Although an additional equilibrium unfolding transition is seen by CD at low denaturant concentrations, the structural transition probed in fluorescence is likely to be largely localized to the C-terminus of the molecule, based on the location of the single tryptophan (repeat five, packed against repeat four) and the observation that the both the equilibrium curves and chevrons of these two variants are sensitive to the C-terminal stabilization (compare the folding arm of and minimum in the chevron of Nank1-5C2 (AG2) and Nank1-5C2 (AG3) to Nank1-5 and Nank1-7Δ). As a result, the actual effect of these substitutions on the free energy of unfolding of the native state (repeats two and three folded) would actually be larger than that estimated from fluorescence, making these low Φ-values even lower.
Supplementary Material
Acknowledgments
We thank Christina Bradley for helpful comments and suggestions. We thank an anonymous reviewer for insightful comments relating to energy landscape theory. This work was supported by the National Institutes of Health, research grant GM068462 to DB.
Footnotes
Nank1-5C1 and Nank1-5C2 indicate C-terminal fusions of one and two consensus repeats to repeats 1-5 of the Notch ankyrin domain. The construct Nank1-5 consists only of the five N-terminal repeats, and is used along with the full-length seven repeat Notch ankyrin domain (Nank1-7Δ) as a reference point for landscape redistribution.
(AG3) indicates that an alanine to glycine substitution has been made in the third repeat of Nank1-5.
AGC1 and AGC2 refer to substitutions in the first and second C-terminal consensus repeat, respectively.
References
- 1.Bradley CM, Barrick D. Structure (London, England) 2006;14:1303–12. doi: 10.1016/j.str.2006.06.013. [DOI] [PubMed] [Google Scholar]
- 2.Kim PS, Baldwin RL. Annu Rev Biochem. 1990;59:631–60. doi: 10.1146/annurev.bi.59.070190.003215. [DOI] [PubMed] [Google Scholar]
- 3.Dill KA, Chan HS. Nat Struct Biol. 1997;4:10–9. doi: 10.1038/nsb0197-10. [DOI] [PubMed] [Google Scholar]
- 4.Bilsel O, Matthews CR. Adv Protein Chem. 2000;53:153–207. doi: 10.1016/s0065-3233(00)53004-6. [DOI] [PubMed] [Google Scholar]
- 5.Onuchic JN, Nymeyer H, Garcia AE, Chahine J, Socci ND. Adv Protein Chem. 2000;53:87–152. doi: 10.1016/s0065-3233(00)53003-4. [DOI] [PubMed] [Google Scholar]
- 6.Bashford D, Weaver DL, Karplus M. J Biomol Struct Dyn. 1984;1:1243–55. doi: 10.1080/07391102.1984.10507515. [DOI] [PubMed] [Google Scholar]
- 7.Myers JK, Oas TG. Annu Rev Biochem. 2002;71:783–815. doi: 10.1146/annurev.biochem.71.110601.135346. [DOI] [PubMed] [Google Scholar]
- 8.Grantcharova VP, Riddle DS, Santiago JV, Baker D. Nat Struct Biol. 1998;5:714–20. doi: 10.1038/1412. [DOI] [PubMed] [Google Scholar]
- 9.Kim DE, Fisher C, Baker D. J Mol Biol. 2000;298:971–84. doi: 10.1006/jmbi.2000.3701. [DOI] [PubMed] [Google Scholar]
- 10.Northey JG, Di Nardo AA, Davidson AR. Nat Struct Biol. 2002;9:126–30. doi: 10.1038/nsb748. [DOI] [PubMed] [Google Scholar]
- 11.Mayor U, Guydosh NR, Johnson CM, Grossmann JG, Sato S, Jas GS, Freund SM, Alonso DO, Daggett V, Fersht AR. Nature. 2003;421:863–7. doi: 10.1038/nature01428. [DOI] [PubMed] [Google Scholar]
- 12.Li Y, Gupta R, Cho JH, Raleigh DP. Biochemistry. 2007;46:1013–21. doi: 10.1021/bi061516j. [DOI] [PubMed] [Google Scholar]
- 13.Briggs MS, Roder H. Proc Natl Acad Sci U S A. 1992;89:2017–21. doi: 10.1073/pnas.89.6.2017. [DOI] [PMC free article] [PubMed] [Google Scholar]
- 14.Roder H, Elove GA, Englander SW. Nature. 1988;335:700–4. doi: 10.1038/335700a0. [DOI] [PMC free article] [PubMed] [Google Scholar]
- 15.Udgaonkar JB, Baldwin RL. Proc Natl Acad Sci U S A. 1990;87:8197–201. doi: 10.1073/pnas.87.21.8197. [DOI] [PMC free article] [PubMed] [Google Scholar]
- 16.Miranker A, Radford SE, Karplus M, Dobson CM. Nature. 1991;349:633–6. doi: 10.1038/349633a0. [DOI] [PubMed] [Google Scholar]
- 17.Krishna MM, Lin Y, Mayne L, Englander SW. Journal of molecular biology. 2003;334:501–13. doi: 10.1016/j.jmb.2003.09.070. [DOI] [PubMed] [Google Scholar]
- 18.Bycroft M, Matouschek A, Kellis JT, Jr, Serrano L, Fersht AR. Nature. 1990;346:488–90. doi: 10.1038/346488a0. [DOI] [PubMed] [Google Scholar]
- 19.Kloss E, Courtemanche N, Barrick D. Arch Biochem Biophys. 2008;469:83–99. doi: 10.1016/j.abb.2007.08.034. [DOI] [PMC free article] [PubMed] [Google Scholar]
- 20.Weikl TR, Dill KA. J Mol Biol. 2003;329:585–98. doi: 10.1016/s0022-2836(03)00436-4. [DOI] [PubMed] [Google Scholar]
- 21.Makarov DE, Plaxco KW. Protein Sci. 2003;12:17–26. doi: 10.1110/ps.0220003. [DOI] [PMC free article] [PubMed] [Google Scholar]
- 22.Koga N, Takada S. J Mol Biol. 2001;313:171–80. doi: 10.1006/jmbi.2001.5037. [DOI] [PubMed] [Google Scholar]
- 23.Clementi C, Jennings PA, Onuchic JN. Proc Natl Acad Sci U S A. 2000;97:5871–6. doi: 10.1073/pnas.100547897. [DOI] [PMC free article] [PubMed] [Google Scholar]
- 24.Clementi C, Nymeyer H, Onuchic JN. J Mol Biol. 2000;298:937–53. doi: 10.1006/jmbi.2000.3693. [DOI] [PubMed] [Google Scholar]
- 25.Weinkam P, Zong C, Wolynes PG. Proc Natl Acad Sci U S A. 2005;102:12401–6. doi: 10.1073/pnas.0505274102. [DOI] [PMC free article] [PubMed] [Google Scholar]
- 26.Wallin S, Chan HS. Protein Sci. 2005;14:1643–60. doi: 10.1110/ps.041317705. [DOI] [PMC free article] [PubMed] [Google Scholar]
- 27.Merlo C, Dill KA, Weikl TR. Proc Natl Acad Sci U S A. 2005;102:10171–5. doi: 10.1073/pnas.0504171102. [DOI] [PMC free article] [PubMed] [Google Scholar]
- 28.Mello CC, Barrick D. Proc Natl Acad Sci USA. 2004;101:14102–7. doi: 10.1073/pnas.0403386101. [DOI] [PMC free article] [PubMed] [Google Scholar]
- 29.Tang KS, Fersht AR, Itzhaki LS. Structure. 2003;11:67–73. doi: 10.1016/s0969-2126(02)00929-2. [DOI] [PubMed] [Google Scholar]
- 30.Lowe AR, Itzhaki LS. Proceedings of the National Academy of Sciences of the United States of America. 2007;104:2679–84. doi: 10.1073/pnas.0604653104. [DOI] [PMC free article] [PubMed] [Google Scholar]
- 31.Mello CC, Bradley CM, Tripp KW, Barrick D. J Mol Biol. 2005;352:266–81. doi: 10.1016/j.jmb.2005.07.026. [DOI] [PubMed] [Google Scholar]
- 32.Bradley CM, Barrick D. J Mol Biol. 2005;352:253–65. doi: 10.1016/j.jmb.2005.06.041. [DOI] [PubMed] [Google Scholar]
- 33.Tripp KW, Barrick D. Journal of molecular biology. 2007;365:1187–200. doi: 10.1016/j.jmb.2006.09.092. [DOI] [PMC free article] [PubMed] [Google Scholar]
- 34.Tripp KW, Barrick D. J Mol Biol. 2004;344:169–78. doi: 10.1016/j.jmb.2004.09.038. [DOI] [PubMed] [Google Scholar]
- 35.Zweifel ME, Leahy DJ, Hughson FM, Barrick D. Protein Sci. 2003;12:2622–2632. doi: 10.1110/ps.03279003. [DOI] [PMC free article] [PubMed] [Google Scholar]
- 36.Bradley CM, Barrick D. J Mol Biol. 2002;324:373–386. doi: 10.1016/s0022-2836(02)00945-2. [DOI] [PubMed] [Google Scholar]
- 37.McCallister EL, Alm E, Baker D. Nature structural biology. 2000;7:669–73. doi: 10.1038/77971. [DOI] [PubMed] [Google Scholar]
- 38.Nauli S, Kuhlman B, Baker D. Nature structural biology. 2001;8:602–5. doi: 10.1038/89638. [DOI] [PubMed] [Google Scholar]
- 39.Clementi C, Garcia AE, Onuchic JN. J Mol Biol. 2003;326:933–54. doi: 10.1016/s0022-2836(02)01379-7. [DOI] [PubMed] [Google Scholar]
- 40.Islam SA, Karplus M, Weaver DL. Structure. 2004;12:1833–45. doi: 10.1016/j.str.2004.06.024. [DOI] [PubMed] [Google Scholar]
- 41.Zweifel ME, Barrick D. Biochemistry. 2001;40:14344–14356. doi: 10.1021/bi011435h. [DOI] [PubMed] [Google Scholar]
- 42.Zweifel ME, Barrick D. Biochemistry. 2001;40:14357–14367. doi: 10.1021/bi011436+. [DOI] [PubMed] [Google Scholar]
- 43.Pace CN. Methods Enzymol. 1986;131:266–80. doi: 10.1016/0076-6879(86)31045-0. [DOI] [PubMed] [Google Scholar]
- 44.Santoro MM, Bolen DW. Biochemistry. 1988;27:8063–8. doi: 10.1021/bi00421a014. [DOI] [PubMed] [Google Scholar]
- 45.DeLano, W. L.; DeLano Scientific LLC: South San Francisco, 2005.
Associated Data
This section collects any data citations, data availability statements, or supplementary materials included in this article.