

Abstract
Normal nonrandom fluctuations in daily human perfomance have been documented for years. Published research reports have shown patterns of workers' errors in reading gas meters, operators' delays in answering calls, drivers' drowsiness, sleepy locomotive engineers' automatic breaking, vehicle crashes, deaths resulting from disease, brief periods of sleep, and sleep latency in structured naps. The authors summarized these data sets and fitted them with a two-peak-per-day cosine curve derived from the population growth function used in chaos theory. Median parameters extracted from the curve fits predicted a sharp peak of sleepiness at 2:30 AM and a secondary peak at 2:30 PM. The shape of the curve was modified by a nonlinear sleep-deprivation factor. The model appeared to be biological rather than behavioral or social because it applied well to disease-related deaths. The authors also review measurement of sleepiness through electroencephalographic monitoring, self-reports, pupillography, and the Multiple Sleep Latency and the Maintenance of Wakefulness Tests.
Keywords: circadian rhythm, electroencephalographic (EEG) monitoring, fatigue, public safety, sleep deprivation, sleepiness, testing
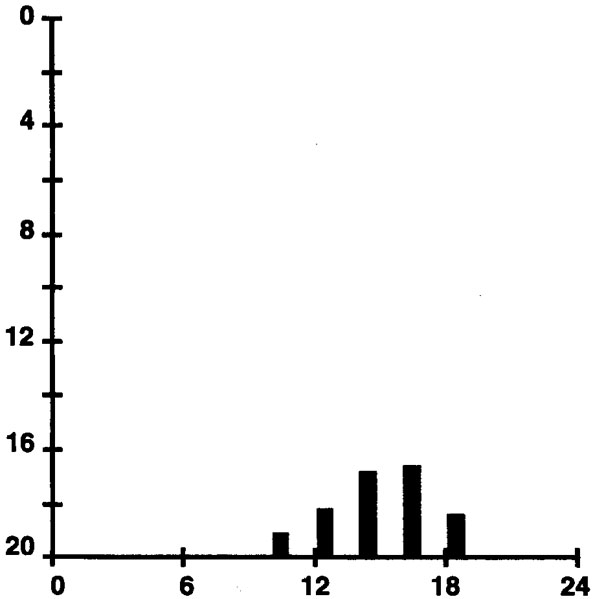
We are all aware of daily ups and downs in our abilities. Such normal fluctuations in performance have been documented for many years1,2 and are not random throughout the 24-hour day 3,4 In 1955, Bjerner reported on diurnal performance fluctuations for employees at a Swedish gas company whose work was monitored over a 20-year period.2 Figure 1 shows the distribution throughout the 24-hour day of 74,927 meter-reading errors made by these workers. Note that more errors occurred during the night, with a major peak between 1 and 3 AM and a smaller afternoon peak in errors between 1 and 3 PM.
Figure 1.

The temporal distribution of 74,927 meter reading errors recorded for Swedish gas workers over a 20-year period. Data are plotted from the report of Bjerner.2 The horizontal axis represents clock time of a 24-hour day beginning at midnight. The vertical axis represents number of errors per hour.
Since these early observations, other, more destructive human error events have also been shown to occur in this same two-peak pattern.5–8 The 24-hour distribution of 6,052 vehicle crashes attributable to fatigue (ie, crashes for which the investigation disclosed no mechanical failure and no alcohol or substance-related causal factors) is shown in Figure 2 (data originally compiled and plotted in Mitler et al5). Note that the two-peak pattern in this distribution is similar to that in Figure 1. The number of crashes is elevated between about midnight and 6 AM and again between about 1 and 4 PM
Figure 2.

Temporal distribution of 6,052 fatigue-related automobile crashes compiled from Langlois et al,6 Lavie et al,7 and Duff.8 The horizontal axis is clock time of the 24-hour day beginning at midnight. The vertical axis represents hourly number of crashes. Also see Figure 4 in Mitler et al.5
In many studies of measures of human performance and physiologic activity, researchers have found a two-peak diurnal pattern in 24-hour rhythms.5,9,10 Broughton3,4 was the first to bring this robust characteristic of human performance to the attention of researchers.
Evidence for the biological rather than the behavioral nature of this two-peak temporal pattern is supported by the identical patterns that also exist in timing of human mortality attributable to disease.11 The temporal distribution of 437,511 deaths resulting from disease that was compiled by Smolensky et al12 and Mitler et al11 is shown in Figure 3. The strength of the two-peak pattern is noteworthy in spite of the imprecision that must be associated with the process of combining deaths from many types of diseases. Breaking down data on disease-related deaths according to type of disease, age, and sex of the individuals indicated that the two-peak temporal pattern is most prominent in deaths resulting from ischemic heart disease in both men and women over the age of 65.11 Two peaks, one in the early morning (eg, 3–6 AM) and a small peak in the early afternoon, can be seen in Figures 1, 2, and 3. Researchers who applied continuous electroencephalographic (EEG) monitoring techniques for measuring cycles in sleep and wakefulness13 found that physiologic sleep tendency also has its ups and downs throughout the 24-hour day.14-19
Figure 3.

Temporal distribution of 437,511 disease-related deaths compiled from references Mitler et al11 and Smolensky. 12 The horizontal axis is clock time of the 24-hour day beginning at midnight. The vertical axis represents hourly number of mortalities. Also see Figure 2 in Mitler.5
EEG Monitoring of Sleep
Few of the multiday studies on humans using continuous electroencephalographic monitoring of sleep and wakefulness are actually relevant to measurement of sleep tendency. The two main purposes of such studies are to capture episodic abnormalities in the electroencephalogram, such as epileptic seizures,20 or to study circadian cycles in sleep or wakefulness.21 Although all of these studies accomplish their purposes and the findings also show objective and reproducible diurnal alternations of wakefulness and sleep in patients and normal persons, none has demonstrated definitive technology for quantitatively differentiating one person's sleep tendency from that of another or for detecting the presence of an abnormal sleep tendency. In one of the earliest studies that permitted naps during the “day” in participants living under time isolation, Schaefer et al22 documented the propensity of humans to sleep for up to 212 minutes in the “afternoon.” It might seem that circadian EEG studies should be helpful in quantifying individual sleep tendency, but this has not been the case. For methodological and scientific reasons, participants in these types of studies are encouraged to have only one sleep period for each circadian cycle.23
Thus, most circadian studies are designed to measure overall circadian patterns, not the fine structure of an individual's sleep cycles or how sleepy one person is compared with another person. In 1976, however, Kripke24 suggested that circadian studies might yield insights for understanding sleep disorders, such as narcolepsy. Some clinical studies used round-the-clock EEG monitoring of sleep tendency in patients with sleep disorders. Findings in several studies indicated that patients with narcolepsy, who characteristically complain of excessive sleepiness, do not sleep significantly more than normal persons do when the narcoleptics ani studied for periods of 24 to 48 hours.25-27 Rather, the sleep of narcoleptics is less consolidated than that of normal people and occurs in multiple short naps. Pollak and his colleagues28,29 extended this circadian clinical research by evaluating narcoleptic individuals in true temporal isolation and found that narcoleptics did have more sleep periods per circadian cycle than those in a control group but that the narcoleptics' total sleep time was not greater than that for the normal participants.
Modern EEG techniques for measuring sleep tendency did not grow out of circadian studies but grew, instead, out of sleep research on the properties of the nominal human sleep fraction of 1 to 2 (ie, 8 hours of sleep for every 16 hours of wakefulness).14–16,30 Sleep researchers would measure sleep tendency around the clock by allowing 1 hour of sleep for every 3 hours of time, or 30 minutes for every 90 minutes, or 3 hours for every 9 hours. Lavie and colleagues17–19,31 extended and refined this approach by preserving the basic sleep fraction but moving to ultrashort multiples (eg, 7 minutes of every 20). With such ultrashort naps, the measurement of sleep tendency at any given time in the 24-hour day is not greatly influenced by sleep that may have accumulated from previous naps in protocols that allow longer sleeping times.
The typical result of such studies is depicted in Figure 4, which is a recalculation and replotting of the amount of sleep that 9 of Lavie's participants obtained each hour when they were allowed to sleep 7 minutes out of every 20. Note the two-peak pattern is again apparent, with a rapid rise in sleep tendency (Lavie refers to this as the rapid opening of the nocturnal sleep gate), beginning at about 8 PM, and a broad plateau from about midnight to 6 AM. A smaller mid-afternoon increase in sleep tendency occurs between 1 and 3 PM, and almost no sleep occurs at about 6 to 7 PM, which Lavie refers to as the “forbidden zone.” The general pattern of this elegant work fits very well with that found by Carskadon et al15 in their 90-minute-day studies (30 minutes of sleep every 90 minutes round the clock) and with the temporal pattern of unintended sleep episodes described for participants trying to stay awake throughout a 24-hour period.32,33 The coincidence of the peak times for errors shown in Figure 1, crashes shown in Figure 2, disease-related deaths shown in Figure 3, and sleep tendency shown in Figure 4 is obvious.
Figure 4.

Amount of sleep obtained each hour for 9 participants permitted to sleep up to 7 minutes of every 20 minutes throughout the 24-hour day. Data were taken from figure 8 in Lavie and Segal.31 Horizontal axis is clock time of a 24-hour day beginning at midnight. The vertical axis represents minutes of sleep.
With such a degree of interest in sleepiness, it is appropriate to review critically the various methods of measuring sleep tendency as well as our current concepts regarding what is normal and what is abnormal in sleep tendency.
Self-Report Techniques
The first attempts to assess sleepiness were probably subjective self-reports that consisted of documenting the individual's spontaneous thoughts and comments concerning levels of energy, ability to function, and desire for sleep.34 Interview and questionnaire techniques were developed to standardize the process and better delineate the time of each measurement.
Among the best known of the questionnaire techniques is the Stanford Sleepiness Scale (SSS).35 Respondents complete this measurement by choosing one of seven statements describing their state of sleepiness from the following list: (1) feeling active and vital, alert, wide awake; (2) functioning at a high level, but not at peak, able to concentrate; (3) relaxed, awake, not at a full alertness, responsive; (4) a little foggy, not at peak, let down; (5) fogginess, beginning to lose interest in remaining awake, slowed down; (6) sleepiness, prefer to be lying down, fighting sleep, woozy; (7) almost in reverie, sleep onset soon, lost struggle to remain awake.
Major strengths of the SSS are that it can be administered many times per day, that it correlates with standard measures of performance, and that it reflects the effects of sleep loss. All levels of the SSS can be recorded throughout the 24-hour day in normal participants, experimentally sleep-deprived normal participants, and patients with sleep disorders Thus, the SSS provides no clear procedure for determining what is normal and what is abnormal. Furthermore, Dement and colleagues36 have documented glaring discordancies between high SSS ratings of 1 or 2 and gross behavioral indicators of sleep, such as closed eyes and snoring in patients with sleep apnea. These researchers have suggested that such discordancies stem from either the participant's loss of a proper frame of reference about what normal alertness really is or from simple denial. An alternative explanation for discordance is that the SSS and behavioral indicators of sleep may simply reflect different things.
Another common self-report instrument is the Epworth Sleepiness Scale (ESS), which was devised by M. W. Johns at Epworth Hospital in Melbourne, Australia.37 The ESS asks respondents to use a number from 0 to 3 corresponding to the likelihood (never, slight, moderate, and high) that they would fall asleep in eight situations: (1) sitting and reading; (2) watching TV; (3) sitting, inactive in a public place; (4) as a passenger in a car riding for an hour without a break; (5) lying down to rest in the afternoon when circumstances permit; (6) sitting and talking with someone; (7) sitting quietly after a lunch without alcohol; and (8) in a car, while stopped for a few minutes in traffic. An ESS score, tallied after the test is administered, can range between 0 and 24.
The ESS statistically distinguishes normal persons from patients with sleep disorders characterized by the symptom of excessive sleepiness. The ESS also is correlated with electroencephalographically determined sleep latencies measured at night or during the day and does reflect changes in sleepiness associated with treatment-related improvement in sleep apnea.38 The ESS is considered to be a validated, reliable, self-report measure of sleepiness. However, the ESS is not designed to be used on various occasions during the day or in the presence of short-term conditions, such as acute sleep loss, that might influence sleep tendency.
Pupillography
Pupillography is an objective, laboratory-based method of electronically monitoring the size of a person's pupil.39 Studies have shown that the diameter of the pupil, as well as the degree of stability of pupil size, is inversely related to the complaint of sleepiness. Pupillography has been used as a clinical measure of sleep tendency.40,41 The technique has not come into widespread use because modern pupillographic equipment is not generally available. In addition, the pupillographic indicators of sleepiness are not specific to whether the sleepiness is the normal result of circadian variation in alertness or the symptomatic consequence of such sleep disorders as sleep apnea and narcolepsy.
EEG-Based Techniques
Common sense dictates that when asked to fall asleep, someone who is not sleepy will take longer to produce the EEG waves of sleep than someone who is sleepy. In 1976, Carskadon and her colleagues42 studied the nocturnal sleep of 122 patients who complained of insomnia and found that the time taken to fall asleep by EEG criteria (sleep latency) varied greatly. Furthermore, the distribution of sleep latencies for the group of insomniacs did not seem much different from that of groups of people without insomnia.
Also striking for these insomniacs was their overestimation of how long it took to fall asleep. Sixty of the study participants (49%) overestimated sleep latency by more than 15 minutes, and 15 (12%) overestimated by more than 60 minutes. This kind of discrepancy between subjective and objective measures of sleep tendency is the basic reason why sleep researchers have pursued and refined EEG-based measures of sleep tendency.
Continuous and Round-The-Clock Measurements
We have already mentioned continuous EEG studies of sleep and wakefulness as well as those that follow the nominal sleep fraction of 1/3 sleep to 2/3 wakefulness. Such approaches certainly have the advantage of objectivity. These approaches have shown that the factors of diurnal variation in sleep tendency and sleep deprivation can be objectively separated17–19,31and that sleep loss, in general, increases overall sleep tendency but does little to the 24-hour pattern of ups and downs.
Round-the-clock EEG studies, however, are expensive and not easily applicable to the diagnostic or screening purposes demanded by the clinical and public-safety concerns associated with the problem of abnormal sleep tendency. Furthermore, no guidelines are available on how to quantify sleep tendency (in terms of total sleep time, number of sleep episodes, amount of certain sleep phase, etc) or how to differentiate normal from abnormal sleep patterns.
The Multiple Sleep Latency Test
The Multiple Sleep Latency Test (MSLT) is an electroencephalographically based clinical and research tool that was developed at Stanford University.43,44 The technique grew out of studies on the human sleep fraction, namely, the 90-minute day, round-the-clock studies of sleep tendency by Carskadon et al.15 The MSLT was designed to assess sleep tendency only during the day and is ideally performed after a standard night's sleep in the laboratory.
Details of the MSLT protocol have been published elsewhere.43,45 Essential features are that a person who has kept regular sleeping and waking hours before the test spends a night in the sleep laboratory. He or she and is then permitted four, five, or six 20-minute-long opportunities to sleep at 2-hour intervals after getting up in the morning. The sleep latency (time between the point at which the lights are turned out and the first sleep is detected on the EEG) is electroencephalographically determined on each of four or five trials of an MSLT; then a mean sleep latency is calculated and interpreted.
Other parameters, such as duration and type of sleep, may also be determined, depending on whether the MSLT is being used for clinical or research purposes. The average sleep latency for each of the five opportunities to sleep on the MSLT for 17 normal participants originally is reported by Mitler in Table 1 of his 1990 article in Sleep Research.46,47 The order of numbers on the vertical axis has been reversed to make increases in sleep tendency (ie, decreases in sleep latency) go up, thereby facilitating visual comparison among various measures of sleep tendency and performance. By comparing Figures 4 and 5, one can recognize that the MSLT, although not a round-the-clock measure of sleep tendency, does measure the daytime level of sleep tendency and captures the afternoon rise in sleep tendency as well as its subsequent fall toward what Lavie has termed the forbidden zone in the late afternoon and early evening.
TABLE 1.
Individual Models of Hemicircadian Rhythm Shown in Various Studies
| Data sets | Ф-12 hr | SD | r2 |
|---|---|---|---|
| Accident5 | 2.7 | 2.6 | .786 |
| Mortality5 | 4.5 | 4.1 | .451 |
| Driver drowsiness65 | 1.7 | 4.8 | .687 |
| Operators' delays in answering calls1 |
3.4 | 2.0 | .421 |
| Locomotive auto- brakings66 |
1.9 | 2.4 | .832 |
| Meter-reading errors2 |
2.3 | 2.9 | .765 |
| Medians | 2.5 | 2.75 | .684 |
Notes. Ф-12 = phase lag in hours past midnight; SD = a sleep deprivation factor used in the equation; Pearson's r2 = amount of variance in the data that was explained by the model. See Figures 7 and 8. Medians = summary of data sets listed above. Superscripts in data set column indicate references listed in the article.
Figure 5.

Average sleep latency for each of the five opportunities to sleep on the MSLT for 17 normal participants from Table 1 of Mitler.47 The order of numbers on the vertical axis has been reversed to make increases in sleep tendency go up on the vertical axis and facilitate comparison among measures of sleep tendency and performance. The horizontal axis is clock time of a 24-hour day beginning at midnight. The vertical axis represents minutes before sleep onset.
The MSLT is a well-validated research and clinical tool that is used throughout the world,48 and normative values for participants at various ages have been published.33,49 One of the most important features of the MSLT is that it clearly reflects the effects of experimental sleep deprivation,50,51 albeit only for the daytime hours. If prior sleep is reduced from baseline levels, the MSLT shows an increase from baseline levels in sleep tendency.
Unlike round-the-clock techniques for measuring sleep tendency, the MSLT was the first objective tool that could be used on a standardized, widespread basis to address the increased or excessive sleep tendency that arises from sleep loss, drugs, or disease. The MSLT distinguishes between excessively sleepy patients and normal persons43 and can detect the daytime carryover effects of a long-acting sleeping pill.52
Guidelines for the diagnostic use of the MSLT have been -available since 1978; they indicate that an average MSLT sleep latency of less than 5 minutes may be considered pathological43 and an average sleep latency of between 5 and 10 minutes may be considered abnormal or borderline, depending on clinical complaints.53 The major drawbacks of the MSLT are that, although it is less cumbersome to do than a round-the-clock study, it is still quite cumbersome and expensive. In addition, it is not at all suitable as a screening tool to identify abnormally sleepy individuals in a population.
The MSLT is also subject to certain interpretative and conceptual problems when it is used to assess sleep tendency in people who complain of difficulty staying awake: (1) The instructions of the MSLT (“Try to fall asleep”) are counterintuitive to people who have trouble staying awake; (2) a person with a vested interest in appearing normal on the MSLT may ignore the instructions and try to stay awake on each MSLT trial; and (3) the MSLT may not reflect changes in sleep tendency that result from treatment of very sleepy patients who have narcolepsy or sleep apnea, even though the patients report improvement.30
The Maintenance of Wakefulness Test
The Maintenance of Wakefulness Test (MWT) is a variant of the MSLT that was originally devised to obviate some of the interpretative and conceptual problems of the MSLT.54 The person taking the MWT is asked to remain awake and is monitored for electroencephalographic sleep onset. Findings from early MWT studies demonstrated a prolonged sleep latency as a result of the instruction to remain awake, compared with asking the subject to go to sleep, as is done in the MSLT.55 The original MWT used a 20-minute trial conducted five times over the course of a day, beginning about 2 hours after nocturnal sleep ended.
The MWT has been shown to be useful in evaluating the effect of treatment in patients with narcolepsy.47 For a graphic summary of MWT sleep latencies for 8 control participants who were offered five 20-minute-long opportunities to stay awake at 2-hour intervals, beginning at 10 AM, see Figure 6. These data were originally published in Mitler, Gujvarty, and Bowman54 and are replotted in the same format as that of Figure 4 to make comparisons easier. Note that the afternoon increase in sleep tendency is positioned similarly in Figures 4 and 5 and that all sleep latencies are longer on the MWT than on the MSLT.
Figure 6.
MWT sleep latencies for 8 control participants offered five 20-minute-long opportunities to stay awake at 2-hour intervals, beginning at 10 AM. These data were originally published in Mitle54 and are replotted in the same format as Figure 4 to facilitate comparisons.
In 1984, the group at Scripps Clinic lengthened the original MWT's 20-minute trials to 40 minutes because they observed that patients who had histories of daytime sleepiness were too often able to maintain wakefulness for 20 minutes. This “ceiling effect” was diminished with trial lengths of 40 minutes. The 40-minute version of the MWT has now been applied to large numbers of patients with obstructive sleep apnea by at least two independent laboratories,56–58 and normative values for the MWT are available.59
Because this instrument's instructions more directly assess clinical and public-safety concerns and because the MWT seems to detect clinical improvement in sleepy patients who are not completely cured, this test eliminates some of the interpretative problems associated with the MSLT. Furthermore, Poceta et al56 and Sangal et al57,58 have suggested guidelines for normalcy: An MWT sleep latency of less than 15 minutes is considered dangerous for driving an automobile. The Federal Aviation Administration has called for use of the MWT in determining whether non-commercial pilots can be licensed after the diagnosis of sleep apnea has been made.60
Although the MWT may seem to produce a simple prolongation of daytime sleep latencies, detailed comparisons of the MSLT and the MWT have disclosed that the two tests do not correlate well in patients who complain of excessive sleepiness. The two tests may actually measure different abilities.57,58 For example, some patients with very short MSLT sleep latencies are consistently able to stay awake on 40-minute MWT trials. Others patients cannot sleep on MSLT trials, but fall asleep quickly on MWT trials. Significant limitations of the MWT include the following: (1) It is as cumbersome and expensive as the MSLT; (2) there are no normative data for both sexes at various age groups; (3) there is marked discordance with the MSLT, the primary and most widely used electroencephalographic measure of sleep tendency; and (4) no data are available concerning MWT responsiveness to experimental sleep deprivation.
Other methods for electroencephalographically measuring daytime sleep tendency have been developed. Erman and colleagues61 attempted to obviate the separate problems of the MSLT and the MWT by combining both tests. They studied 20 narcoleptic participants with the Modified Assessment of Sleepiness Test (MAST), which consisted of three sleep-in-bed conditions interspersed with two reading-in-chair conditions. Although the test is ingenious, the problems of expense and lack of normative data are still severe limitations to any laboratory-based strategy.
Computerized EEG Studies
The widespread application of computer technology to EEG monitoring has led to important new approaches for measuring sleep tendency. For example, the quantitative analysis of EEG delta activity has long been thought to reflect the physiological tendency for sleep and does increase in response to experimental sleep deprivation.62 Hasan et al63 have suggested a method of computer analysis that may automatically detect drowsiness in MSLT-like settings. Others, such as Broughton,21 have applied event related potential technologies to the assessment of sleep tendency. Although these technologically advanced approaches to measuring sleep tendency hold promise, they have not yet been shown to be useful in general clinical applications or as methods of screening individuals for abnormal sleep tendencies.
Model of the Two-Peak Pattern in Sleep Tendency
The ideal measure of sleep tendency would have to be physiologically based, rapid, and suitable for multiple determinations throughout the day. Perhaps a chemical may eventually be found in blood or urine that correlates satisfactorily enough with sleep tendency to be used as a universal measure and as a screen. In the meantime, predictive mathematical models offer some promise, at least as conceptual tools.
The first author of this article (MMM) serendipitiously observed that a combination of the population growth function and the cosine function could be made to produce a distortion of the cosine curve that resembled the 24-hour, two-peak pattern in human error and disease-related mortality.46,64 In our work to date, this combination, which is expressed as a mathematical model of sleep tendency in formula 2 in Mitler,64(p72) approximates well the temporal distributions of a variety of sleep- and performance-related data.
The equation accounted for 79% of the variance in the observed frequency of occurrence (Figure 7A) for more than 6,000 fatigue-related auto accidents throughout the 24 hours.5 Similarly, for more than 437,000 human deaths,5 the equation accounted for 45% of the observed variance (Figure 7B).
Figure 7.

Curve fits to (A) accident5 and (B) mortality5 data, and to (C) driver drowsiness data65 with percentage of variance explained for each curve fit. Parameter values are shown in Table 1.
The variance in some other 24-hour observations may be explained reasonably well by this equation. It explained 69% of the variance in the frequency of falling asleep while driving65 (Figure 7C), but only 42% of the variance in the duration of switchboard operators' delays in answering calls1 (Figure 8A). The model fits better for the last two entries in Figure 8, accounting for 83% of the variance in error-of-omission locomotive brakings66 (Figure 8B) and 76% of the variance in gas meter reading errors2 (Figure 8C).
Figure 8.

Curve fits to (A) operators' delays in answering calls,1 (B) locomotive auto-braking data,66 and (C) meter reading error data.2 with percentage of variance explained for each curve fit. Parameter values in Table 1.
It appeared that data from tasks demanding vigilance (accidents, driver drowsiness, locomotive auto-brakings, and meter-reading errors) produced better curve fits than data from other sources (mortality and delays in answering calls). For the individual models, see Table 1. The phase lag constant (Φ–12) shown in the table is the number of hours following midnight at which the larger of the two peaks occurs. We subtract 12 hours from the actual value (ø) that is used in the equation so that it is easy for the reader to imagine the placement of the large peak in the midnight-to-dawn period. The sleep deprivation (SD) constant in the table controls the size of the secondary peak relative to the larger peak.
We recognize that the SD factor is difficult to evaluate in the 24-hour data available. First, the data are from normal field populations. Second, few or no 24-hour data are available on experimentally or systematically varied total sleep times or shift-work patterns. This modeling approach, however, seems to be consistent with the sleep deprivation data of Lavie and Segal,31 using the ultrashort sleep-wake cycle protocol. Figure 9 and Figure 10 are from five of Lavie and Segal's “morning” participants (ie, participants self-characterized as most alert in the morning) who were studied after normal nocturnal sleep and after 24 hours of sleep deprivation. Participants were permitted to sleep 7 minutes out of every 20 around the clock, beginning at 7 AM.
Figure 9.

Minutes of sleep each hour for five “morning” participants studied after normal nocturnal sleep. Participants were permitted to sleep 7 minutes out of every 20 round the clock, beginning at 7 AM. See Lavie and Segal31 for details.
Figure 10.

Minutes of sleep each hour for five “morning” participants studied after 24 hours of total sleep deprivation. Participants were permitted to sleep 7 minutes out of every 20 round the clock, beginning at 7 AM. See Lavie and Segal31 for details.
Note that sleep deprivation seems to (1) leave unchanged the location of the temporal distribution of peaks in sleep tendency, (2) increase the amplitude and the breadth of the nocturnal peak, (3) increase the amplitude and the breadth of the afternoon peak while keeping constant the relative sizes of the two peaks, and (4) reverse the trend from wakefulness toward sleepiness between 7 AM and noon.
Accordingly, in our model, the SD's effect on afternoon sleep tendency is asymptotic so that progressive increases in values of SD have less and less influence on the height of the afternoon peak. Clearly, further testing of our model must include systematic experiments on extended and restricted sleep durations to determine whether or not resulting distortions in the two peaks match those predicted by proportionate changes in SD.
The six activities listed in Table 1 can be linked along some underlying continuum that we have labeled SD. Consider how the activities differ along several dimensions. With respect to cause, mortality may differ from the other five examples, being predisposed by disease states rather than by sleep deprivation. However, we have implied that some factor associated with sleep is also implicated in the mortality pattern as an acute precipitator of expiration.
It seems that the top two items listed in the table (driver drowsiness, mortality) have more severe outcomes (injury, death) than the bottom two (inconvenience without or with little hazard; locomotive auto-brakings seem to be more like an embarrassment to the engineer than a hazard). The middle two items seem reversed with respect to outcomes, and perhaps accidents and driver drowsiness should be closer together.
We may consider the levels of susceptibility to sleepiness associated with the six activities. Perhaps driver drowsiness and death are the least avoidable items in the list. Certainly, turning back a disease state is difficult. Also, because of the human brain's inability to deal well with boring tasks, driver drowsiness on the highway appears difficult to deal with.67 The accompanying article by Rosekind et al (pps 157–165) includes suggestions for prevention and for countermeasures.
The meter-reading errors, accidents, and operator delays cited here may have been less susceptible to sleepiness than the first two tasks by virtue of greater human involvement in the task. That leaves the locomotive cab, where engineer-alerting devices may have had at least a marginal effect in preventing drowsiness. Perhaps analogous devices may be placed in commercial vehicles on the highway. Compared with the above-mentioned arguments for cause and effect, the argument for susceptibility to sleepiness seems slightly stronger in explaining the general rank order of the values assigned to SD in Table 1.
The median time of occurrence of the larger peak for the six curve fits we have mentioned here was 2.5 hours after midnight. The median standard deviation was 2.75. The mean proportion of variance explained (mean squared Pearson r via Fisher z transforms) was .684. The composite model is shown in Figure 11.
Figure 11.

“Idealized” curve from medians of parameter values Ф and SD in Table 1.
Although the ability to fit a function to data relatively successfully is without novelty, the particular function used here may be instructive. There should be a molecular basis for the predictive power of this cosine-population function. Both circadian factors and fluctuations in sleep tendency depend upon the actual numbers of receptor populations in the brain important for the behavioral expression of sleep. Thus, the function may provide a model for investigations of neuronal recruiting.
Our equations suggest that the hemicircadian rhythm may involve only a single pacemaker. Each mathematical function used can be accomplished by neurons associated with and modifying a single pacemaker. Because sleep deprivation is incorporated into the model, there is hope to apply the model, not only to normal populations, but also to individuals. This application to individuals may allow some discrimination of abnormal sleepiness arising from sleep deprivation or sleep pathology from normal sleepiness at certain times of the day. We encourage further testing, elaborations, and criticism of the equation by all with appropriate data.
NOTE
We wish to acknowledge Drs Peretz Lavie, Robert Norman, and Joyce Walsleben for their critical reading of this article and their helpful suggestions. Dr Miller also wishes to express his thanks to the late Dr Robert R. Mackie for stimulating his interest in the data discussed in this article.
REFERENCES
- 1.Browne RC. The day and night performance of teleprinter switchboard operators. Occup Psychol. 1949;23:1–6. [Google Scholar]
- 2.Bjerner B, Holm A, Swenson A. Diurnal variation in mental performance: A study of three-shift workers. Br J Industrial Med. 1955;12:103–130. doi: 10.1136/oem.12.2.103. [DOI] [PMC free article] [PubMed] [Google Scholar]
- 3.Broughton RJ. Biorhythmic variations in consciousness and psychological functions. Can Psychol Reviews. 1975;16:217–230. [Google Scholar]
- 4.Broughton RJ. Chronobiological aspects and models of sleep and napping. In: Dinges DF, Broughton RJ, editors. Sleep and Alertness: Chronobiological, Behavioral and Medical Aspects of Napping. New York: Raven; 1989. pp. 71–98. [Google Scholar]
- 5.Mitler MM, Carskadon MA, Czeisler CA, Dement WC, Dinges DF, Graeber RC. Catastrophes, sleep, and public policy: Consensus report. Sleep. 1988;11:100–109. doi: 10.1093/sleep/11.1.100. [DOI] [PMC free article] [PubMed] [Google Scholar]
- 6.Langlois PH, Smolensky MH, Hsi BP, Weir FW. Temporal patterns of reported single-vehicle car and truck accidents in Texas, USA during 1980-1983. Chronobiologia. 1985;2:131–140. doi: 10.3109/07420528509055552. [DOI] [PubMed] [Google Scholar]
- 7.Lavie P, Wollma M, Pollack I. Frequency of sleep-related traffic accidents and hour of the day. Sleep Research. 1986;15:275. [Google Scholar]
- 8.Duff GW. Accidents on The New York State Throughway. Unpublished report to the governor of New York; 1985. [Google Scholar]
- 9.Eastman C. Are separate temperature and activity oscillators necessary to explain the phenomena of human circadian rhythms? In: Moore-Ede MC, Czeisler CA, editors. Mathematical Models of the Circadian Sleep-Wake Cycle. New York: Raven; 1984. pp. 81–103. [Google Scholar]
- 10.US Congress Office of Technology Assessment . Biological Rhythms: Implications for the Worker. Washington, DC.: US Government Printing office; 1991. [Google Scholar]
- 11.Mitler MM, Hajdukovic RM, Shafor R, Hahn PM, Kripke DF. When people die. Cause of death versus time of death. Am J Med. 1987;82:266–274. doi: 10.1016/0002-9343(87)90067-2. [DOI] [PMC free article] [PubMed] [Google Scholar]
- 12.Smolensky M, Halberg F, Sargent F. Chronobiology of the life sequence. In: Ito S, Ogata K, Yoshimura H, editors. Advances in Climatic Physiology. Tokyo: Igaku Shoin; 1972. pp. 281–318. [Google Scholar]
- 13.Rechtschaffen A, Kales A. A Manual of Standardized Terminology, Techniques and Scoring System for Sleep Stages of Human Participants. Bethesda, MD: 1968. National Institute of Neurological Diseases and Blindness (NIH Pub 204) [DOI] [PubMed] [Google Scholar]
- 14.Weitzman ED, Nogeire C, Perlow M, et al. Effects of a prolonged 3-hour sleep-wake cycle on sleep stages, plasma cortisol, growth hormone and body temperature in man. J Clin Endocrinol Metab. 1974;38:1018–1030. doi: 10.1210/jcem-38-6-1018. [DOI] [PubMed] [Google Scholar]
- 15.Carskadon M, Dement W. Sleep studies on a 90-minute day. Electroencephalogr Clin Neurophysiol. 1975;39:145–155. doi: 10.1016/0013-4694(75)90004-8. [DOI] [PubMed] [Google Scholar]
- 16.Webb WB, Agnew HW., Jr. Sleep efficiency for sleep-wake cycles of varied length. Psychophysiology. 1975;12:637–641. doi: 10.1111/j.1469-8986.1975.tb00063.x. [DOI] [PubMed] [Google Scholar]
- 17.Lavie P, Scherson A. Ultrashort sleep-waking schedule. I. Evidence of ultradian rhythmicity in “sleepability.”. Electroencephalogr Clin Neurophysiol. 1981;52:163–174. doi: 10.1016/0013-4694(81)90164-4. [DOI] [PubMed] [Google Scholar]
- 18.Lavie P, Zomer J. Ultrashort sleep-waking schedule. II. Relationship between ultradian rhythms in sleepability and the REM-NONREM cycles and effects of the circadian phase. Electroencephalogr Clin Neurophysiol. 1984;57:35–42. doi: 10.1016/0013-4694(84)90006-3. [DOI] [PubMed] [Google Scholar]
- 19.Lavie P. Ultrashort sleep-waking schedule. III. Gates and “forbidden zones” for sleep. Electroencephalogr Clin Neurophysiol. 1986;63:414–425. doi: 10.1016/0013-4694(86)90123-9. [DOI] [PubMed] [Google Scholar]
- 20.Offenbacher H, Korner E, Reinhart B, et al. Mobile long-term EEG monitoring in generalized seizure disorders of different etiology. Eur Neurol. 1986;25:146–153. doi: 10.1159/000116096. [DOI] [PubMed] [Google Scholar]
- 21.Torsvall L, Akerstedt T, Gillander K, Knutsson A. Sleep on the night shift: 24-hour EEG monitoring of spontaneous sleep1 wake behavior. Psychophysiology. 1989;26:352–358. doi: 10.1111/j.1469-8986.1989.tb01934.x. [DOI] [PubMed] [Google Scholar]
- 22.Schaefer KE, Clegg BR, Carey CR, Dougherty JHJ, Weybrew BB. Effect of isolation in a constant environment on periodicity of physiologycal functions and performance levels. Aerospace Med. 1967;38:1002–1018. [PubMed] [Google Scholar]
- 23.Campbell SS, Zulley J. In: Napping in time-free environments. Sleep and Alertness: Chronobiological, Behavioral, and Medical Aspects of Napping. Dinges DF, Broughton RJ, editors. New York: Raven; 1989. pp. 121–138. [Google Scholar]
- 24.Kripke DF. Biological rhythms disturbances might cause narcolepsy. In: Guilleminault C, Dement WC, Passouant P, editors. Narcolepsy. New York: Spectrum; 1976. pp. 475–483. [Google Scholar]
- 25.Baldy-Moulinier M, Arguner A, Besset A. Ultradian and circadian rhythms in sleep and wakefulness. In: Guilleminault C, Dement WC, Passouant P, editors. Narcolepsy. New York: Spectrum; 1976. pp. 485–498. [Google Scholar]
- 26.Billiard M, Salva MQ, De-Koninick J, Besset A, Touchon J, Cadilhac J. Daytime sleep characteristics and their relationships with night sleep in the narcoleptic patient. Sleep. 1986;9:167–174. doi: 10.1093/sleep/9.1.167. [DOI] [PubMed] [Google Scholar]
- 27.Broughton R, Dunham W, Newman J, Lutley K, Duschesne P, Rivers M. Ambulatory 24-hour sleep-wake monitoring in narcolepsy-cataplexy compared to matched controls. Electroencephalogr Clin Neurophysiol. 1988;70:473–481. doi: 10.1016/0013-4694(88)90145-9. [DOI] [PubMed] [Google Scholar]
- 28.Pollak CP, Perlick D, Linsner JP, Wenston J, Hsieh F. Sleep problems in the community elderly as predictors of death and nursing home placement. J Community Health. 1990;15:123–135. doi: 10.1007/BF01321316. [DOI] [PubMed] [Google Scholar]
- 29.Pollak CP, Wagner DR, Moline ML, Monk TH. Cognitive and motor performance of narcoleptic and normal participants living in temporal isolation. Sleep. 1992;15:202–211. doi: 10.1093/sleep/15.3.202. [DOI] [PubMed] [Google Scholar]
- 30.Mitler MM, Gujavarty KS, Sampson MG, Browman CP. Multiple daytime nap approaches to evaluating the sleepy patient. Sleep. 1982;5:S119–127. doi: 10.1093/sleep/5.s2.s119. [DOI] [PubMed] [Google Scholar]
- 31.Lavie P, Segal S. Twenty-four-hour structure of sleepiness in morning and evening persons investigated by ultrashort sleep-wake cycle. Sleep. 1989;12:522–528. [PubMed] [Google Scholar]
- 32.Richardson GS, Carskadon MA, Orav EJ, Dement WC. Circadian variation in sleep tendency in elderly and young adult participants. Sleep. 1982;5:s82–s92. doi: 10.1093/sleep/5.s2.s82. [DOI] [PubMed] [Google Scholar]
- 33.Carskadon MA. Patterns of sleep and sleepiness in adolescents. Pediatrician. 1990;17:5–12. [PubMed] [Google Scholar]
- 34.Kleitman N. Sleep and Wakefulness. Chicago: University of Chicago Press; 1963. [Google Scholar]
- 35.Hoddes E, Zarcone V, Smythe H, Phillips R, Dement WC. Quantification of sleepiness: A new approach. Psychophysiology. 1973;10:431–436. doi: 10.1111/j.1469-8986.1973.tb00801.x. [DOI] [PubMed] [Google Scholar]
- 36.Dement WC, Carskadon MA, Richardson GS. Excessive daytime sleepiness in the sleep apnea syndrome. In: Guilleminault C, Dement WC, editors. Sleep Apnea Syndromes. New York: Alan R. Liss; 1978. pp. 23–46. [Google Scholar]
- 37.Johns MW. A new method for measuring daytime sleepiness: The Epworth Sleepiness Scale. Sleep. 1991;14:540–545. doi: 10.1093/sleep/14.6.540. [DOI] [PubMed] [Google Scholar]
- 38.Johns MW. Reliability and factor analysis of the Epworth Sleepiness Scale. Sleep. 1992;15:376–381. doi: 10.1093/sleep/15.4.376. [DOI] [PubMed] [Google Scholar]
- 39.Lowenstein O, Loewenfeld I. Electronic pupillography—A new instrument and some clinical applications. Arch Opthalmol. 1958;59:352–363. [PubMed] [Google Scholar]
- 40.Schmidt HS, Fortin L. Electronic pupillography in disorders of arousal. In: Guilleminault C, editor. Sleeping and Waking Disorders: Indications and Techniques. Menlo Park, CA: Addison- Wesley; 1982. pp. 127–143. [Google Scholar]
- 41.Yoss RE. Treatment of narcolepsy. Modem Treatment. 1969;6:1263–1274. [PubMed] [Google Scholar]
- 42.Carskadon MA, Dement WC, Mitler MM, Guilleminault C, Zarcone VP, Spiegel R. Self-reports versus sleep laboratory findings in 122 drug-free participants with a complaint of chronic insomnia. Am J Psychiatry. 1976;133:1382–1388. doi: 10.1176/ajp.133.12.1382. [DOI] [PubMed] [Google Scholar]
- 43.Richardson GS, Carskadon MA, Flagg W, Van den Hoed J, Dement WC, Mitler MM. Excessive daytime sleepiness in man: Multiple sleep latency measurement in narcoleptic and control participants. Electroencephalogr Clin Neurophysiol. 1978;45:621–627. doi: 10.1016/0013-4694(78)90162-1. [DOI] [PMC free article] [PubMed] [Google Scholar]
- 44.Mitler MM, Van den Hoed J, Carskadon MA, et al. REM sleep episodes during the Multiple Sleep Latency Test in narcoleptic patients. Electroencephalogr Clin Neurophysiol. 1979;46:479–481. doi: 10.1016/0013-4694(79)90149-4. [DOI] [PMC free article] [PubMed] [Google Scholar]
- 45.Carskadon MA, Dement WC, Mitler MM, Roth T, Westbrook PR, Keenan S. Guidelines for the multiple sleep latency test (MSLT): A standard measure of sleepiness. Sleep. 1986;9:519–524. doi: 10.1093/sleep/9.4.519. [DOI] [PubMed] [Google Scholar]
- 46.Mitler MM. Two-peak 24-hour patterns in sleep, mortality and error. Sleep Research. 1990;19:399. [Google Scholar]
- 47.Mitler MM, Hajdukovic R, Erman M, Koziol JA. Narcolepsy. J Clin Neurophysiol. 1990;7:93–118. doi: 10.1097/00004691-199001000-00008. [DOI] [PMC free article] [PubMed] [Google Scholar]
- 48.Thorpy MJ. Report from the American Sleep Disorders Association. The clinical use of the Multiple Sleep Latency Test. Sleep. 1992;15:268–276. doi: 10.1093/sleep/15.3.268. [DOI] [PubMed] [Google Scholar]
- 49.Carskadon MA, Harvey K, Duke P, Anders TF, Litt IF, Dement WC. Pubertal changes in daytime sleepiness. Sleep. 1980;2:453–460. doi: 10.1093/sleep/2.4.453. [DOI] [PubMed] [Google Scholar]
- 50.Carskadon MA, Dement WC. Nocturnal determinants of daytime sleepiness. Sleep. 1982;5:S73–S81. doi: 10.1093/sleep/5.s2.s73. [DOI] [PubMed] [Google Scholar]
- 51.Carskadon MA, Dement WC. Cumulative effects of sleep restriction on daytime sleepiness. Psychophysiology. 1981;18:107–113. doi: 10.1111/j.1469-8986.1981.tb02921.x. [DOI] [PubMed] [Google Scholar]
- 52.Mitler MM, Seidel WF, van den Hoed J, Greenblatt DJ, Dement WC. Comparative hypnotic effects of flurazepam, triazolam, and placebo: A long-term simultaneous nighttime and daytime study. J Clin Psychopharmacol. 1984;4:2–13. [PubMed] [Google Scholar]
- 53.Diagnostic Classification Steering Committee. Thorpy M, Chairman . International Classification of Sleep Disorders: Diagnostic and Coding Manual. Rochester, MN: American Sleep Disorders Association; 1990. [Google Scholar]
- 54.Mitler MM, Gujavarty KS, Browman CP. Maintenance of wakefulness test: a polysomnographic technique for evaluation treatment efficacy in patients with excessive somnolence. Electroencephulogr Clin Neurophysiol. 1982;53:658–661. doi: 10.1016/0013-4694(82)90142-0. [DOI] [PMC free article] [PubMed] [Google Scholar]
- 55.Hartse KM, Roth T, Zorick FJ. Daytime sleepiness and daytime wakefulness: The effect of instruction. Sleep. 1982;5:s107–s118. doi: 10.1093/sleep/5.s2.s107. [DOI] [PubMed] [Google Scholar]
- 56.Poceta JS, Timms RM, Jeong DU, Ho SL, Erman MK, Mitler MM. Maintenance of wakefulness test in obstructive sleep apnea syndrome [see comments] Chest. 1992;101:893–897. doi: 10.1378/chest.101.4.893. [DOI] [PubMed] [Google Scholar]
- 57.Sangal RB, Thomas L, Mitler MM. Disorders of excessive sleepiness. Treatment improves ability to stay awake but does not reduce sleepiness. Chest. 1992;102:699–703. doi: 10.1378/chest.102.3.699. [DOI] [PubMed] [Google Scholar]
- 58.Sangal RB, Thomas L, Mitler MM. Maintenance of wakefulness test and multiple sleep latency test. Measurement of different abilities in patients with sleep disorders [see comments]. Chest. 1992;101:898–902. doi: 10.1378/chest.101.4.898. [DOI] [PubMed] [Google Scholar]
- 59.Doghramji K, Mitler M, Sangal RB, et al. A normative study of the Maintenance of Wakefulness Test (MWT): Preliminary report. Sleep Research. 1996;25 doi: 10.1016/s0013-4694(97)00010-2. In press. [DOI] [PMC free article] [PubMed] [Google Scholar]
- 60.Sleep Apnea Evaluation Specifications . Federal Aviation Administration Specification Letter Dated October 6, 1992. US Dept of Transportation: 1992. [Google Scholar]
- 61.Erman M, Beckham B, Gardner D, Roffwarg H. The modified assessment of sleepiness test (MAST) Sleep Research. 1987;16:550. [Google Scholar]
- 62.Borbely AA, Baumann F, Brandeis D, Strauch I, Lehmann D. Sleep deprivation: Effect on sleep stages and EEG power density in man. Electroencephalogr Clin Neurophysiol. 1981;S1:483–493. doi: 10.1016/0013-4694(81)90225-x. [DOI] [PubMed] [Google Scholar]
- 63.Hasan J, Hirvonen K, Varri A, Hakkinen V, Loula P. Validation of computer analysed polygraphic patterns during drowsiness and sleep onset. Electroencephalogr Clin Neurophysiol. 1993;87:117–127. doi: 10.1016/0013-4694(93)90118-f. [DOI] [PubMed] [Google Scholar]
- 64.Mitler MM. Two-peak 24-hour patterns in sleep, mortality and error. In: Peter JH, Penzel T, Podszus T, von Wichert P, editors. Sleep and Health Risk. Berlin: Springer-Verlag; 1991. pp. 65–77. [Google Scholar]
- 65.Prokop O, Prokop L. Ermudung und einschlafen am steuer. Dtsch Z Gerichtl Med. 1955;44:343–355. [PubMed] [Google Scholar]
- 66.Hildebrandt G, Rohmert W, Rutenfranz J. 12 and 24 h rhythms in error frequency of locomotive drivers and the influence of tiredness. Int J Chronobiology. 1974:2175–180. [PubMed] [Google Scholar]
- 67.Mackie RR, Miller JC. Effects Of Hours of Service, Regularity of Schedules, and Cargo Loading on Truck and Bus Driver Fatigue. Goleta, CA: Human Factors Research; 1978. [Google Scholar]