

Abstract
This PDF receipt will only be used as the basis for generating PubMed Central (PMC) documents. PMC documents will be made available for review after conversion (approx. 2–3 weeks time). Any corrections that need to be made will be done at that time. No materials will be released to PMC without the approval of an author. Only the PMC documents will appear on PubMed Central -- this PDF Receipt will not appear on PubMed Central.
Previous studies have delineated the neural processes of motor response inhibition during a stop signal task, with most reports focusing on the cortical mechanisms. A recent study highlighted the importance of sub-cortical processes during stop signal inhibition in 13 individuals and suggested that the subthalamic nucleus (STN) may play a role in blocking response execution (Aron and Poldrack, 2006). Here in a functional magnetic resonance imaging (fMRI) study we replicated the finding of greater activation in the STN during stop (success or error) trials, compared to go trials, in a larger sample of subjects (n=30). However, since a contrast between stop and go trials involved processes that could be distinguished from response inhibition, the role of subthalamic activity during stop signal inhibition remained to be specified. To this end we followed an alternative strategy to isolate the neural correlates of response inhibition (Li et al., 2006a). We compared individuals with short and long stop signal reaction time (SSRT) as computed by the horse race model. The two groups of subjects did not differ in any other aspects of stop signal performance. We showed greater activity in the short than the long SSRT group in the caudate head during stop successes, as compared to stop errors. Caudate activity was positively correlated with medial prefrontal activity previously shown to mediate stop signal inhibition. Conversely, bilateral thalamic nuclei and other parts of the basal ganglia, including the STN, showed greater activation in subjects with long than short SSRT. Thus, fMRI delineated contrasting roles of the prefrontal-caudate and striato-thalamic activities in mediating motor response inhibition.
Keywords: basal ganglia, thalamus, impulsivity, no-go, neuroimaging, inhibitory control
Introduction
Motor response inhibition and the stop signal task
Response inhibition allows flexible motor acts in changing environment. The stop signal task (SST) has been widely used to investigate the behavioral and neural processes of motor response inhibition (Logan, 1994; Logan and Cowan, 1984). In the SST, there are two different types of trials: “go” and “stop.” In the go trials, participants are required to respond to an imperative stimulus within a time window and, because the majority of the trials are go trials, they set up a prepotent response tendency. In the stop trials, an additional stop signal instructs participants to withhold their response. The rationale is that, when response inhibition is in place, participants are able to stop upon seeing the stop signal, resulting in a stop success. However, successful performance in the SST depends on a number of other cognitive processes in addition to response inhibition. For instance, one needs to monitor for the stop signal in order to initiate the inhibitory process in time to offset the prepotent tendency to respond during stop trials. Moment-by-moment lapses in attention as can occur when one is under-motivated or distracted make one prone to stop errors. Furthermore, because go trials appear more frequently than stop trials, an “impulsive” thought that no stop signal will follow the go signal leads to the execution of a response without a concurrent process of outcome monitoring. These psychological processes influence stop signal performance but do not necessarily reflect one’s capacity of response inhibition (Li et al., 2006a).
Logan and colleagues have developed algorithms to derive a reliable measure of response inhibition, independent of these psychological variables (Logan, 1994; Logan and Cowan, 1984). For instance, with a tracking procedure in which the time delay between the stop and go signals (stop signal delay or SSD) varied trial by trial according to participant’s performance, investigators can estimate the stop signal reaction time (SSRT) – a counterpart of the go trial RT – on the basis of a horse race model (Logan, 1994). Recent work that takes into account the interaction between go and stop processes in the race model further solidifies the use of SSRT as an index of response inhibition function (Boucher et al., 2007).
Isolating the neural correlates of response inhibition during the SST
Previous neuroimaging studies employing the SST have examined the cortical processes of response inhibition (Aron and Poldrack, 2006; Li et al., 2006a; Liddle et al., 2002; Rubia et al., 2003; Rubia et al., 2005). Of critical interest are the different paradigms and contrasts investigators have used to isolate response inhibition. Because fMRI studies employing a block design were vulnerable to a number of important confounds (Aron and Poldrack, 2005), we focused the discussions on event-related paradigms. For instance, using a tracking procedure and contrasting brain activations associated with stop success (SS) and stop error (SE) trials, Rubia and colleagues observed greater activation in the inferior frontal cortices during SS, compared to SE, trials (Rubia et al., 2003; 2005). However, as mentioned in the above, this contrast did not control for differences in signal monitoring, post-response processing (as, for instance, SS and SE trials are each subjectively rewarding and frustrating), and motor-related processes. Successful performance in the SST requires sustained attention and constant monitoring for the stop signal. Lapses in attention or failures in monitoring cause inhibition failures, for example, when one responds to the go signal, assuming no stop signal will follow. Therefore, by contrasting successful and failed inhibitions, one might simply be isolating activations related to such signal monitoring process (Li et al., 2006a).
Other investigators compared stop and go trials to isolate the neural processes of stop signal inhibition (Aron and Poldrack, 2006; Chevrier et al., In Press; Liddle et al., 2002; Pliszka et al., 2006). A rationale for this contrast perhaps is that the stop but not go process involves response inhibition. Compared to go trials, however, stop trials evoked more complicated perceptual signal processing. The visual/auditory processing of the stop signal admittedly is the starting point of a series of processes leading to response inhibition but it is not identical to response inhibition. Furthermore, response inhibition is not invariably evoked during stop trials, and subjects succeed or fail in inhibitions depending on whether this capacity is in place. Comparing stop and go trials without distinguishing stop success and error seems to be inconsistent with the underlying rationale of the SST. Thus, Curtis and colleagues observed greater activation in the frontal eye field during stop, compared to go, trials in an oculomotor countermanding task, and suggested that this may reflect concurrent activation of the go (saccade) and stop (fixation) motor processes within this brain region (Curtis et al., 2005). Without showing differences between successful and failed inhibitions, the activity in frontal eye field falls short of addressing the process of response inhibition and determining the trial outcome.
Subcortical correlates of motor response inhibition
Subcortical structures and the basal ganglia, in particular, have been implicated in the regulation of both simple and complex motor acts (David et al., 2005; DeLong, 2000; Graybiel, 2005; Hikosaka, 2007; Romanelli et al., 2005; Seger, 2006; Tan et al., 2006). Dysfunction in the circuitry involving these subcortical structures has been implicated in a number of neurological conditions, including Parkinson’s disease and attention deficit hyperactivity disorder (Bevan et al., 2006; DeLong and Wichmann, 2007; Mehler-Wex et al., 2006; Robbins et al., 2007). Among the subcortical structures, the subthalamic nucleus (STN) has received much attention because of its role in the pathogenesis and treatment of Parkinson’s disease (Benabid, 2003; Bevan et al., 2006; Breit et al., 2004; Grafton et al., 2006; Hamani et al., 2005; Perlmutter and Mink, 2006). Deep brain stimulation (DBS) of the STN appeared to alleviate dyskinesia and other motor symptoms in patients with Parkinson’s disease (Breit et al., 2004; Grafton et al., 2006; Hamani et al., 2005; Perlmutter and Mink, 2006). Although a reduction of excessive inhibitory activity in the STN may mediate the treatment effects, the therapeutic mechanisms of DBS remain to be elucidated. It would thus be of great interest to further explore the role of the STN and other subcortical processes in motor response inhibition in an imaging setting.
A recent study investigated the effects of DBS on the performance of patients with Parkinson’s disease during a choice SST and a go/no-go task (van den Wildenberg et al., 2006). The results showed that DBS of the STN was associated with enhanced inhibitory control, as indicated by a shorter SSRT. Interestingly, the stimulation also improved the choice go trial RT during the SST but did not affect the simple go trial RT during the go/no-go task. Thus, it appears that the STN plays a role not only in inhibiting but also in generating a motor response (van den Wildenberg et al., 2006). Another recent experiment employed fMRI to examine the cortical and subcortical mechanisms of response inhibition during a SST (Aron and Poldrack, 2006). Testing the hypothesis that the STN suppresses the “direct” fronto-striatal pathway activated by response initiation (the “go” process), these investigators showed greater activation in the STN during stop trials (both stop successes and errors), compared to go trials (Aron and Poldrack, 2006). Furthermore, they demonstrated greater activation in the STN in subjects with short, compare to those with long, SSRT (though it was not clear whether the two groups differed significantly in SSRT). Overall, these results suggest a role of the STN in stop signal performance. In particular, the latter finding of SSRT-associated activity in the STN could indicate a more specific role of the STN in motor response inhibition, as described by the horse race model.
Goals of the current study
Here we aimed to examine thalamic and basal ganglia activities that may mediate stop signal inhibition, as computed by the race model. Our earlier work demonstrated that men and women may show important differences in the neural processes underlying stop signal performance (Li et al., 2006b); thus, we focused here on the results obtained in a group of 30 adult men subjects. We contrasted SS vs. SE for individual subjects to account for stimulus condition between trial types. In random effect analysis, we contrasted short vs. long SSRT groups of individuals who are identical in all other aspects of stop signal performance including stop success rate, thus accounting for the extent of attentional monitoring, in order to isolate the neural correlates of response inhibition (Logan et al., 1994). The regions of interest (ROIs) included bilateral caudate nucleus, putamen, pallidum, and STN. Thus, these ROIs broadly encompass the subcortical elements of the cortical-basal ganglia-thalamic loop widely implicated in motor control (DeLong, 1990; DeLong, 2000). We broadly hypothesized that these structures demonstrate different activity between individuals with short and long SSRT. Specifically, greater STN activity in the short, as compared to the long, SSRT group would replicate the findings of Aron and Poldrack, 2006. On the other hand, greater STN activity in the long, as compared to the short, SSRT group would be consistent with overactivity of the basal ganglia circuitry in patients with Parkinson’s disease, who are known to be impaired in flexible behavioral performance including showing prolonged SSRT in the stop signal task (Gauggel et al., 2004).
Materials and Methods
Subjects and behavioral task
Thirty male adults (22–45 years of age, all right-handed and using their right thumb to respond) were paid to participate in the study. All subjects signed a written consent after details of the study were explained, in accordance to institute guidelines and procedures approved by the Yale Human Investigation Committee.
We employed a simple reaction time task in this stop-signal paradigm (Li et al., 2006a; Logan and Cowan, 1984; Fig. 1). There were two trial types: “go” and “stop,” randomly intermixed. A small dot appeared on the screen to engage attention and eye fixation at the beginning of a go trial. After a randomized time interval (fore-period) anywhere between 1 and 5 s, the dot turned into a circle (the “go” signal), which served as an imperative stimulus, prompting the subjects to quickly press a button. The circle vanished at button press or after 1 s had elapsed, whichever came first, and the trial terminated. A premature button press prior to the appearance of the circle also terminated the trial. Three quarters of all trials were go trials. The remaining one quarter were stop trials. In a stop trial, an additional “X,” the “stop” signal, appeared after and replaced the go signal. The subjects were told to withhold button press upon seeing the stop signal. Likewise, a trial terminated at button press or when 1 s had elapsed since the appearance of the stop signal. Clearly it would be easier for the subject to withhold the response if the stop signal appeared immediately or early after the go signal, and the reverse applied if the time interval between the stop and the go signals (or the stop-signal delay, SSD) was extended. The SSD started at 200 ms and varied from one stop trial to the next according to a staircase procedure: if the subject succeeded in withholding the response, the SSD increased by 64 ms; conversely, if they failed, SSD decreased by 64 ms (De Jong et al., 1990; Levitt, 1970). There was an inter-trial-interval of 2 s. Subjects were instructed to respond to the go signal quickly while keeping in mind that a stop signal could come up in a small number of trials. Prior to the fMRI study each subject had a practice session outside the scanner. In the scanner each subject completed four 10-min runs of the task with the SSD updated manually across runs. Depending on the actual stimulus timing (trial varied in fore-period duration) and speed of response, the total number of trials varied slightly across subjects in an experiment. With the staircase procedure we anticipated that the subjects succeeded in withholding their response in approximately half of the stop trials.
FIGURE 1.

(a) stop signal paradigm. In “go or G” trials (75%) observers responded to the go signal (a circle) and in “stop” trials (25%) they had to withhold the response when they saw the stop signal (an X). In both trials the go signal appeared after a randomized time interval between 1 to 5 s (the fore-period or FP, uniform distribution) following the appearance of the fixation point. The stop signal followed the go signal by a time delay – the stop signal delay (SSD). The SSD was updated according to a staircase procedure, whereby it increased and decreased by 64 ms following a stop success (SS) and stop error (SE) trial, respectively.
We estimated a critical SSD that represents the time delay between go and stop signals that a subject would require in order to succeed in 50% of the stop trials (Levitt, 1970). Specifically, SSDs across trials were grouped into runs, with each run being defined as a monotonically increasing or decreasing series. We derived a mid-run estimate by taking the middle SSD (or average of two middle SSDs if there was an even number of SSDs) of every second run. The critical SSD was computed by taking the mean of all mid-run SSDs. It was reported that, except for experiments with a small number of trials (less than 30), the mid-run estimate was close to the maximum likelihood estimate of X50 (50% positive response; i.e., 50% SS in the SST, Wetherill et al., 1966). The stop signal reaction time or SSRT was computed for individual subjects by subtracting the critical SSD from the median go trial RT (Levitt, 1970; Logan, 1994).
After the localization scans but before the BOLD (blood oxygenation level dependent, see below) sessions, subjects were asked to rate their stress level on a Likert scale from 1 (minimal) to 10 (most stressful ever). After they completed the third run of the task, subjects were again asked to rate their frustration and stress level associated with the task on a Likert scale from 1 (minimal) to 10 (most frustrating and stressful ever). The difference in the two ratings was taken to reflect task-related frustration (Li et al., In Press-a).
Imaging protocol
Conventional T1-weighted spin echo sagittal anatomical images were acquired for slice localization using a 3T scanner (Siemens Trio). Anatomical images of the functional slice locations were next obtained with spin echo imaging in the axial plane parallel to the AC-PC line with TR = 300 ms, TE = 2.5 ms, bandwidth = 300 Hz/pixel, flip angle = 60°, field of view = 220 × 220 mm, matrix = 256 × 256, 32 slices with slice thickness = 4mm and no gap. Functional, blood oxygenation level dependent (BOLD) signals were then acquired with a single-shot gradient echo echoplanar imaging (EPI) sequence. Thirty-two axial slices parallel to the AC-PC line covering the whole brain were acquired with TR = 2,000 ms, TE = 25 ms, bandwidth = 2004 Hz/pixel, flip angle = 85°, field of view = 220 × 220 mm, matrix = 64 × 64, 32 slices with slice thickness = 4mm and no gap. Three hundred images were acquired in each run for a total of 4 runs.
Data analysis and statistics
Data were analyzed with Statistical Parametric Mapping version 5 (SPM5, Welcome Department of Imaging Neuroscience, University College London, U.K.). Images from the first five TRs at the beginning of each trial were discarded to enable the signal to achieve steady-state equilibrium between RF pulsing and relaxation. Images of each individual subject were first corrected for slice timing, realigned (motion-corrected) and unwarped (Andersson et al. 2001; Hutton et al., 2002). A mean functional image volume was constructed for each subject for each run from the realigned image volumes. These mean images were normalized to an MNI (Montreal Neurological Institute) EPI template with affine registration followed by nonlinear transformation (Ashburner and Friston, 1999; Friston et al., 1995a). The normalization parameters determined for the mean functional volume were then applied to the corresponding functional image volumes for each subject. Finally, images were smoothed with a Gaussian kernel of 6 mm at Full Width at Half Maximum. The data were high-pass filtered (128 sec cutoff) to remove low-frequency signal drifts.
Four main types of trial outcome were first distinguished: go success (G), go error (F), stop success (SS), and stop error (SE) trial. A statistical analytical design was constructed for each individual subject, using the general linear model (GLM) with the onsets of go signal in each of these trial types convolved with a canonical hemodynamic response function (HRF) and with the temporal derivative of the canonical HRF and entered as regressors in the model (Friston et al., 1995b). Realignment parameters in all 6 dimensions were also entered in the model. Serial autocorrelation was corrected by a first-degree autoregressive or AR(1) model. The GLM estimated the component of variance that could be explained by each of the regressors.
In the first-level analysis, we constructed for each individual subject a contrast between SS and SE. The con or contrast (difference in β) images of the first-level analysis were then used for the second-level group statistics (random effect analysis; Penny and Holmes, 2004). Brain regions were identified using an atlas (Duvernoy, 1999; Mai et al., 2003). Because of our focus on the subcortical structures, we employed small volume correction to examine results specifically for the caudate nucleus, pallidum (internal and external segments combined), and putamen, using anatomical templates from the Anatomical Automatic Labeling or AAL brain atlas (Maldjian et al., 2003; Tzourio-Mazoyer et al., 2002). A recent study suggested that use of masks drawn in standardized space is valid and useful for ROI analysis for small nuclei in the basal ganglia (Prodoehl et al., In Press). For the subthalamic nucleus, we constructed box ROIs of a size 10 × 10 × 10 mm and centered at x=−10/+10, y=−15, z=−5, following Aron and Poldrack, 2006. All templates are in MNI space and voxel activations are presented in MNI coordinates. Functional ROIs of the anterior pre-supplementary motor (pre-SMA) area and rostral anterior cingulate cortex (rACC) were also derived from our previous study for cross-correlation with subcortical activities (Li et al., 2006a). We used MarsBaR to derive for each individual subject the effect size of activity change for the ROIs (Brett et al., 2002; http://marsbar.sourceforge.net/).
Results
Stop signal performance
Table 1 shows the results of behavioral performance, separately for the subjects with short and long SSRT, grouped with a median split. Note that our subjects succeeded in approximately 51% of the stop trials, suggesting the success of the tracking procedure. The median go trial RT was indistinguishable between the four sessions (session 1 through 4: 547 ± 137; 611 ± 149; 597 ± 146; 591 ± 141 ms; p=0.351, ANOVA). Furthermore, for all 30 subjects the RT and SSD was linearly correlated for stop trials (all p’s<0.001, 0.556<R’s<0.952, Pearson regression), providing more evidence for the adequacy of the tracking procedure (Logan et al., 1984).
Table 1.
Behavioral performance in the stop signal task
| SSRT group | SSRT (msec) | FP effect* | Median go RT (msec) | %go | %stop | Frustration rating | SSD (SS) | SSD (SE) | PES* |
|---|---|---|---|---|---|---|---|---|---|
| Short | 165 ± 22 | 2.76 ± 1.16 | 569 ± 140 | 97.0 ± 1.8 | 50.8 ± 1.7 | 3.3 ± 1.0 | 361 ± 141 | 420 ± 148 | 1.78 ± 1.33 |
| Long | 228 ± 30 | 1.98 ± 1.59 | 602 ± 128 | 97.2 ± 1.8 | 51.2 ± 1.9 | 3.1 ± 0.7 | 352 ± 131 | 406 ± 125 | 1.33 ± 1.86 |
| P value | <0.0001 | 0.136 | 0.507 | 0.728 | 0.523 | 0.436 | 0.853 | 0.789 | 0.447 |
Note: FP: fore-period; %go and %stop: percentage of successful go and stop trials; SSRT: stop-signal reaction time; SSD: stop signal delay for stop success (SS) and stop error (SE) trials; PES: post-error slowing;
effect size; all values are mean ± standard deviation; P value based on 2-tailed 2-sample t test except for frustration rating using Mann Whitney U test. Note that the SSD reported here is not the “critical SSD” used to compute SSRT (see Methods).
Importantly, the two groups did not differ in the percentage of go or stop success, or the median go trial RT. As expected of the staircase procedure, the SSD was greater for SE than for SS trials, and this difference was indistinguishable between the two SSRT groups (p=0.952, ANOVA). We also computed a fore-period (FP) effect to index the extent of motor preparation. With the FP randomly varying between 1 and 5 s, we compared the RT of go trials with a FP less than 3 s and those with a FP equal to or greater than 3 s (Bertelson and Tisseyre, 1968; Li et al., 2005). The effect size of the FP effect did not differ between the short and long SSRT groups. Furthermore, we computed RT difference between go trials following a stop error and those following a go success, to index performance monitoring during the task (Rabbit, 1966; Li et al., 2006a; 2006c; Li et al., In Press-b). This post-error slowing (PES) effect also did not differ between the two groups. Subjects in the two groups were indistinguishable in their frustration rating (mean rank =16.8 vs. 14.2, Mann Whitney U test). Thus, the two groups differed in SSRT but not any other aspects of stop signal performance.
Neural activity differentiating individuals with short and long SSRT
We first compared subjects with short and those with long SSRT for the whole brain. The results showed that, compared to those with long SSRT, subjects with short SSRT demonstrated greater activation in the anterior pre-supplementary motor area (pre-SMA, x=−3, y=36, z=51, voxel Z=3.75, 508 mm3), rostral anterior cingulate cortex (ACC, x=−9, y=51, z=6, voxel Z=3.18, 508 mm3), consistent with our earlier reports (uncorrected p<0.005, 5 voxels in extent of activation, Li et al., 2006a; Li et al., 2006b). The two prefrontal clusters survived correction for multiple comparisons in small volume correction based on the ROIs identified from our previous studies: p<0.05, FWE corrected). Caudate head also showed greater activation bilaterally during short compared to long SSRT (x=−3, y=12, z=0, voxel Z=3.50, 832 mm3) but no other subcortical activity was observed for this contrast at the same threshold. Conversely, a number of cortical and subcortical structures including two loci in the region of the thalamus/subthamalus, showed greater activation in the long, compared to the short, SSRT group (uncorrected p<0.005, 5 voxels in extent of activation, Table 2). Figure 2 shows these activities in the thalamus and other subcortical structures, with activities for short > long SSRT also shown on the same axial slices for comparison.
Table 2.
Regional brain activity, long > short SSRT
| cluster size (voxels) | voxel Z value | MNI coordinate (mm) | Side | Identified brain region | ||
|---|---|---|---|---|---|---|
| x | y | z | ||||
| 24 | 3.88 | 3 | −66 | −21 | R | Culmen |
| 3.21 | 9 | −48 | −24 | R | Culmen | |
| 36 | 3.51 | 18 | −24 | 12 | R | Thalamus |
| 3.17 | −6 | −21 | −3 | L | Thalamus/Subthalamic N | |
| 7 | 3.50 | −18 | −63 | −45 | L | Cerebellar Tonsil |
| 5 | 3.38 | 12 | −33 | 39 | R | Posterior Cingulate G |
| 10 | 3.12 | −27 | 27 | 27 | L | Middle/Inferior Frontal G |
| 7 | 3.07 | 12 | 0 | 48 | R | Cingulate G |
| 17 | 3.03 | 3 | −21 | 57 | R | Paracentral Lobule |
| 6 | 2.94 | 30 | −69 | 39 | R | Precuneus |
| 9 | 2.91 | 60 | 6 | 18 | R | Inferior Precentral G |
| 5 | 2.83 | 12 | −45 | 69 | R | Paracentral Lobule |
| 5 | 2.75 | −9 | −42 | 27 | L | Posterior Cingulate G |
Note: p<0.005, uncorrected, and 5 voxels in extent of activation; N: nucleus; G: gyrus
FIGURE 2.
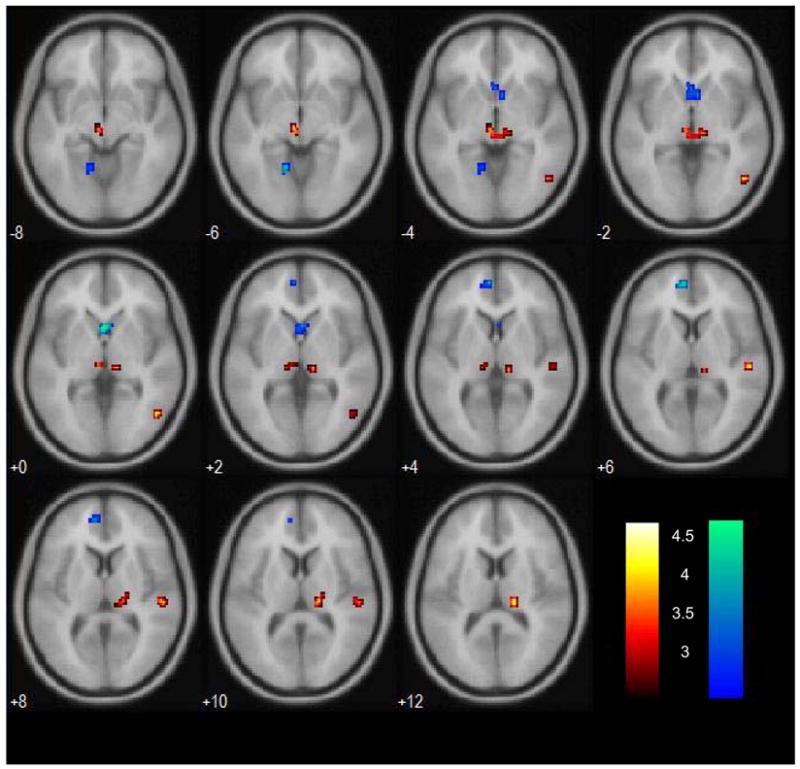
(a) Subcortical structures showing greater activation in individuals with long SSRT, as compared to those with short SSRT, for the contrast “stop success > stop error,” at p<0.005, uncorrected for multiple comparisons (warm color). BOLD signals are overlaid on axial slices (from z=−8mm to +12mm) of a smoothed structural image. (b) Activations for the reverse contrast – short > long SSRT – were shown for the same axial slices for comparison (cold color). Color bar represents voxel T value. Neurological orientation: R=R.
We further examined the subcortical findings with small volume correction, focusing on the basal ganglia (Table 3). Bilateral caudate head showed greater activation in the short, compared to long, SSRT group. Moreover, the effect size of its activity is positively correlated with that of the pre-SMA (R=0.481, p=0.011; Pearson’s regression). Conversely, right pallidum and bilateral putamen and subthalamic nuclei (STN) showed greater activation in the long, compared to short, SSRT group.
Table 3.
Subcortical regional activities based on small volume correction
| cluster size (voxels) | Voxel Z value | Voxel P (uncorr) | MNI coordinate (mm) | |||
|---|---|---|---|---|---|---|
| x | y | z | ||||
| short > long SSRT | ||||||
| L caudate head | 6 | 3.15 | 0.001 | −3 | 12 | 0 |
| R caudate head | 11 | 3.00 | 0.001 | 6 | 12 | −3 |
| long > short SSRT | ||||||
| L pallidum | 5 | 2.05 | 0.020 | −21 | −6 | 0 |
| R pallidum | 18 | 2.54 | 0.006 | 24 | −3 | −3 |
| L putamen | 16 | 2.39 | 0.009 | −27 | −9 | 6 |
| R putamen | 44 | 2.62 | 0.004 | 33 | −18 | −3 |
| L subthalamic n | 87 | 3.17 | 0.001 | −6 | −21 | −3 |
| R subthalamic n | 65 | 2.91 | 0.002 | 9 | −21 | −6 |
The STN is a small subcortical structure situated ventral to the thalamus and medial to the posterior limb of the internal capsule and between the mediodorsal border of the substantia nigra and the lateral border of the red nucleus (Ashkan et al., 2007; Lee et al., 2006; Rijkers et al., 2007; Yelnik et al., 2007; Zhu et al., 2002). The location of peak activity in STN identified both in the current study and in Aron and Poldrack appeared to be somewhat medial to the MNI coordinates specified in previous studies (e.g., x=18, right STN, x=−16, left STN, Herzog et al., 2006). Thus, we overlay the BOLD activation for long>short SSRT on coronal and axial sections of a single-subject T1 structural image in order to better visualize the approximate locations of the STNs (Fig. 3). Because of the geometrical proximity of the STN to thalamus and other structures in the midbrain and brain stem, such as the substantia nigra and the red nucleus, these results should be safely regarded as “in the region of the STN.”
FIGURE 3.
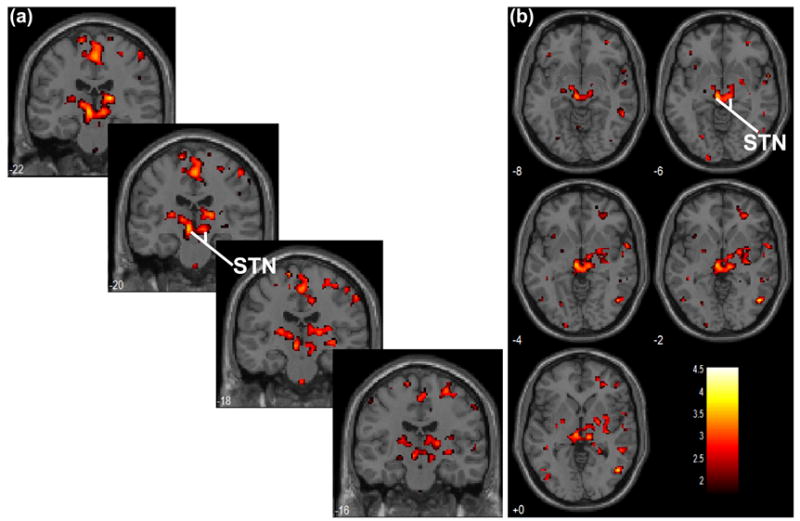
Subcortical structures showing greater activation in individuals with long SSRT, as compared to those with short SSRT, for the contrast “stop success > stop error,” overlaid on (a) coronal slices from y=−22mm to −16mm and on (b) axial slices from z=0mm to +8mm of a single subject T1 image. The regions of bilateral STN were highlighted. Color bar indicates voxel T value.
Greater subthalamic activity during stop than during go trials
We sought to replicate the finding of greater subthalamic activity during stop compared to go trials, as reported in Aron and Poldrack, 2006. With small volume correction for the STN templates (the 10×10×10 mm3 box), the results showed greater activity in the STN both during stop success (Left STN: x=−12, y=−12, z=−6, voxel Z=2.44, 256mm3, p<0.05, corrected for false discovery rate or FDR; Right STN: x=12, y=−12, z=−3, voxel Z=3.15, 448mm3, p<0.01, corrected for FDR), and stop error (Left STN: x=−12, y=−12, z=−3, voxel Z=4.21, 448mm3, p<0.001, corrected for FDR; Right STN: x=12, y=−12, z=−3, voxel Z=4.43, 512mm3, p<0.001, corrected for FDR), as compared to go trials. Furthermore, STN showed greater activity during stop error, compared to stop success, trials (Left STN: x=−12, y=−15, z=−3, voxel Z=3.97, 256mm3, p<0.001, corrected for FDR; Right STN: x=12, y=−15, z=−9, voxel Z=3.33, 320mm3, p<0.005, corrected for FDR). Figure 4 plots the time course of go trial, stop success and stop error activities for right and left STNs, separately for the two SSRT groups.
FIGURE 4.

Time course plots of percent signal change (y) after stimulus onset (x, in seconds), for the right and left subthalamic nuclei (STN) and separately for the short and long SSRT groups. Black, red and blue lines indicate go success (G), stop success (SS) and stop error (SE), trials, respectively.
Discussion
Caudate nucleus and cognitive motor control
The caudate head shows greater activation in association with short SSRT, and the extent of its activation is positively correlated with activity in the pre-supplementary motor area (pre-SMA), a cortical structure that have been implicated in cognitive control and response planning and selection (Boecker et al., 1998; Boecker et al., 2008; Brass and Haggard, 2007; de Jong and Paans, 2007; Isoda and Hikosaka, 2007; Lau et al., 2004; Li et al., 2006a; Mueller et al., 2007; Nachev et al., 2005; Rushworth et al., 2002; Shima et al., 1996; Simmonds et al., In press; Sumner et al., 2007; Suskauer et al., In press). Earlier animal, clinical, and neuroimaging research has provided extensive evidence for a role of the caudate nucleus in cognitive-motor control. For instance, chemical lesion of the caudate head impaired monkey’s ability to suppress a reflexive saccade to sudden visual onsets and to initiate a delayed saccade (Kori et al., 1995). Stroke patients with lesions in the caudate nucleus demonstrated prominent motor preserveration as demonstrated in a “star cancellation” task, a deficit that was independent of the extent of visual neglect (Nys et al., 2006). Caudate nucleus increased activity during cognitive planning in a set-shifting task (Monchi et al., 2006). Caudate nuclei showed greater activity during force perturbation and during manual tracking of a visual stimulus, when subjects were required to exercise motor control (Lungu et al., 2007; Tunik et al., 2007). Furthermore, in a finger-tapping task in which subjects responded to auditory stimuli at varying temporal frequencies, the left caudate head activated to a greater extent when the externally guided responses were executed at a slow, compared to a high rate, suggesting that the caudate nucleus responds more intensively during controlled than habitual, automatic movements (Riecker et al., 2003).
Perhaps of direct relevance to the current findings is the study of Vink and colleagues, who showed greater bilateral (particularly left-hemispheric) activation of the caudate head in association with response inhibition during a choice RT stop signal task, in which the likelihood of a stop trial is parametrically modulated by varying the number of its preceding go trials (Vink et al., 2005). These investigators posited that the caudate nucleus becomes more active when subjects respond in a controlled manner, in order to prevent an action from being automatically executed. In a subsequent study, these authors showed that patients with schizophrenia and their siblings were impaired along with diminished striatal activation during response inhibition (Vink et al., 2006). Overall, these findings suggest a role of the caudate nucleus in the controlled execution of movement. This role of the caudate nucleus during stop signal inhibition is also supported by the current finding of correlated activity and its anatomical connections with the pre-SMA, a structure extensively implicated in the volitional control of action (Brass and Haggard, 2007; Inase et al., 1999; Lau et al., 2004; Lehéricy et al., 2004; Li et al., 2006a; Mueller et al., 2007; Nachev et al., 2005; Sumner et al., 2007).
The striatothalamic circuitry and stop signal reaction time
Greater activity in the thalamus and basal ganglia (except the caudate nucleus) may delay stop signal reaction time (SSRT). To account for this finding, it would be of interest to rule out several possibilities to begin with. Note that the two SSRT groups do not differ in their go trial RT, preparation for a response in terms of the fore-period effect, go or stop trial success rate, or performance monitoring in terms of post-error slowing in RT. Only male subjects are recruited in the current study and the two groups of individuals do not differ in age. The two groups differ in one outcome measure – the SSRT – upon which the grouping was made. Thus, difference in the striato-thalamic activity has to do with the speed of the stop process to reach its finish line, as computed by the race model (Logan and Cowan, 1984). The association of greater activity of the striato-thalamic circuitry with less inhibitory ability is reminiscent of the overactivity of the basal ganglia circuitry in patients with Parkinson’s disease, who are known to be impaired in flexible behavioral performance including showing prolonged SSRT in the stop signal task (Gauggel et al., 2004). The finding of greater STN activity during prolonged SSRT is also consistent with a recent study documenting the association of increasing metabolism in the STN with disease progression in Parkinson’s disease (Huang et al., 2007). Note that these observations do not offer a mechanistic explanation associating increased striato-thalamic activity with longer SSRT. Nevertheless, stop signal inhibition appears to be expedited or impeded depending on whether the prefrontal cortices and caudate nucleus or the striato-thalamic circuitry shows greater activity.
Role of subthalamic nucleus during visual motor processing
We replicated the finding of greater activity in the subthalamic nucleus (STN) during stop trials, compared to go trials, as reported in Aron and Poldrack, 2006. The STN also showed greater activity during stop errors, compared to stop successes. These results suggest that the activity of this subcortical structure is perhaps more related to the processing of the stop signal than to the processes that determine the outcome of a stop trial. Thus, compared to a go signal, a stop signal can evoke “odd-ball” attentional effect in the STN, an interpretation in accord with the findings that lesioning of the STN led to premature responding as a result of attention and stimulus discrimination deficits (Baunez and Robbins, 1997; Tan et al., 2006). Recording from the STN in patients with Parkinson’s disease undergoing ameliorative neurosurgery, Brown and colleagues demonstrated local potentials evoked during performance errors in a computer game that required temporal accuracy of movement (Brown et al., 2006). The evoked, short-latency activity was greatest in response to small errors and influenced subsequent movements. It was suggested that the human STN is involved in feedback-based learning. Thus, STN may show greater activity during stop errors as part of the performance monitoring processes during the stop signal task (SST).
A recent report showed that excitotoxic fiber-sparing lesioning of the STN did not alter SSRT in rats performing a rodent version of the SST derived from Logan and Cowan (Eagle et al., 2008; Logan and Cowan, 1984). Furthermore, STN lesions reduced go trial reaction time (RT) and led to decreased accuracy of stopping at all stop-signal delays, indicative of a generalized stopping impairment that was independent of the SSRT itself, a finding consistent with the aforementioned study of Baunez and Robbins (Eagle et al., 2008). This latter finding suggests that STN does not play a critical role in determining SSRT, the outcome measure of stop signal inhibition, despite its involvement in other aspects of stop signal performance. Notably, rats with STN lesions were unable to stop even in stop trials without delay while unimpaired in go trial accuracy, suggesting that they were fundamentally impaired in the processing of the stop signal. Taken together, these results indicate that the STN may influence stop signal performance by mediating the attentional and/or visuomotor processing of the stop signal rather than expediting response inhibition as computed by the horse race model (Eagle et al., 2008).
Studies in animals have extensively implicated the basal ganglia and the cortico-striato-thalamic circuitry in motor control (Albin et al., 1989; Alexander and Crutcher, 1990). It has been hypothesized that the “indirect” pathway, of which the STN is a critical component, may play a role in modulating or perhaps opposing the activity of the “direct” pathway (Alexander and Crutcher, 1990). Imbalance between the activities of the two pathways has been proposed to account for the hypo- and hyperkinetic features of basal ganglia disorders (DeLong, 1990). The STN is a critical node of the indirect pathway but it also receives direct inputs from many cortical regions, including the primary motor, premotor, supplementary motor, and rostral and caudal cingulate motor cortices (Aravamuthan et al., In Press; Hamani et al., 2004; Monakow et al., 1978; Nambu et al. 1996; Nambu et al., 1997; Nambu et al., 2000; Takada et al., 2001; note that the STN does not appear to receive direct projection from the inferior frontal cortex, as investigated by Aron and Poldrack, 2006). Physiological evidence suggests that the STN should be considered as another input station by which the motor cortices regulate basal ganglia output at a rate faster than both the direct and indirect pathways (Nambu et al., 2000). Notably, although the connections within the cortico-striato-thalamic “loops” are well defined chemically (excitatory or inhibitory), none of them have individually been assigned a specific role in motor response inhibition. For instance, despite the focus of earlier unit recording studies on saccade-related tonic-pause neurons, more recent work have documented saccade-related “burst” neuronal responses, in the pars reticulata of the substantia nigra, an output nucleus of the basal ganglia (Bayer et al., 2004; Handel and Glimcher, 1999; Handel and Glimcher, 2000; Hikosaka and Wurtz, 1983a; Hikosaka and Wurtz, 1983b; Sato and Hikosata, 2002).
Likewise, functional imaging studies have provided evidence that appears to implicate the STN in both the excitatory and inhibitory mechanisms of motor control. For instance, a recent fMRI study found that the internal portion of the globus pallidus and the STN but not other nuclei in the striato-thalamic circuitry increased in percent signal change with force amplitude output during pinch grips (Spraker et al., 2007). An earlier study employing a set shifting task suggested that the caudate nucleus and the putamen are important in the planning and the execution, respectively, of a self-generated novel action, whereas the STN may be required when a new motor program is solicited independently of the choice of strategy (Monchi et al., 2006). Furthermore, in audio-paced finger tapping tasks varying in movement complexity and frequency, STN as well as rostral frontal areas, caudate nucleus, and ventroanterior/ventrolateral thalamus increased in BOLD signals mainly during complex and high-frequency tasks (Lehéricy et al., 2006). In contrast, in the posterior putamen and the sensorimotor cortex, signal increased with movement frequency but not with movement complexity. Overall, these studies have depicted a picture of the diverse roles the STN plays in visuomotor control.
The STN results on short versus long SSRT group thus contrasted the current study and Aron and Poldrack, 2006. There are several differences in the stop signal paradigm between the two studies. First, the current and previous study each employed a simple and choice reaction time task. Second, in the current study the presentation of go and stop trials were completely randomized, whereas in the previous study it was pseudorandomized because of a fixed number of go and stop trials and other constraints imposed on trial presentation. Third, the current and previous study each used a random (1 to 5 s) and fixed (0.5 s) fore-period. Fourth, the current and previous study each used a visual and auditory stimulus as the stop signal. Fifth, the current and previous study estimated the SSRT by subtracting from the median go RT a critical SSD computed by different algorithms, although the values of SSRT were comparable. We do not know whether these differences could readily account for the disparity in the results, which would await more studies to resolve.
Implications for the direct versus indirect pathways of motor control
More generally, the current results suggest that the model of direct and indirect pathway of the cortico-subcortical circuits for motor control could be reconsidered (Alexander et al., 1990). This model postulates that two functionally opposing basal ganglia circuits serve to regulate thalamo-cortical activities, with activation of the direct pathway facilitating movement and activation of the indirect pathway inhibiting movement (De Long, 2000). As briefly mentioned in the above, the connections between the basal ganglia nuclei are well defined chemically, with all except the subthalamic projections to the output nuclei being inhibitory. Thus, motor execution is mediated through the direct pathway with greater activity in the putamen, less activity in the internal segment of the pallidum (GPi), and again greater activity in the thalamus. In contrast, the indirect pathway mediates response inhibition by involving less activity in the external segment of the pallidum (GPe), greater activity in the GPi (either via direct inhibition from the GPe, or excitation from the STN, which is inhibited by the GPe), and less activity in the thalamus. Since short SSRT is associated with greater motor response inhibition and the indirect pathway, one would predict on the basis of these interconnections greater activity in the GPi and STN and less activity in the GPe and thalamus during short as compared to long SSRT. Limited spatial resolution precludes any meaningful demarcation and inferences from being drawn of GPe and GPi. However, the current findings of greater thalamic and subthalamic activity in association with long SSRT each agrees and disagrees, respectively, with the hypothesis. The current results thus indicated that the basal ganglia circuits need be more fully considered, as has also been suggested by recent imaging work (Marchand et al., 2007a; Marchand et al., 2007b).
Although the caudate nucleus is also an input nucleus of the basal ganglia, it appears to assume a greater role in higher cortical functions than motor control, compared to the putamen (Afifi, 2003; Carbon and Marié, 2003; Poldrack, 2002; Hikosaka, 2007; Knutson and Cooper, 2005). For instance, caudate neurons respond to reward contingency and eye movement, processes which are highly relevant during executive control. While putamen mostly receives projection from sensorimotor cortices, the caudate nucleus receives projections from association cortical areas (Afifi, 2003; De Long, 2000). Greater caudate activity as we have observed in association with short SSRT thus seems to reflect more controlled response during the stop signal task. Further studies would be warranted to further delineate the role of the caudate nucleus in the regulation of motor response via direct versus indirect pathways.
Conclusion
To summarize, we demonstrated greater activity in the caudate nucleus in association with short SSRT. With its functional connections with the pre-SMA, we thus seem to have identified a cortico-striatal circuitry associated with expedient response inhibition. In contrast, the thalamus and other parts of the basal ganglia, including the STN, show greater activity in association with long SSRT, consistent with the idea that over-activity in the striato-thalamic circuitry might impair flexible motor response, as observed in patients with Parkinson’s disease.
Supplementary Material
Acknowledgments
This study was supported by NIH grants R01-DA11077 (Sinha), P50-DA16556 (Sinha), K02-DA17232 (Sinha), and R03-DA022395 (Li). It was also supported by a research grant from the Alcoholic Beverage Medical Research Foundation (Li), and research grant (Li) from the Clinical Translational Science Award (NIH-UL1 RR024139) awarded to Yale University, a Physician Scientist training grant (K12-DA000167, Bruce Rounsaville) and P50-DA09241 (Bruce Rounsaville). This project was also funded in part by the State of Connecticut, Department of Mental Health and Addictions Services. Tien-Wen Lee was partly supported by a Scholarship from Ministry of Education, Taiwan. We thank Verica Milivojevic and Keith Harenski for running some of the experiments.
Footnotes
Publisher's Disclaimer: This is a PDF file of an unedited manuscript that has been accepted for publication. As a service to our customers we are providing this early version of the manuscript. The manuscript will undergo copyediting, typesetting, and review of the resulting proof before it is published in its final citable form. Please note that during the production process errors may be discovered which could affect the content, and all legal disclaimers that apply to the journal pertain.
References
- Afifi AK. The basal ganglia: a neural network with more than motor function. Semin Pediatr Neurol. 2003;10:3–10. doi: 10.1016/s1071-9091(02)00003-7. [DOI] [PubMed] [Google Scholar]
- Albin RL, Young AB, Penney JB. The functional anatomy of basal ganglia disorders. Trends Neurosci. 1989;12:366–375. doi: 10.1016/0166-2236(89)90074-x. [DOI] [PubMed] [Google Scholar]
- Alexander GE, Crutcher MD. Functional architecture of basal ganglia circuits: neural substrates of parallel processing. Trends Neurosci. 1990;13:266–271. doi: 10.1016/0166-2236(90)90107-l. [DOI] [PubMed] [Google Scholar]
- Andersson JL, Hutton C, Ashburner J, Turner R, Friston K. Modeling geometric deformations in EPI time series. Neuroimage. 2001;13:903–919. doi: 10.1006/nimg.2001.0746. [DOI] [PubMed] [Google Scholar]
- Aravamuthan BR, Muthusamy KA, Stein JF, Aziz TZ, Johansen-Berg H. Topography of cortical and subcortical connections of the human pedunculopontine and subthalamic nuclei. Neuroimage. 2007;37:694–705. doi: 10.1016/j.neuroimage.2007.05.050. [DOI] [PubMed] [Google Scholar]
- Aron AR, Poldrack RA. The cognitive neuroscience of response inhibition: relevance for genetic research in attention-deficit/hyperactivity disorder. Biol Psychiatry. 2005;57:1285–1292. doi: 10.1016/j.biopsych.2004.10.026. [DOI] [PubMed] [Google Scholar]
- Aron AR, Poldrack RA. Cortical and subcortical contributions to Stop signal response inhibition: role of the subthalamic nucleus. J Neurosci. 2006;26:2424–2433. doi: 10.1523/JNEUROSCI.4682-05.2006. [DOI] [PMC free article] [PubMed] [Google Scholar]
- Ashburner J, Friston KJ. Nonlinear spatial normalization using basis functions. Hum Brain Mapp. 1999;7:254–266. doi: 10.1002/(SICI)1097-0193(1999)7:4<254::AID-HBM4>3.0.CO;2-G. [DOI] [PMC free article] [PubMed] [Google Scholar]
- Ashkan K, Blomstedt P, Zrinzo L, Tisch S, Yousry T, Limousin-Dowsey P, Hariz MI. Variability of the subthalamic nucleus: the case for direct MRI guided targeting. Br J Neurosurg. 2007;21:197–200. doi: 10.1080/02688690701272240. [DOI] [PubMed] [Google Scholar]
- Baunez C, Robbins TW. Bilateral lesions of the subthalamic nucleus induce multiple deficits in an attentional task in rats. Eur J Neurosci. 1997;9:2086–2099. doi: 10.1111/j.1460-9568.1997.tb01376.x. [DOI] [PubMed] [Google Scholar]
- Bayer HM, Handel A, Glimcher PW. Eye position and memory saccade related responses in substantia nigra pars reticulata. Exp Brain Res. 2004;154:428–441. doi: 10.1007/s00221-003-1735-7. [DOI] [PubMed] [Google Scholar]
- Benabid AL. Deep brain stimulation for Parkinson’s disease. Curr Opin Neurobiol. 2003;13:696–706. doi: 10.1016/j.conb.2003.11.001. [DOI] [PubMed] [Google Scholar]
- Bertelson P, Tisseyre F. The time-course of preparation with regular and irregular foreperiods. Q J Exp Psychol. 1968;20:297–300. doi: 10.1080/14640746808400165. [DOI] [PubMed] [Google Scholar]
- Bevan MD, Atherton JF, Baufreton J. Cellular principles underlying normal and pathological activity in the subthalamic nucleus. Curr Opin Neurobiol. 2006;16:621–628. doi: 10.1016/j.conb.2006.10.003. [DOI] [PubMed] [Google Scholar]
- Boecker H, Dagher A, Ceballos-Baumann AO, Passingham RE, Samuel M, Friston KJ, Poline J, Dettmers C, Conrad B, Brooks DJ. Role of the human rostral supplementary motor area and the basal ganglia in motor sequence control: investigations with H215O PET. J Neurophysiol. 1998;79:1070–1080. doi: 10.1152/jn.1998.79.2.1070. [DOI] [PubMed] [Google Scholar]
- Boecker H, Jankowski J, Ditter P, Scheef L. A role of the basal ganglia and midbrain nuclei for initiation of motor sequences. Neuroimage. 2008;39:1356–1369. doi: 10.1016/j.neuroimage.2007.09.069. [DOI] [PubMed] [Google Scholar]
- Boucher L, Palmeri TJ, Logan GD, Schall JD. Inhibitory control in mind and brain: an interactive race model of countermanding saccades. Psychol Rev. 2007;114:376–397. doi: 10.1037/0033-295X.114.2.376. [DOI] [PubMed] [Google Scholar]
- Brass M, Haggard P. To do or not to do: the neural signature of self-control. J Neurosci. 2007;27:9141–9145. doi: 10.1523/JNEUROSCI.0924-07.2007. [DOI] [PMC free article] [PubMed] [Google Scholar]
- Breit S, Schulz JB, Benabid AL. Deep brain stimulation. Cell Tissue Res. 2004;318:275–288. doi: 10.1007/s00441-004-0936-0. [DOI] [PubMed] [Google Scholar]
- Brett M, Anton J-L, Valabregue R, Poline J-P. Region of interest analysis using an SPM toolbox. Abstract presented at the 8th International Conference on Functional Mapping of the Human Brain; June 2–6; Sendai, Japan. 2002. [Google Scholar]
- Brown P, Chen CC, Wang S, Kühn AA, Doyle L, Yarrow K, Nuttin B, Stein J, Aziz T. Involvement of human basal ganglia in offline feedback control of voluntary movement. Curr Biol. 2006;16:2129–2134. doi: 10.1016/j.cub.2006.08.088. [DOI] [PubMed] [Google Scholar]
- Carbon M, Marié RM. Functional imaging of cognition in Parkinson’s disease. Curr Opin Neurol. 2003;16:475–480. doi: 10.1097/01.wco.0000084225.82329.3c. [DOI] [PubMed] [Google Scholar]
- Chevrier AD, Noseworthy MD, Schachar R. Dissociation of response inhibition and performance monitoring in the stop signal task using event-related fMRI. Hum Brain Mapp. doi: 10.1002/hbm.20355. In Press. [DOI] [PMC free article] [PubMed] [Google Scholar]
- Curtis CE, Cole MW, Rao VY, D’Esposito M. Canceling planned action: an FMRI study of countermanding saccades. Cereb Cortex. 2005;15:1281–1289. doi: 10.1093/cercor/bhi011. [DOI] [PubMed] [Google Scholar]
- David HN, Ansseau M, Abraini JH. Dopamine-glutamate reciprocal modulation of release and motor responses in the rat caudate-putamen and nucleus accumbens of “intact” animals. Brain Res Rev. 2005;50:336–360. doi: 10.1016/j.brainresrev.2005.09.002. [DOI] [PubMed] [Google Scholar]
- de Jong BM, Paans AM. Medial versus lateral prefrontal dissociation in movement selection and inhibitory control. Brain Res. 2007;1132:139–147. doi: 10.1016/j.brainres.2006.11.017. [DOI] [PubMed] [Google Scholar]
- De Jong R, Coles MG, Logan GD, Gratton G. In search of the point of no return: the control of response processes. J Exp Psychol Hum Percept Perform. 1990;16:164–182. doi: 10.1037/0096-1523.16.1.164. [DOI] [PubMed] [Google Scholar]
- DeLong MR. Primate models of movement disorders of basal ganglia origin. Trends Neurosci. 1990;13:281–285. doi: 10.1016/0166-2236(90)90110-v. [DOI] [PubMed] [Google Scholar]
- DeLong MR. The Basal Ganglia. In: Kandel ER, Schwartz JH, Jessell TM, editors. Principles of Neural Science. 4. McGraw-Hill; New York, N.Y: 2000. pp. 853–872. [Google Scholar]
- DeLong MR, Wichmann T. Circuits and circuit disorders of the basal ganglia. Arch Neurol. 2007;64:20–24. doi: 10.1001/archneur.64.1.20. [DOI] [PubMed] [Google Scholar]
- Duvernoy HM. The Human Brain: Surface, Blood Supply, and Three-Dimensional Sectional Anatomy. 2. Springer Verlag; New York, NY: 1999. [Google Scholar]
- Eagle DM, Baunez C, Hutcheson DM, Lehmann O, Shah AP, Robbins TW. Stop-Signal Reaction-Time Task Performance: Role of Prefrontal Cortex and Subthalamic Nucleus. Cereb Cortex. 2008;18:178–188. doi: 10.1093/cercor/bhm044. [DOI] [PubMed] [Google Scholar]
- Friston KJ, Ashburner J, Frith CD, Polone J-B, Heather JD, Frackowiak RSJ. Spatial registration and normalization of images. Hum Brain Mapp. 1995a;2:165–189. [Google Scholar]
- Friston KJ, Holmes AP, Worsley KJ, Poline J-B, Frith CD, Frackowiak RSJ. Statistical parametric maps in functional imaging: a general linear approach. Hum Brain Mapp. 1995b;2:189–210. [Google Scholar]
- Gauggel S, Rieger M, Feghoff TA. Inhibition of ongoing responses in patients with Parkinson’s disease. J Neurol Neurosurg Psychiatry. 2004;75:539–544. doi: 10.1136/jnnp.2003.016469. [DOI] [PMC free article] [PubMed] [Google Scholar]
- Grafton ST, Turner RS, Desmurget M, Bakay R, Delong M, Vitek J, Crutcher M. Normalizing motor-related brain activity: subthalamic nucleus stimulation in Parkinson disease. Neurology. 2006;66:1192–1199. doi: 10.1212/01.wnl.0000214237.58321.c3. [DOI] [PubMed] [Google Scholar]
- Graybiel AM. The basal ganglia: learning new tricks and loving it. Curr Opin Neurobiol. 2005;15:638–644. doi: 10.1016/j.conb.2005.10.006. [DOI] [PubMed] [Google Scholar]
- Hamani C, Richter E, Schwalb JM, Lozano AM. Bilateral subthalamic nucleus stimulation for Parkinson’s disease: a systematic review of the clinical literature. Neurosurgery. 2005;56:1313–1321. doi: 10.1227/01.neu.0000159714.28232.c4. [DOI] [PubMed] [Google Scholar]
- Hamani C, Saint-Cyr JA, Fraser J, Kaplitt M, Lozano AM. The subthalamic nucleus in the context of movement disorders. Brain. 2004;127:4–20. doi: 10.1093/brain/awh029. [DOI] [PubMed] [Google Scholar]
- Handel A, Glimcher PW. Quantitative analysis of substantia nigra pars reticulata activity during a visually guided saccade task. J Neurophysiol. 1999;82:3458–3475. doi: 10.1152/jn.1999.82.6.3458. [DOI] [PubMed] [Google Scholar]
- Handel A, Glimcher PW. Contextual modulation of substantia nigra pars reticulata neurons. J Neurophysiol. 2000;83:3042–3048. doi: 10.1152/jn.2000.83.5.3042. [DOI] [PubMed] [Google Scholar]
- Herzog J, Weiss PH, Assmus A, Wefer B, Seif C, Braun PM, Herzog H, Volkmann J, Deuschl G, Fink GR. Subthalamic stimulation modulates cortical control of urinary bladder in Parkinson’s disease. Brain. 2006;129:3366–3375. doi: 10.1093/brain/awl302. [DOI] [PubMed] [Google Scholar]
- Hikosaka O. Basal ganglia mechanisms of reward-oriented eye movement. Ann N Y Acad Sci. 2007;1104:229–249. doi: 10.1196/annals.1390.012. [DOI] [PubMed] [Google Scholar]
- Hikosaka O, Wurtz RH. Visual and oculomotor functions of monkey substantia nigra pars reticulata. I. Relation of visual and auditory responses to saccades. J Neurophysiol. 1983a;49:1230–1253. doi: 10.1152/jn.1983.49.5.1230. [DOI] [PubMed] [Google Scholar]
- Hikosaka O, Wurtz RH. Visual and oculomotor functions of monkey substantia nigra pars reticulata. IV. Relation of substantia nigra to superior colliculus. J Neurophysiol. 1983b;49:1285–1301. doi: 10.1152/jn.1983.49.5.1285. [DOI] [PubMed] [Google Scholar]
- Huang C, Tang C, Feigin A, Lesser M, Ma Y, Pourfar M, Dhawan V, Eidelberg D. Changes in network activity with the progression of Parkinson’s disease. Brain. 2007;130:1834–1846. doi: 10.1093/brain/awm086. [DOI] [PMC free article] [PubMed] [Google Scholar]
- Hutton C, Bork A, Josephs O, Deichmann R, Ashburner J, Turner R. Image distortion correction in fMRI: A quantitative evaluation. Neuroimage. 2002;16:217–240. doi: 10.1006/nimg.2001.1054. [DOI] [PubMed] [Google Scholar]
- Inase M, Tokuno H, Nambu A, Akazawa T, Takada M. Corticostriatal and corticosubthalamic input zones from the presupplementary motor area in the macaque monkey: comparison with the input zones from the supplementary motor area. Brain Res. 1999;833:191–201. doi: 10.1016/s0006-8993(99)01531-0. [DOI] [PubMed] [Google Scholar]
- Isoda M, Hikosaka O. Switching from automatic to controlled action by monkey medial frontal cortex. Nat Neurosci. 2007;10:240–248. doi: 10.1038/nn1830. [DOI] [PubMed] [Google Scholar]
- Knutson B, Cooper JC. Functional magnetic resonance imaging of reward prediction. Curr Opin Neurol. 2005;18:411–417. doi: 10.1097/01.wco.0000173463.24758.f6. [DOI] [PubMed] [Google Scholar]
- Kori A, Miyashita N, Kato M, Hikosaka O, Usui S, Matsumura M. Eye movements in monkeys with local dopamine depletion in the caudate nucleus. II. Deficits in voluntary saccades. J Neurosci. 1995;15:928–941. doi: 10.1523/JNEUROSCI.15-01-00928.1995. [DOI] [PMC free article] [PubMed] [Google Scholar]
- Lau HC, Rogers RD, Haggard P, Passingham RE. Attention to intention. Science. 2004;303:1208–1210. doi: 10.1126/science.1090973. [DOI] [PubMed] [Google Scholar]
- Lee C, Young B, Sanders MF. The role of the supramammillary commissure in MR localization of the subthalamic nucleus. Stereotact Funct Neurosurg. 2006;84:193–204. doi: 10.1159/000095165. [DOI] [PubMed] [Google Scholar]
- Lehéricy S, Bardinet E, Tremblay L, Van de Moortele P-F, Pochon J-B, Dormont D, Kim D-S, Yelnik J, Ugurbil K. Motor control in basal ganglia circuits using fMRI and brain atlas approaches. Cereb Cortex. 2006;16:149–161. doi: 10.1093/cercor/bhi089. [DOI] [PubMed] [Google Scholar]
- Lehéricy S, Ducros M, Krainik A, Francois C, Van de Moortele PF, Ugurbil K, Kim DS. 3-D diffusion tensor axonal tracking shows distinct SMA and pre-SMA projections to the human striatum. Cereb Cortex. 2004;14:1302–1309. doi: 10.1093/cercor/bhh091. [DOI] [PubMed] [Google Scholar]
- Levitt H. Transformed up-down methods in psychoacoustics. J Acoust Soc Am. 1970;49:467–477. [PubMed] [Google Scholar]
- Li C-SR, Huang C, Constable T, Sinha R. Imaging response inhibition in a stop signal task – neural correlates independent of signal monitoring and post-response processing. J Neurosci. 2006a;26:186–192. doi: 10.1523/JNEUROSCI.3741-05.2006. [DOI] [PMC free article] [PubMed] [Google Scholar]
- Li C-SR, Huang C, Constable T, Sinha R. Gender differences in the neural correlates of response inhibition during a stop signal task. NeuroImage. 2006b;32:1918–1929. doi: 10.1016/j.neuroimage.2006.05.017. [DOI] [PubMed] [Google Scholar]
- Li C-SR, Huang C, Yan P, Bhagawar Z, Milivojevic V, Sinha R. Neural correlates of impulse control during stop signal inhibition in cocaine dependent men. Neuropsychopharmacology. doi: 10.1038/sj.npp.1301568. In Press-a. [DOI] [PMC free article] [PubMed] [Google Scholar]
- Li C-SR, Huang C, Yan P, Paliwal P, Constable RT, Sinha R. Neural correlates of post-error slowing during a stop signal task – a functional magnetic resonance imaging study. J Cognit Neurosci. doi: 10.1162/jocn.2008.20071. In Press-b. [DOI] [PMC free article] [PubMed] [Google Scholar]
- Li C-SR, Mathalon DH, Krystal JH. Fore-period effect and stop signal processing time. Exp Brain Res. 2005;167:305–309. doi: 10.1007/s00221-005-0110-2. [DOI] [PubMed] [Google Scholar]
- Li C-SR, Milivojevic V, Kemp KA, Hong K, Sinha R. Performance monitoring and stop signal inhibition in abstinent patients with cocaine dependence. Drug Alcoh Depend. 2006c;85:205–212. doi: 10.1016/j.drugalcdep.2006.04.008. [DOI] [PubMed] [Google Scholar]
- Liddle PF, Kiehl KA, Smith AM. Event-related fMRI study of response inhibition. Hum Brain Mapp. 2001;12:100–109. doi: 10.1002/1097-0193(200102)12:2<100::AID-HBM1007>3.0.CO;2-6. [DOI] [PMC free article] [PubMed] [Google Scholar]
- Logan GD. On the ability to inhibit thought and action: A user’s guide to the stop signal paradigm. In: Dagenbach D, Carr TH, editors. Inhibitory Processes in Attention, Memory and Language. Academic Press; San Diego: 1994. pp. 189–239. 1994. [Google Scholar]
- Logan GD, Cowan WB. On the ability to inhibit thought and action: A theory of an act of control. Psychol Rev. 1984;91:295–327. doi: 10.1037/a0035230. [DOI] [PubMed] [Google Scholar]
- Logan GD, Cowan WB, Davis KA. On the ability to inhibit simple and choice reaction time responses: a model and a method. J Exp Psychol Hum Percept Perform. 1984;10:276–291. doi: 10.1037//0096-1523.10.2.276. [DOI] [PubMed] [Google Scholar]
- Lungu OV, Binenstock MM, Pline MA, Yeaton JR, Carey JR. Neural changes in control implementation of a continuous task. J Neurosci. 2007;27:3010–3016. doi: 10.1523/JNEUROSCI.5051-06.2007. [DOI] [PMC free article] [PubMed] [Google Scholar]
- Mai JK, Paxinos G, Asheuer JK. Atlas of the Human Brain. 2. Academic Press; New York, NY: 2003. [Google Scholar]
- Maldjian JA, Laurienti PJ, Kraft RA, Burdette JH. An automated method for neuroanatomic and cytoarchitectonic atlas-based interrogation of fMRI data sets. Neuroimage. 2003;19:1233–1239. doi: 10.1016/s1053-8119(03)00169-1. [DOI] [PubMed] [Google Scholar]
- Marchand WR, Lee JN, Thatcher JW, Thatcher GW, Jensen C, Starr J. An fMRI study of frontal-subcortical skelemotor circuit and dorsolateral prefrontal cortex function using a paced motor activation paradigm. Brain Imag Behav. 2007;1:58–67. [Google Scholar]
- Marchand WR, Lee JN, Thatcher JW, Thatcher GW, Jensen C, Starr J. Motor deactivation in the human cortex and basal ganglia. Neuroimage. 2007;38:538–548. doi: 10.1016/j.neuroimage.2007.07.036. [DOI] [PubMed] [Google Scholar]
- Mehler-Wex C, Riederer P, Gerlach M. Dopaminergic dysbalance in distinct basal ganglia neurocircuits: implications for the pathophysiology of Parkinson’s disease, schizophrenia and attention deficit hyperactivity disorder. Neurotox Res. 2006;10:167–179. doi: 10.1007/BF03033354. [DOI] [PubMed] [Google Scholar]
- Monakow KH, Akert K, Künzle H. Projections of the precentral motor cortex and other cortical areas of the frontal lobe to the subthalamic nucleus in the monkey. Exp Brain Res. 1978;33:395–403. doi: 10.1007/BF00235561. [DOI] [PubMed] [Google Scholar]
- Monchi O, Petrides M, Strafella AP, Worsley KJ, Doyon J. Functional role of the basal ganglia in the planning and execution of actions. Ann Neurol. 2006;59:257–264. doi: 10.1002/ana.20742. [DOI] [PubMed] [Google Scholar]
- Mueller VA, Brass M, Waszak F, Prinz W. The role of the preSMA and the rostral cingulate zone in internally selected actions. Neuroimage. 2007;37:1354–1361. doi: 10.1016/j.neuroimage.2007.06.018. [DOI] [PubMed] [Google Scholar]
- Nachev P, Rees G, Parton A, Kennard C, Husain M. Volition and conflict in human medial frontal cortex. Curr Biol. 2005;15:122–128. doi: 10.1016/j.cub.2005.01.006. [DOI] [PMC free article] [PubMed] [Google Scholar]
- Nambu A, Takada M, Inase M, Tokuno H. Dual somatotopical representations in the primate subthalamic nucleus: evidence for ordered but reversed body-map transformations from the primary motor cortex and the supplementary motor area. J Neurosci. 1996;16:2671–2683. doi: 10.1523/JNEUROSCI.16-08-02671.1996. [DOI] [PMC free article] [PubMed] [Google Scholar]
- Nambu A, Tokuno H, Hamada I, Kita H, Imanishi M, Akazawa T, Ikeuchi Y, Hasegawa N. Excitatory cortical inputs to pallidal neurons via the subthalamic nucleus in the monkey. J Neurophysiol. 2000;84:289–300. doi: 10.1152/jn.2000.84.1.289. [DOI] [PubMed] [Google Scholar]
- Nambu A, Tokuno H, Inase M, Takada M. Corticosubthalamic input zones from forelimb representations of the dorsal and ventral divisions of the premotor cortex in the macaque monkey: comparison with the input zones from the primary motor cortex and the supplementary motor area. Neurosci Lett. 1997;239:13–16. doi: 10.1016/s0304-3940(97)00877-x. [DOI] [PubMed] [Google Scholar]
- Nys GM, van Zandvoort MJ, van der Worp HB, Kappelle LJ, de Haan EH. Neuropsychological and neuroanatomical correlates of perseverative responses in subacute stroke. Brain. 2006;129:2148–2157. doi: 10.1093/brain/awl199. [DOI] [PubMed] [Google Scholar]
- Palmer C, Schmidt EM, McIntosh JS. Corticospinal and corticorubral projections from the supplementary motor area in the monkey. Brain Res. 1981;209:305–314. doi: 10.1016/0006-8993(81)90155-4. [DOI] [PubMed] [Google Scholar]
- Perlmutter JS, Mink JW. Deep brain stimulation. Annu Rev Neurosci. 2006;29:229–257. doi: 10.1146/annurev.neuro.29.051605.112824. [DOI] [PMC free article] [PubMed] [Google Scholar]
- Penny W, Holmes AP. Random-effects analysis. In: Frackowiak, et al., editors. Human Brain Function. Elsevier; San Diego: 2004. pp. 843–850. [Google Scholar]
- Pliszka SR, Glahn DC, Semrud-Clikeman M, Franklin C, Perez R, 3rd, Xiong J, Liotti M. Neuroimaging of inhibitory control areas in children with attention deficit hyperactivity disorder who were treatment naive or in long-term treatment. Am J Psychiatry. 2006;163:1052–1060. doi: 10.1176/ajp.2006.163.6.1052. [DOI] [PubMed] [Google Scholar]
- Poldrack RA. Neural systems for perceptual skill learning. Behav Cogn Neurosci Rev. 2002;1:76–83. doi: 10.1177/1534582302001001005. [DOI] [PubMed] [Google Scholar]
- Prodoehl J, Yu H, Little DM, Abraham I, Vaillancourt DE. Region of interest template for the human basal ganglia: Comparing EPI and standardized space approach. NeuroImage. doi: 10.1016/j.neuroimage.2007.09.027. In Press. [DOI] [PMC free article] [PubMed] [Google Scholar]
- Rabbit PMA. Errors and error correction in choice-response tasks. J Exp Psychol. 1966;71:264–272. doi: 10.1037/h0022853. [DOI] [PubMed] [Google Scholar]
- Riecker A, Wildgruber D, Mathiak K, Grodd W, Ackermann H. Parametric analysis of rate-dependent hemodynamic response functions of cortical and subcortical brain structures during auditorily cued finger tapping: a fMRI study. NeuroImage. 2003;18:731–739. doi: 10.1016/s1053-8119(03)00003-x. [DOI] [PubMed] [Google Scholar]
- Rijkers K, Temel Y, Visser-Vandewalle V, Vanormelingen L, Vandersteen M, Adriaensen P, Gelan J, Beuls EA. The microanatomical environment of the subthalamic nucleus. Technical note. J Neurosurg. 2007;107:198–201. doi: 10.3171/JNS-07/07/0198. [DOI] [PubMed] [Google Scholar]
- Robbins TW. Shifting and stopping: fronto-striatal substrates, neurochemical modulation and clinical implications. Philos Trans R Soc Lond (B) 2007;362:917–932. doi: 10.1098/rstb.2007.2097. [DOI] [PMC free article] [PubMed] [Google Scholar]
- Rubia K, Smith AB, Brammer MJ, Taylor E. Right inferior prefrontal cortex mediates response inhibition while mesial prefrontal cortex is responsible for error detection. Neuroimage. 2003;20:351–358. doi: 10.1016/s1053-8119(03)00275-1. [DOI] [PubMed] [Google Scholar]
- Rubia K, Smith AB, Brammer MJ, Toone B, Taylor E. Abnormal brain activation during inhibition and error detection in medication-naïve adolescents with ADHD. Am J Psychiatry. 2005;162:1067–1075. doi: 10.1176/appi.ajp.162.6.1067. [DOI] [PubMed] [Google Scholar]
- Rushworth MF, Hadland KA, Paus T, Sipila PK. Role of the human medial frontal cortex in task switching: a combined fMRI and TMS study. J Neurophysiol. 2002;87:2577–2592. doi: 10.1152/jn.2002.87.5.2577. [DOI] [PubMed] [Google Scholar]
- Sato M, Hikosaka O. Role of primate substantia nigra pars reticulata in reward-oriented saccadic eye movement. J Neurosci. 2002;22:2363–2373. doi: 10.1523/JNEUROSCI.22-06-02363.2002. [DOI] [PMC free article] [PubMed] [Google Scholar]
- Seger CA. The basal ganglia in human learning. Neuroscientist. 2006;12:285–290. doi: 10.1177/1073858405285632. [DOI] [PubMed] [Google Scholar]
- Shima K, Mushiake H, Saito N, Tanji J. Role for cells in the presupplementary motor area in updating motor plans. Proc Natl Acad Sci (USA) 1996;93:8694–8698. doi: 10.1073/pnas.93.16.8694. [DOI] [PMC free article] [PubMed] [Google Scholar]
- Simmonds DJ, Pekar JJ, Mostofsky SH. Meta-analysis of Go/No-go tasks demonstrating that fMRI activation associated with response inhibition is task-dependent. Neuropsychologia. doi: 10.1016/j.neuropsychologia.2007.07.015. In Press. [DOI] [PMC free article] [PubMed] [Google Scholar]
- Spraker MB, Yu H, Corcos DM, Vaillancourt DE. Role of individual Basal Ganglia nuclei in force amplitude generation. J Neurophysiol. 2007;98:821–834. doi: 10.1152/jn.00239.2007. [DOI] [PMC free article] [PubMed] [Google Scholar]
- Sumner P, Nachev P, Morris P, Peters AM, Jackson SR, Kennard C, Husain M. Human medial frontal cortex mediates unconscious inhibition of voluntary action. Neuron. 2007;54:697–711. doi: 10.1016/j.neuron.2007.05.016. [DOI] [PMC free article] [PubMed] [Google Scholar]
- Suskauer SJ, Simmonds DJ, Fotedar S, Blankner JG, Pekar JJ, Denckla MB, Mostofsky SH. Functional Magnetic Resonance Imaging Evidence for Abnormalities in Response Selection in Attention Deficit Hyperactivity Disorder: Differences in Activation Associated with Response Inhibition But Not Habitual Motor Response. J Cognit Neurosci. doi: 10.1162/jocn.2008.20032. In Press. [DOI] [PMC free article] [PubMed] [Google Scholar]
- Takada M, Tokuno H, Hamada I, Inase M, Ito Y, Imanishi M, Hasegawa N, Akazawa T, Hatanaka N, Nambu A. Organization of inputs from cingulate motor areas to basal ganglia in macaque monkey. Eur J Neurosci. 2001;14:1633–1650. doi: 10.1046/j.0953-816x.2001.01789.x. [DOI] [PubMed] [Google Scholar]
- Tan SK, Temel Y, Blokland A, Steinbusch HW, Visser-Vandewalle V. The subthalamic nucleus: From response selection to execution. J Chem Neuroanat. 2006;31:155–161. doi: 10.1016/j.jchemneu.2006.01.001. [DOI] [PubMed] [Google Scholar]
- Tzourio-Mazoyer N, Landeau B, Papathanassiou D, Crivello F, Etard O, Delcroix N, et al. Automated anatomical labeling of activations in SPM using a macroscopic anatomical parcellation of the MNI MRI single-subject. Neuroimage. 2002;15:273–289. doi: 10.1006/nimg.2001.0978. [DOI] [PubMed] [Google Scholar]
- Tunik E, Schmitt PJ, Grafton ST. BOLD coherence reveals segregated functional neural interactions when adapting to distinct torque perturbations. J Neurophysiol. 2007;97:2107–2120. doi: 10.1152/jn.00405.2006. [DOI] [PMC free article] [PubMed] [Google Scholar]
- van den Wildenberg WP, van Boxtel GJ, van der Molen MW, Bosch DA, Speelman JD, Brunia CH. Stimulation of the subthalamic region facilitates the selection and inhibition of motor responses in Parkinson’s disease. J Cogn Neurosci. 2006;18:626–636. doi: 10.1162/jocn.2006.18.4.626. [DOI] [PubMed] [Google Scholar]
- Vink M, Kahn RS, Raemaekers M, van den Heuvel M, Boersma M, Ramsey NF. Function of striatum beyond inhibition and execution of motor responses. Hum Brain Mapp. 2005;25:336–344. doi: 10.1002/hbm.20111. [DOI] [PMC free article] [PubMed] [Google Scholar]
- Vink M, Ramsey NF, Raemaekers M, Kahn RS. Striatal dysfunction in schizophrenia and unaffected relatives. Biol Psychiatry. 2006;60:32–39. doi: 10.1016/j.biopsych.2005.11.026. [DOI] [PubMed] [Google Scholar]
- Wetherill GB, Chen H, Vasudeva RB. Sequential estimation of quantal response curves: A new method of estimation. Biometrika. 1966;53:439–454. [Google Scholar]
- Yelnik J, Bardinet E, Dormont D, Malandain G, Ourselin S, Tandé D, Karachi C, Ayache N, Cornu P, Agid Y. A three-dimensional, histological and deformable atlas of the human basal ganglia. I. Atlas construction based on immunohistochemical and MRI data. Neuroimage. 2007;34:618–638. doi: 10.1016/j.neuroimage.2006.09.026. [DOI] [PubMed] [Google Scholar]
- Zhu XL, Hamel W, Schrader B, Weinert D, Hedderich J, Herzog J, Volkmann J, Deuschl G, Müller D, Mehdorn HM. Magnetic resonance imaging-based morphometry and landmark correlation of basal ganglia nuclei. Acta Neurochir (Wien) 2002;144:959–969. doi: 10.1007/s00701-002-0982-x. [DOI] [PubMed] [Google Scholar]
Associated Data
This section collects any data citations, data availability statements, or supplementary materials included in this article.