

Abstract
Although sterol carrier protein-2 (SCP-2) is encoded as a precursor protein (proSCP-2), little is known regarding the structure and function of the 20-amino acid N-terminal presequence. As shown herein, the presequence contains significant secondary structure and alters SCP-2: (i) secondary structure (CD), (ii) tertiary structure (aqueous exposure of Trp shown by UV absorbance, fluorescence, fluorescence quenching), (iii) ligand binding site [Trp response to ligands, peptide cross-linked by photoactivatable free cholesterol (FCBP)], (iv) selectivity for interaction with anionic phospholipid-rich membranes, (v) interaction with a peroxisomal import protein [FRET studies of Pex5p(C) binding], the N-terminal presequence increased SCP-2’s affinity for Pex5p(C) by 10-fold, and (vi) intracellular targeting in living and fixed cells (confocal microscopy). Nearly 5-fold more SCP-2 than proSCP-2 colocalized with plasma membrane lipid rafts/caveolae (AF488-CTB), 2.8-fold more SCP-2 than proSCP-2 colocalized with a mitochondrial marker (Mitotracker), but nearly 2-fold less SCP-2 than proSCP-2 colocalized with peroxisomes (AF488-antibody to PMP70). These data indicate the importance of the N-terminal presequence in regulating SCP-2 structure, cholesterol localization within the ligand binding site, membrane association, and, potentially, intracellular targeting.
Keywords: sterol carrier protein-2, presequence, cholesterol, peroxin, peroxisome
Sterol carrier protein-2 (SCP-2)1 is a ubiquitous, soluble protein present at highest level in tissues involved in cholesterol uptake (intestine), oxidation (liver, steroidogenic cells), and/or elimination (liver) (reviewed in ref 1). SCP-2 exhibits high (nanomolar Kd values) affinity for cholesterol and also binds oxidized sterols (bile acids, cholesterol hydroperoxides) as well as a variety of other lipids (e.g., fatty acids/fatty acyl CoAs, phospholipids, isoprenoids) (reviewed in refs 1 and 2). Studies in vitro and with gene-targeted mice and rats suggest roles for SCP-2 in cholesterol esterification, steroid hormone synthesis, 7α-cholesterol formation (bile acid precursor), and biliary secretion of cholesterol and bile acids (reviewed in ref 1). Overexpression of SCP-2 in cultured cells enhanced cholesterol uptake, inhibited HDL-mediated cholesterol efflux, increased cholesterol transfer from plasma membranes and plasma membrane lipid rafts/caveolae (but not non-rafts) to endoplasmic reticulum (ER) for esterification (reviewed in refs 1, 3, and 4). While these studies suggest potential physiological function(s) of SCP-2 in cholesterol and fatty acid metabolism, resolution of individual role(s) has proven to be complex due to the presence of multiple protein products arising from the SCP-2 gene as well as incomplete understanding of factors regulating their respective intracellular distributions.
Since early liver biochemical fractionation studies isolated 13 kDa SCP-2 as a soluble protein, SCP-2 was initially thought to be primarily a cytosolic protein (reviewed in ref 1). The finding that nearly half of the total SCP-2 was membrane-associated (peroxisomes, mitochondria, endoplasmic reticulum) in these studies could be attributed to binding of this basic protein (pI > 8.5) to the cytofacial face of organelle membranes (reviewed in ref 1). While these studies suggested largely a cytosolic localization of SCP-2, double immunolabeling microscopy (confocal, EM) detected SCP-2 in the greatest amount in peroxisomes as well as significant amounts in cytosol, mitochondria, endoplasmic reticulum, and plasma membrane lipid rafts and caveolae, but not in nuclei or lysosomes (reviewed in refs 1 and 5–7). The molecular basis for targeting SCP-2 to specific membrane organelles, especially peroxisomes and mitochondria, is not completely clear. First, early amino acid sequencing studies of native SCP-2 purified from bovine and rat liver did not detect a C-terminal peroxisomal targeting sequence, while a subsequent study detected a C-terminal AKL, i.e., a peroxisomal targeting sequence-1 (PTS-1) in native rat liver SCP-2 (reviewed in ref 1). Second, comparison of the N-terminal amino acid sequence of SCP-2 to mitochondrial targeting sequences, suggested that SCP-2 may be targeted to mitochondria (8). Third, the advent of cDNA isolation and sequencing revealed additional surprises: the SCP-2 gene does not encode the 13 kDa SCP-2 normally found in tissues (reviewed in ref 9). Instead, the SCP-2 gene encodes a precursor protein, 15 kDa proSCP-2, which contains a 20-amino acid N-terminal presequence and a C-terminal AKL peroxisomal targeting sequence-1 (PTS-1) (Figure 1). As shown in Figure 1, the 15 kDa proSCP-2 undergoes complete posttranslational cleavage of the N-terminal 20-amino acid presequence to yield the mature 13 kDa SCP-2 and a 20-amino acid peptide (reviewed in ref 9). While these cDNA based studies suggested that all the SCP-2 should be peroxisomal, the biochemical fractionation and morphological (EM, confocal) studies suggest that the N-terminal presequence and/or posttranslational modifications of the C-terminus of the protein modify this targeting.
Figure 1.

Secondary structure predictions of proSCP-2, SCP-2, and four N-terminal peptides. Secondary structure predictions were performed utilizing the methods of Rost, et al. (53, 54). The following protein or peptide sequences were analyzed: proSCP-2, human proSCP-2; SCP-2, human SCP-2; −20-+1proSCP-2, N-terminal 20-amino acid leader sequence of human proSCP-2; −20-+9proSCP-2, N-terminal 20-amino acid leader sequence and N-terminal nine-amino acid sequence of human proSCP-2; −20-+24proSCP-2, N-terminal 20-amino acid leader sequence and N-terminal 24-amino acid sequence of human proSCP-2; +1-+24SCP-2, N-terminal 24-amino acid sequence of human SCP-2. α represents α-helix, β β-sheet, αpre(?) the predicted α-helix in the proSCP-2 leader sequence, βpre(?) the predicted β-sheet in the proSCP-2 leader sequence. 50Trp is located within β2. The ligand binding domain (LBD) comprises α1, α3, and β1-β5. PTS-1 (AKL) is located at the C terminus.
Western blotting, RNA analysis, and cDNA analysis reveal that SCP-2 is also expressed as a larger (i.e., 58 kDa) protein termed SCP-x (reviewed in ref 9). SCP-x is comprised of a 3-ketoacyl CoA thiolase enzyme (fused to the N-terminus of the 13 kDa SCP-2) and contains a C-terminal PTS-1. While the 58 kDa SCP-x exhibits unique specificity for oxidizing branched-chain fatty acids, it also facilitates cholesterol transfer and metabolism as well as fatty acid (branched- and straight-chain) oxidation in vitro and in vivo (reviewed in refs 9 and 10). Unlike SCP-2, however, the 58 kDa SCP-x is found exclusively in peroxisomes (reviewed in ref 9). While the 58 kDa SCP-x undergoes partial posttranslational cleavage to yield a 46 kDa thiolase, it is not clear whether the other cleavage product is degraded or comprises mature 13 kDa SCP-2 (reviewed in ref 9). However, studies with 58 kDa SCP-x gene-ablated mice did not reveal decreased hepatic levels of SCP-2, thereby suggesting that either 13 kDa SCP-2 must arise primarily from the alternate transcript (15 kDa proSCP-2) or the latter is upregulated upon ablation of the 58 kDa SCP-x (4, 10). While the tertiary structure of 58 kDa SCP-x has not been resolved, the presence of the long (46 kDa) 3-ketoacyl-CoA-thiolase enzyme fused to the N-terminus significantly reduces but does not abolish cholesterol transfer and phospholipid transfer activities in vitro (11).
While the properties of 13 kDa SCP-2 have been the subject of intensive investigation for over 20 years, almost nothing is known about the structure, function, and metabolism of the 20-amino acid polypeptide either present as part of the N-terminus of 15 kDa proSCP-2 or released by posttranslational cleavage therefrom (reviewed in ref 9). While it has been proposed that cleavage of the N-terminal presequence occurs either within the peroxisomal matrix or at the cytoplasmic face of the peroxisomal membrane, the former possibility is unlikely since very few peroxisomal proteins undergo cleavage of their N-terminal presequences during or after import into peroxisomes and nearly half of total cellular SCP-2 is extraperoxisomal (reviewed in refs 8 and 9). It has also been suggested that the N-terminal 20-amino acid presequence has some similarity to mitochondrial sequences (reviewed in refs 8 and 9). Since mitochondrial proteins commonly undergo cleavage of their N-terminal presequences, it has been suggested that cleavage of the 15 kDa proSCP-2 presequence may occur at the mitochondria (reviewed in ref 8). The presence of the N-terminal presequence also significantly decreases (but less so than the N-terminal thiolase in the 58 kDa SCP-x) the in vitro cholesterol transfer and fatty acid binding activities as shown in some studies (reviewed in ref 9).
Although the X-ray and NMR structures of both the 13 kDa SCP-2 and 15 kDa proSCP-2 have been reported, rapid segmental mobility of the N-terminal presequence and C-terminal PTS-1 sequences have precluded accurate assignment of and correlation of structural properties and location with interactions of these segments of the respective proteins with lipid ligands or with protein ligands (reviewed in refs 12–14). The studies presented herein were designed to provide structural and functional insights into the role of the N-terminal 20-amino acid sequence. The data showed for the first time that the N-terminal 20-amino acid presequence significantly altered SCP-2 tertiary structure, the location of cholesterol within the SCP-2 ligand binding site, interaction of SCP-2 with anionic phospholipid-rich membranes, interaction of SCP-2 with a protein participating in peroxisomal import, and, potentially, SCP-2 differential intracellular targeting.
EXPERIMENTAL PROCEDURES
Materials
Recombinant human proSCP-2 and SCP-2 were isolated and purified as described previously (8). Purities of proSCP-2 and SCP-2 were determined by sodium dodecyl sulfate-polyacrylamide gel electrophoresis (SDS-PAGE) (15) followed by silver-staining. The correct molecular mass of each protein was confirmed by matrix-assisted laser desorption time-of-flight (MALDI-TOF) mass spectrometry utilizing a saturated methanol solution of α-cyano-4-hydroxycinnamic acid (Sigma Aldrich, St. Louis, MO) as the matrix (16) and by electrospray ionization (ESI) mass spectrometry (Laboratory for Biological Mass Spectrometry, Department of Chemistry, Texas A&M University). Peptide synthesis, purification, and characterization were accomplished by J. Ball (Peptide Synthesis Core Facility, Department of Pathobiology, Texas A&M University, College Station, TX) as described previously (17). The peptides generated were as follows: (1) −20-+1proSCP-2 (MGFPEAASSF RTHQIEAVPT), (2) −20-+9proSCP-2 (MGFPEAASSF RTHQIEAVPT SSASDGFKA), (3) −20-+24proSCP-2 (MGFPEAASSF RTHQIEAVPT SSASDGFKAN LVFKEIEKKL EEEG), and (4) +1-+24SCP-2 (SSASDGFKAN LVFKEIEKKL EEEG) (Figure 1). A 41-kDa fragment of peroxin 5 [Pex5p(C)] comprising residues 235-602 and encompassing the seven-predicted tetratricopeptide repeat (TPR) region as well as the peroxisomal targeting signal-1 (PTS-1) binding region of human Pex5p was generated and purified by J. M. Berg (National Institutes of Health) (18). Free cholesterol benzophenone (FCBP) was synthesized by T. A. Spencer (Department of Chemistry, Dartmouth College) (19). Radiolabelled free cholesterol benzophenone ([3H]FCBP) was prepared for our laboratory by Moravek Biochemicals (Brea, CA) utilizing a procedure (20) that incorporates 3H at position C-3 of the cholesterol moiety. Cholesterol, oleic acid, and oleoyl-CoA were from Sigma (St. Louis, MO). All other reagents and solvents used were of the highest grade available.
Determination of SCP-2, ProSCP-2, and N-terminal Presequence Peptide Concentrations
The concentrations of SCP-2 or proSCP-2 protein stock solutions were determined by three separate methods: (i) amino acid analysis (Protein Chemistry Laboratory, Department of Biochemistry & Biophysics, Texas A&M University), (ii) the theoretical molar absorption coefficient used to calculate protein concentration from the UV absorbance at 280 nm (21), and (iii) Bradford assay (22). N-Terminal peptide concentrations were determined by amino acid analysis (Protein Chemistry Laboratory, Department of Biochemistry and Biophysics, Texas A&M University). Unless otherwise noted, the concentration of a SCP-2 or proSCP-2 protein stock solution based on amino acid analysis was used for all subsequent experiments.
Absorbance and Fluorescence Spectroscopy
Ultraviolet (UV) absorbance spectroscopy was performed utilizing a Cary 100 Scan UV-visible spectrophotometer (Varian Inc., Palo Alto, CA). Absorbance spectra were obtained at 24 °C on samples containing 0.5 μM SCP-2, proSCP-2, or tryptophan in 10 mM potassium phosphate (pH 7.4). Fluorescence emission spectra were recorded at 24 °C utilizing a PC1 photon-counting spectrofluorometer (ISS Inc., Champaign, IL). Unless otherwise noted, fluorescence emission spectroscopy was performed on samples containing 0.5 μM SCP-2, proSCP-2, or tryptophan in 10 mM potassium phosphate (pH 7.4). All spectra were corrected for background.
Absorbance and fluorescence spectroscopy of proSCP-2 or SCP-2 in the presence of lipidic ligands were accomplished as described above with the following modifications. The final protein concentration was 5 μM in 10 mM potassium phosphate (pH 7.4). Increasing amounts of appropriate ligands (cholesterol, oleic acid, or oleoyl-CoA) were added to a final ligand concentration of 10 μM utilizing a 1 mM stock solution prepared in dimethylformamide (DMF).
Acrylamide Quenching of Tryptophan Fluorescence
Acrylamide quenching and quenching constant determination were performed as described previously (23–25) to investigate the degree of aqueous exposure of the sole tryptophan (50Trp) present in both proSCP-2 and SCP-2. Briefly, fluorescence emission spectra of proSCP-2, SCP-2, or tryptophan (Trp) in the absence (F0) or presence (F) of the small molecule quencher, acrylamide, were obtained by the following procedure. Protein or tryptophan at a final concentration of 1 μM in 10 mM potassium phosphate (pH 7.4) was excited at 280 nm and the fluorescence emission spectrum was obtained utilizing a PC-1 spectrofluorometer as described above. For the acrylamide quenching studies, aliquots of a 5 M stock solution of acrylamide were added to the protein or Trp solution, mixed gently, and the fluorescence emission spectrum was obtained as described above. Each fluorescence emission spectrum was background-corrected utilizing either buffer only or the appropriate acrylamide/buffer solution to eliminate any quencher artifacts.
To calculate the quenching constant(s), Stern-Volmer plots of F0/F versus [Q] were generated, where F0 represents tryptophan fluorescence intensity in the absence of acrylamide quencher, F represents tryptophan fluorescence intensity in the presence of acrylamide quencher, and [Q] represents the molar acrylamide concentration. Curve-fitting analysis of each Stern-Volmer plot was performed using the equation: y = y0 + aebx where y0 = y-intercept and a and b are constants (R2 ≥ 0.98 for all plots). A plot of (F0/F −1)/[Q] versus [Q] permitted calculation of KD (dynamic quenching constant) and KS (static quenching constant) from the slope of the line (slope = KDKS) and from the y-intercept (y-intercept = KD + KS) utilizing the appropriate quadratic equation (25).
Secondary Structure Determination
Circular dichroism (CD) spectra were obtained utilizing a J-710 spectropolarimeter (JASCO Inc., Easton, MD) essentially as described (26–28). The samples for CD analysis contained protein (4 μM) or peptide (15 μM) in 10 mM potassium phosphate (pH 7.4) with or without lipidic small unilamellar vesicles (SUVs, 1 mM). Samples were scanned from 185 to 260 nm using the following conditions: step resolution, 1 nm; bandwidth, 2 nm; sensitivity, 10 mdeg; scan rate, 50 nm/min; and time constant, 1 s. For each measurement, ten scans were averaged, smoothed, background-subtracted, and converted to mean residue molar ellipticity [θ] (deg cm2 dmol−1). The percentage α-helix for the N-terminal peptides was estimated utilizing the following equation: θ222 = (fh − iκ/N)[θh222∞], where θ222 is the mean residue molar ellipticity at 222 nm, fh is the fraction in α-helical form, i is the number of helices, κ is a wavelength-specific constant (2.6 at 222 nm), N is the number of residues in the peptide, and θh222∞ is the molar ellipticity for a helix of infinite length at 222 nm (−39500 deg cm2 dmol−1). The percentage composition of α-helices, β-strands, turns, and unordered structures for each protein was determined utilizing the software package CDPro (lamar.colostate.edu/~sreeram/CDPro). This program allows the percentage calculation of various secondary structures by three different methods: CDSSTR, CONTIN/LL, and SELCON3 (29).
FCBP Cross-Linking
To determine the effect of the SCP-2 presequence on the interaction of cholesterol within the ligand binding pocket, cross-linking of the photoactivatable cholesterol analog FCBP to either SCP-2 or proSCP-2 was carried out essentially as described previously (30). A 200 μM stock solution of FCBP was prepared in ethanol (final specific radioactivity of 2.8 × 10¹⁵ dpm/mol). Prior to protein addition, the appropriate amount of [3H]FCBP was added to an amber glass vial so that the final molar ratio of FCBP to protein would be either 2:1 or 10:1 as described in Results. After addition of the [3H]FCBP to the vial, the solvent was removed using a gentle stream of N2 leaving a thin film of [3H]FCBP on the vial wall. Each cross-linking reaction was accomplished utilizing a final protein concentration of 2.5 μM in 10 mM potassium phosphate (pH 7.4). After protein addition, the solution was mixed by brief vortexing and by the use of a water bath sonicator for 15 min at ambient temperature. The protein/[3H]FCBP solution was transferred to a quartz cuvette and cross-linking was accomplished by illuminating the sample (365 nm) at ambient temperature utilizing a Blak-Ray model B100AP long wave ultraviolet lamp (UVP, Inc., Upland, CA) for the appropriate period of time. Any aggregates that formed during the reaction were removed by a brief centrifugation at 20000g. The protein-[3H]FCBP covalent complex was separated from unreacted [3H]FCBP by size-exclusion chromatography using BioGel P4 resin (Bio-Rad, Hercules, CA). Protein was quantified by the Bradford protein assay. The amount of [3H]-FCBP associated with protein was determined by liquid scintillation counting utilizing a Packard 1600 TR liquid scintillation analyzer (Packard Instrument Co., Meriden, CT). A standard curve was generated in order to determine the counting efficiency of the liquid scintillation instrument; this was used to convert the 3H counts per minute to 3H disintegrations per minute.
Covalent attachment of [3H]FCBP to protein was assessed both qualitatively and quantitatively by removing an aliquot of the cross-linking reaction, separating cross-linked [3H]FCBP/protein unimers from potential higher-order multimers utilizing sodium dodecyl sulfate-polyacrylamide gel electrophoresis (SDS-PAGE) (15), blotting the [3H]FCBP/protein solution onto nitrocellulose, and probing the nitrocellulose with a polyclonal anti-SCP-2 antibody. After color development to visualize the protein band of interest, 5 mm × 5 mm sections of the nitrocellulose were counted for 3H by liquid scintillation counting as described above.
Proteolytic Digestion of SCP-2 and ProSCP-2 Cross-Linked with FCBP
Stock solutions of SCP-2 (1.2 mg/mL) and proSCP-2 (5.4 mg/mL) were diluted in ddH2O to 1.0 mg/mL prior to proteolytic digestion. The FCBP-SCP-2 and FCBP-proSCP-2 forms cross-linked as described in the preceding section were at concentrations of 0.15 and 0.13 mg/mL, respectively. To each sample was added a 100 μL aliquot of 50 mM ammonium bicarbonate, resulting in a 2-fold dilution. The native and FCBP-modified protein samples were digested overnight at 37 °C with trypsin (20 μg/mL), which was prepared in 50-mM acetic acid. Following proteolytic digestion, all samples were diluted 2-fold in 0.1% trifluoroacetic acid (TFA) prior to sample cleanup using C18 resin ZipTips (Millipore, Billerica, MA). Peptides were eluted using 5 μL of a-cyano-4-hydroxycinnamic acid prepared at 5 mg/mL in a 60:40 (v:v) acetonitrile/ddH2O solution containing 10 mM ammonium dihydrogen phosphate and 0.1% TFA. Samples (1μL) were spotted onto the MALDI plate that had been pretreated with a saturated methanol solution of matrix (α-cyano-4-hydroxycinnamic acid) and analyzed in triplicate.
MALDI-MS and MS/MS
All MALDI-MS experiments were performed essentially as described previously (16) utilizing a 4700 Proteomics Analyzer MALDI-TOF/TOF (Applied Biosystems, Foster City, CA). The MS data were acquired using the reflectron detector in positive mode (500–4500 Da, 2100 Da focus mass) using 1200 laser shots with a six-point external plate calibration. Collision-induced dissociation tandem MS spectra were acquired using 20% greater laser power than the MS spectra acquisition using atmosphere at the medium pressure setting as the collision gas with 1 kV of collision energy. All MS and MS/MS data were searched against the Swiss-Prot protein sequence database using the GPS Explorer (Applied Biosystems) software. The database search parameters were the following: peptide mass tolerance, 85 ppm; tandem MS fragment ion mass tolerance, 0.3 Da; taxonomy, Homo sapiens; enzyme, trypsin; missed cleavages, 2; and variable modifications, oxidation (M).
Interaction of ProSCP-2 or SCP-2 Protein and N-terminal Peptides with Membranes [Small Unilamellar Vesicles (SUVs)]
Small unilamellar vesicles composed of POPC and cholesterol (65:35 molar ratio) or POPC, cholesterol, and DOPS (specific molar ratios as indicated in the figure legends) were prepared essentially as described previously (17). Briefly, lipids dissolved as chloroform stock solutions were mixed in an amber glass vial, dried under a gentle N2 stream to form a thin film on the wall of the vial, and resuspended in 10 mM MOPS (pH 7.4). The resuspended lipids were mixed by vortexing to form multilamellar vesicles, followed by sonication under N2 at 4 °C with a model 550 sonic dismembrator (Fisher Scientific, Pittsburgh, PA) to form SUVs. The microprobe energy was maintained at level 4 and pauses of 1 min between 2 min sonication periods were scheduled to allow sample cooling; the total sample sonication time was 30 min. Sonicator probe debris as well as any multilamellar vesicles was removed by centrifugation at 110000g for 4 h with a 40Ti rotor (Beckman Instruments, Fullerton, CA). A lipid phosphate assay was used to determine the lipid concentration of the final SUV solution (17).
Fluorescence Resonance Energy Transfer (FRET)
FRET was used to determine: (i) the relative Cy3-Cy5 distance between SCP-2 or proSCP-2 interacting with Pex5p(C) and (ii) the binding affinity of Pex5p(C) for SCP-2 or proSCP-2. Briefly, Pex5p(C) was labeled with Cy3 (FRET donor) while SCP-2 or proSCP-2 was labeled with Cy5 (FRET acceptor) using a Fluorolink antibody Cy3 and Cy5 labeling kit from Amersham Biosciences Corp. (Piscataway, NJ) according to the manufacturer’s recommendations for proteins as described previously (31). The Cy3 and Cy5 dye labeling procedure results in covalent attachment to the SCP-2 portion of proSCP-2 rather than the 20-amino acid N-terminal presequence (31). The proportions of Cy3 and Cy5 labeling reagents to SCP-2 or proSCP-2 were adjusted such that an average of one fluorophore was attached per protein molecule similarly as described previously by our laboratory for other proteins. FRET varies as (donor-to-acceptor distance)−6; therefore, the donor [Cy3-labeled Pex5p(C)] and the acceptor (Cy5-labeled SCP-2 or proSCP-2) must be very close together for efficient FRET to occur. A fixed amount of donor-labeled protein [10 nM for Cy3- Pex5p(C)] was incubated with increasing amounts of acceptor-labeled protein (Cy5-SCP-2 or Cy5-proSCP-2) in phosphate-buffered saline (pH 7.4). Cy3-labeled proteins were excited at 550 nm; fluorescence emission spectra were obtained from 560 to 700 nm at 24 °C with a PC1 photon counting spectrofluorometer (ISS Inc.), corrected for background (buffer only, donor only, and acceptor only), and maximal intensities were measured. Binding affinities were calculated from both the quenching of Cy3 donor fluorescence emission intensity (F0 − F) at 570 nm and the appearance of Cy5 acceptor-sensitized fluorescence intensity (FI) at 670 nm as a function of donor concentration as previously described (27). The Cy3-Cy5 distance was calculated according to the Förster equation (32) using the known critical distance for 50% efficiency of 50 Å for the Cy3-Cy5 FRET pair as described previously (5, 26).
Laser Scanning Confocal Microscopy (LSCM) and Image Analysis
Cy5-labeled SCP-2 or Cy5-labeled proSCP-2 (see above) were incorporated into cultured L-cells for LSCM by preincubating the respective Cy5-labeled proteins with Chariot transfection reagent (Active Motif, Carlsbad, CA) according to the manufacturer’s instructions and as described previously by our laboratory for other fluorescent labeled proteins (33, 34). Murine L-cells (L arpt−tk−) were seeded onto Laboratory-Tek chambered cover glass slides (VWR Scientific, Sugarland, TX) and cultured as previously described (35). Culture medium was then replaced with 0.5 ml of serum-free Higuchi medium containing 0.7 μg of protein (Cy5-labeled SCP-2-Chariot complex or Cy5-labeled proSCP-2-Chariot complex) per chamber well and the well incubated at 37 °C and 5% CO2 in a humidified chamber for 1 h. Following this incubation, 1 ml of complete Higuchi medium (containing 10% fetal bovine serum) was added to each chamber well, and cells were incubated for an additional 2 h as described above. Cells were washed with 1 ml cold PBS four times, and the final wash incubated at 4 °C for 10 min. For labeling the cells with a plasma membrane marker, the final PBS wash was replaced with 0.5 mL of cold PBS containing 0.4 μg/ml Alexa Fluor 488 (AF488)-cholera toxin B (Molecular Probes/Invitrogen Corp., Eugene, OR) per well, and cells were incubated at 4 °C for an additional 5 min before imaging. For labeling cells with a mitochondrial marker, the final PBS wash from above was replaced with 0.5 mL of Higuchi medium with 10% FBS containing 100 nM Mitotracker Green (Molecular Probes/Invitrogen) per well and the Cy5-labeled cells were incubated with the Mitotracker Green at 37 °C for 30 min. Prior to imaging, the labeling medium was removed and replaced with fresh Higuchi medium with 10% FBS.
LSCM studies were performed with a 63X Plan-Fluor oil immersion objective, numerical aperture 1.45, an Axiovert 135 microscope (Zeiss, Carl Zeiss Inc., Thornwood, NY), and an MRC-1024 fluorescence imaging system (Bio-Rad Corp., Hercules, CA). AlexaFluor 488 (AF488) and Mitotracker Green probes were excited at 488 nm utilizing a krypton-argon laser (5mW, all lines) (Coherent, Sunnyvale, CA) set at a scan strength of 10%, and emission was recorded utilizing a photomultiplier tube (PMT) after passing through a 540 nm/30 nm emission filter under manual gain and black level control. The Cy5 probe was excited at 647 nm utilizing the krypton-argon laser described above; emission of Cy5 was measured utilizing a PMT after passing through 680 nm/32 nm emission filter under manual gain and black level control. Images were acquired and analyzed by utilizing LaserSharp and MetaMorph from Bio-Rad Corp. and Advanced Scientific Imaging (Meraux, LA), respectively, as described previously (26).
To quantify the amount of Cy5-proSCP-2 and Cy5-SCP-2 remaining after incorporation into L cells, incubation, and LSCM, the following procedure was used. Cy5-SCP-2 or Cy5-proSCP-2 was incorporated into cultured L cells as described above. Following the 2 h incubation at 37 °C, half of the seeded chambers for each respective protein were harvested, the cells were removed and washed extensively, and cell homogenates were prepared as described previously (36). The remaining seeded chambers were prepared for LSCM as described above. After microscopy (microscopy duration time of 2 h), the cells were harvested and cell homogenates were prepared as described previously (36). All cell homogenates were examined for total protein content by Bradford analysis. Equal protein amounts (10 μg) of homogenate were separated by SDS-PAGE, transferred to nitrocellulose, and the nitrocellulose blots were probed with a rabbit polyclonal antibody against SCP-2 that recognizes both SCP-2 and proSCP-2 followed by a secondary alkaline phosphatase-linked goat anti-rabbit IgG polyclonal antibody and subsequent color development. The amount of each protein was quantified by densitometry analysis with the amount of SCP-2 or proSCP-2 present in the cultured L cells after LSCM compared with the amount present in the cells after the 2 h incubation (see above).
Indirect immunofluorescence microscopy
Murine L cells (L arpt−tk−) were seeded onto Laboratory-Tek chambered cover glass slides and cultured as described above. The cells were incubated with Cy5-labeled SCP-2 or Cy5-labeled proSCP-2 as described above. Following the 2 h incubation, the cells were fixed, permeabilized, and labeled with the SelectFX488 peroxisome labeling kit, utilizing peroxisomal membrane protein-70, PMP70, as the peroxisomal marker (Molecular Probes/Invitrogen) according to the manufacturer’s directions with the following modifications. The initial cell washes utilized room-temperature PBS; the cells were fixed for 10 min, and the cells were fixed and permeabilized at 20 °C.
LSCM was performed as described above; the peroxisomal marker probe was excited at 488 nm utilizing the krypton-argon laser described above. Emission of AF488 was measured using a PMT after passing through a 540 nm/30 nm emission filter under manual gain and black level control. The Cy5 probe was excited at 647 nm utilizing the krypton-argon laser described above; emission of Cy5 was measured utilizing a PMT after passing through 680 nm/32 nm emission filter under manual gain and black level control. Image acquisition and analysis were accomplished as described above.
Statistics
Graphical analysis was accomplished using SigmaPlot 2000 for Windows version 6.10 (SPSS, Chicago, IL). Data are expressed as means ± the standard error of the mean (n = 5–7). Statistical analysis was performed by analysis of variance (ANOVA) combined with the Newman-Keuls multiple-comparisons test (GraphPad Prism, San Diego, CA). Values with P < 0.05 were considered statistically significant.
RESULTS
SCP-2 and ProSCP-2 Purity and Concentration
For accurate comparisons of proSCP-2 and SCP-2 secondary structure (determined by circular dichroism), tertiary structure, and ligand binding site properties, it is essential that the respective proteins be highly pure and their concentration accurately determined. However, some assays of protein concentration (especially the Bradford assay) may significantly underestimate the concentration of low-Trp or -Tyr proteins by as much as 2-fold (37). Since proSCP-2 and SCP-2 both contain only a single Trp and no Tyr residues, it was incumbent to establish a method that accurately determined the concentration of both these proteins. Therefore, proSCP-2 and SCP-2 were isolated as described in Experimental Procedures and purity was examined by SDS-PAGE and by MALDI-TOF and ESI mass spectrometry. SDS-PAGE followed by silver staining and mass spectrometry established >99% purity (Figure 2A) and the presence of a single species of proSCP-2 with a molecular mass of 15400.8 g/mol, consistent with that expected from cDNA analysis (Figure 2B). Likewise, SDS-PAGE with silver staining (Figure 2C) and mass spectrometry (Figure 2D) showed a single species of SCP-2 with a molecular mass of 13246.3 g/mol, also consistent with that expected from cDNA analysis.
Figure 2.

Mass spectra and SDS-PAGE analysis of proSCP-2 and SCP-2. Aliquots of proSCP-2 and SCP-2 were examined by mass spectrometry and SDS-PAGE as described in Experimental Procedures. (A) MALDI-TOF mass spectrum of proSCP-2. The inset is a photograph of a silver-stained gel after SDS-PAGE of proSCP-2 (lane 1) and molecular size markers (lane 2). (B) ESI mass spectrum of proSCP-2. (C) MALDI-TOF mass spectrum of SCP-2. The inset is a photograph of a silver-stained gel after SDS-PAGE of SCP-2 (lane 1) and molecular size markers (lane 2). (D) ESI mass spectrum of SCP-2. (E) Relative molar protein content as determined by three independent methods. Values represent the mean ± standard error (n = 6). Three asterisks denote a P < 0.001 compared with amino acid (AA) analysis.
The relative molar protein concentrations of proSCP-2 or SCP-2 were evaluated by three independent methods: amino acid analysis, UV absorbance utilizing the theoretical molar extinction coefficient, and Bradford assay. For comparisons between the methods, the molar proSCP-2 or SCP-2 concentration as determined by amino acid analysis was defined to be 1.0 (Figure 2E). When equimolar amounts of proSCP-2, based on amino acid analysis, were analyzed by UV absorbance (Figure 2E) and by the Bradford protein assay (Figure 2E), protein concentrations were overestimated by 2.8 ± 0.2- and 2.4 ± 0.2-fold, respectively. In contrast, when equimolar amounts of SCP-2, based on amino acid analysis, were analyzed by UV absorbance (Figure 2E) and by the Bradford protein assay (Figure 2E), protein concentrations were overestimated by 1.6 ± 0.1- and 2.6 ± 0.3-fold, respectively. Unless otherwise noted, all protein concentrations used herein were based on amino acid analysis, rather than UV absorbance or the Bradford assay.
Aqueous Exposure of the 50Trp Residue in ProSCP-2 and SCP-2: Absorbance and Emission Spectral Shifts
Amino acid analysis showed that proSCP-2 (amino acids −20 to123) and SCP-2 (amino acids 1 to123) protein each contained 1.0 ± 0.1 Trp/mol protein (n = 6), consistent with the respective cDNA sequences. This Trp was located at position 50 in β-sheet II in both proteins (8, 38, 39). To probe the microenvironment sensed by the Trp, 0.5 μM aliquots of each protein as well as an aqueous solution of the free amino acid Trp were examined by UV absorbance spectroscopy and by fluorescence emission spectroscopy. Representative absorbance spectra showed that the absorbance maximum of Trp in aqueous solution was 279 nm (Figure 3A). In contrast, absorbance maxima of Trp in both proSCP-2 and SCP-2 were red-shifted to 283 nm (Figure 3A), consistent with the single 50Trp residue in proSCP-2 or SCP-2 each residing in a more nonpolar environment than the free Trp amino acid in aqueous solution (40). Finally, the maximal absorbance intensity of proSCP-2 was significantly higher than that of SCP-2 (Figure 3A), suggesting the 50Trp residue in proSCP-2 was located in a different microenvironment than was 50Trp in SCP-2.
Figure 3.

Absorbance and fluorescence emission spectra of proSCP-2, SCP-2, and tryptophan. Spectra were obtained on samples containing 0.5 μM protein or tryptophan in 10 mM potassium phosphate (pH 7.4) as described in Experimental Procedures. (A) Absorbance spectra of proSCP-2 (●), SCP-2 (○), and tryptophan (▼). (B) Fluorescence emission spectra of proSCP-2 (●), SCP-2 (○), and tryptophan (▼); the excitation wavelength was 280 nm. (C–F) Spectra of proSCP-2 and SCP-2 [5 μM protein in 10 mM potassium phosphate (pH 7.4)] in the absence or presence of 10 μM ligand were obtained as described in Experimental Procedures. (C) Absorbance spectra of proSCP-2: (●) buffer only, (○) 10 μM cholesterol, (▼) 10 μM oleic acid, (∇) 10 μM oleoyl-CoA. (D) Fluorescence emission spectra of proSCP-2 with or without ligand; the excitation wavelength was 280 nm. (E) Absorbance spectra of SCP-2 with or without ligand. (F) Fluorescence emission spectra of SCP-2 with or without ligand; the excitation wavelength was 280 nm.
To further probe the 50Trp microenvironment in proSCP-2 and SCP-2, fluorescence emission spectra (excitation at 280 nm) were obtained of each protein as well as an aqueous solution of the free Trp amino acid in aqueous buffer. Free Trp in solution exhibited the highest fluorescence emission intensity and had the longest emission maximum wavelength (356 nm) of the three species examined (Figue 3B), consistent with the highest exposure to the aqueous environment (41). In contrast, Trp in SCP-2 had the lowest fluorescence intensity (and quantum yield) of the three species examined and exhibited an emission maximum near 330 nm, significantly blue-shifted compared to that of free Trp in solution (Figure 3B). The proSCP-2 emission intensity was 1.9-fold higher than that observed for SCP-2, and the fluorescence emission maximum of proSCP-2 was blue-shifted to 339 nm as compared to that of free Trp in solution (Figure 3B). Fluorescence emission results also suggested that, while Trp in both proSCP-2 and SCP-2 was localized in a more nonpolar environment as compared to the aqueous Trp amino acid, the Trp residue in proSCP-2 was in a somewhat more polar environment than that in SCP-2.
Aqueous Exposure of the 50Trp Residue in ProSCP-2 and SCP-2: Quenching by Acrylamide
Quenching of tryptophan fluorescence by the small molecule acrylamide is an effective method of further analyzing the surface and aqueous exposure of Trp in Trp-containing proteins (37, 42). To this end, 50Trp fluorescence emission of proSCP-2 and SCP-2 as well as free Trp in solution was monitored in the presence of increasing concentrations of acrylamide. Monitoring Trp emission at 350 nm (Figue 4A) indicated that the 50Trp in proSCP-2 was significantly more accessible to fluorescence quenching by acrylamide than 50Trp in SCP-2. Upward curvature of the Stern-Volmer plots for proSCP-2 and Trp indicated a dynamic component of the quenching constant, KD, and a static component, KS, while the data for SCP-2 best fit a single quenching component (Figure 4A). Further analysis of the acrylamide quenching data (Figure 4B) yielded a dynamic quenching constant, KD, for 50Trp in proSCP-2 that was 1.8-fold higher (P < 0.001) than that calculated for 50Trp in SCP-2 (Figure 4C). No static quenching component could be resolved for SCP-2; however, both proSCP-2 and free Trp in solution had calculated KS values that were statistically equivalent (Figure 4C).
Figure 4.
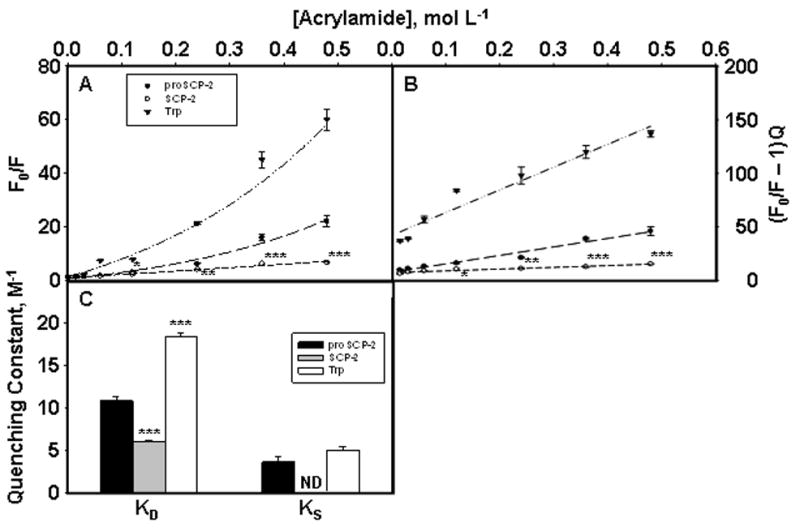
Acrylamide quenching of Trp fluorescence in proSCP-2 (●), SCP-2 (○), and tryptophan (▼). Emission spectra at 350 nm were obtained on samples containing 1 μM protein or tryptophan in 10 mM potassium phosphate (pH 7.4) as described in Experimental Procedures. The values represent means ± the standard error (n = 5). One asterisk indicates a P < 0.05 compared with proSCP-2. Two asterisks indicate a P < 0.01 compared with proSCP-2. Three asterisks indicate a P < 0.001 compared with proSCP-2. F0 is the Trp fluorescence in the absence of acrylamide quencher (Q) and F the Trp fluorescence (with quencher). (C) Dynamic, KD, and static, KS, quenching constants for proSCP-2, SCP-2, or tryptophan. ND means not detectable.
Effect of Lipidic Ligand Binding on Aqueous Exposure of 50Trp in ProSCP-2 and SCP-2: Absorbance and Emission Spectral Shifts
Binding of the ligand cholesterol or oleic acid had little effect on the absorbance maximum wavelengths of either proSCP-2 (Figure 3C) or SCP-2 (Figure 3E). By contrast, binding of oleoyl-CoA to proSCP-2 resulted in a 9 nm blue shift in the maximal absorbance wavelength from 283 nm to 274 nm (Figure 3C). Interaction of oleoyl-CoA with SCP-2 resulted in an even larger 19 nm blue shift in the maximal absorbance wavelength to 265 nm for SCP-2 (Figure 3E) than that observed for the proSCP-2-oleoyl-CoA complex (Figure 3C). With respect to the wavelengths of maximal fluorescence emission, both oleic acid and oleoyl-CoA caused a significant blue shift (5 nm) in the emission maximum of proSCP (Figure 3D). In addition, binding of oleic acid or oleoyl-CoA (but not cholesterol) to proSCP-2 caused a 10–12% increase in fluorescence intensity (Figure 3D). By contrast, none of the ligands examined had any effect on the fluorescence emission maximum wavelength of Trp in SCP-2 (Figure 3F). The only effect of ligand binding to SCP-2 on Trp fluorescence emission was a 12% increase in Trp fluorescence intensity as a result of the binding of oleic acid to SCP-2 (Figure 3F). Taken together, these data indicated that ligands such as oleoyl-CoA and oleic acid, but not cholesterol, significantly decreased the polarity of the microenvironment sensed by 50Trp in proSCP-2, but not in SCP-2.
Interactions of ProSCP-2 and SCP-2 with Photoactivatable Cholesterol
ProSCP-2 and SCP-2 both bind cholesterol with a high similar affinity and 1:1 stoichiometry (reviewed in refs 9 and 12). To further investigate molecular details of this association of cholesterol with proSCP-2 and SCP-2, our laboratory studied the ability of the photoactivatable cholesterol analogue FCBP to associate with and covalently attach to these proteins. At FCBP:protein molar ratios of 2:1 and 10:1, proSCP-2 and SCP-2 bound approximately 1 mole of FCBP per mole of protein (Figure 5A). Comparison of MALDI-TOF mass spectra of proSCP-2, FCBP-proSCP-2, SCP-2, and FCBP-SCP-2 confirmed the presence of a single molecule of FCBP covalently attached to either proSCP-2 or SCP-2 (Figure 5B–E).
Figure 5.

Time-course and mass spectrum analysis of FCBP cross-linking reaction with proSCP-2 or SCP-2. [3H]FCBP was incubated with proSCP-2 or SCP-2, cross-linked, and analyzed for cross-linking as described in Experimental Procedures. (A) Quantification of [3H]FCBP cross-linking: FCBP-proSCP-2 (2:1 molar ratio) (●), FCBP-proSCP-2 (10:1 molar ratio) (○), FCBP-SCP-2 (2:1 molar ratio) (▼), and FCBP-SCP-2 (10:1 molar ratio) (∇). (B) MALDI-TOF mass spectrum of proSCP-2. (C) MALDI-TOF mass spectrum of the FCBP-proSCP-2 complex. (D) MALDI-TOF mass spectrum of SCP-2. (E) MALDI-TOF mass spectrum of the FCBP-SCP-2 complex. (F) Amino acid sequences of human proSCP-2 and human SCP-2. Sequences in bold italics represent isolated peptides that contain covalently attached FCBP.
Mass spectral analysis of tryptic peptides as described in Experimental Procedures showed that FCBP was cross-linked to different regions in proSCP-2 versus SCP-2 (Figure 5F). In proSCP-2, the FCBP cross-linked the ANLVF peptide (Figure 5F), i.e., amino acids 28-32 that straddle parts of the mature SCP-2 N-terminal leader sequence and α-helix-1 (43). In contrast, for SCP-2 the FCBP cross-linked the EATW VVDVK peptide (Figure 5F), i.e., amino acids 47-55 that comprise β-sheet II (43). Thus, FCBP bound to both proSCP-2 and SCP-2 within the lipid binding domains of the respective proteins (44). However, despite the fact that FCBP did not cross-link to the N-terminal 20-amino acid presequence of proSCP-2, the presence of this presequence dramatically shifted the peptide region to which FCBP cross-linked within the lipid binding domain.
Synthesis of N-terminal Peptides
The structure of the N-terminal 20-amino acid presequence (−20-+1proSCP-2) in unliganded proSCP-2 as well as that of the nine-amino acid leader sequence of unliganded SCP-2 (+1-+9SCP-2) could not be resolved by NMR or X-ray crystallography and, on the basis of these techniques, it has been suggested that these structures are flexibly disordered and unstructured (reviewed in refs 12, 38, 39, and 44). However, on the basis of secondary structure modeling of the 20-amino acid presequence (Figure 1), it has been suggested that the presequence contains a small α-helical element from amino acid −17 to −15 and a β-sheet from amino acid −8 to −3 (45). To begin to address this possibility and obtain molecular details of the structure of these polypeptide sequences, a series of proSCP-2 and SCP-2 N-terminal peptides was synthesized for secondary structure analysis by circular dichroism:
First, peptide −20-+1proSCP-2 corresponding to the amino acids −20 to 1 of the N-terminus of proSCP-2, comprised the entire N-terminal presequence that is posttranslationally cleaved to yield SCP-2 and the 20-amino acid polypeptide (Figure 1). The −20-+1proSCP-2 peptide contained a number of polar amino acid residues, including two acidic, three basic, and four hydroxy amino acids (the remaining amino acids being hydrophobic), resulting in a net charge of +1.
Second, peptide −20-+9proSCP-2 corresponded to residues −20 to 1 of the N-terminus of proSCP-2 and the N-terminal amino acid 1-9 leader sequence of the mature SCP-2 (Figure 1). The −20-+9proSCP-2 peptide contained more polar amino acid residues, including three acidic, five basic, and six hydroxy amino acids (the remaining amino acids being hydrophobic), resulting in a net charge of +2.
Third, peptide −20-+24proSCP-2 corresponded to residues −20 to 1 of the N-terminus of proSCP-2, the N-terminal amino acid 1-9 leader sequence of the mature SCP-2, and amino acids 10-24 comprising α-helix-1 (Figure 1). The −20-+24proSCP-2 peptide contained the most polar amino acid residues, including eight acidic, eight basic, and six hydroxy amino acids (the remaining amino acids being hydrophobic), resulting in a net charge of 0.
Fourth, peptide +1-+24SCP-2 corresponded to residues 1-9 of the N-terminal amino acid leader sequence and residues 10-24 comprising α-helix-1 of the mature SCP-2 (Figure 1). The +1-+24SCP-2 peptide contained 13 polar amino acid residues, including six acidic, five basic, and two hydroxy amino acids (the rest being hydrophobic), resulting in a net charge of −1.
Secondary Structure Analysis of N-terminal Peptides in Aqueous Buffer
The four N-terminal peptides described above were examined by circular dichroism (CD) either in aqueous buffer alone (Figure 6A) or aqueous buffer containing 50% TFE (Figure 6B). The latter mixture with TFE favors secondary structure in peptides and proteins by promoting intramolecular hydrogen bonding similar to that exhibited by the polypeptide microenvironment of proteins in aqueous solution (17). Spectra of peptides in aqueous buffers, especially in the 50% TFE aqueous buffer, were characteristic of varying amounts of α-helical structure (29). Quantitative analysis of these CD spectra as described in Experimental Procdures resolved the relative proportions of secondary structure elements of each of the peptides (Figure 6C). Although −20-+1proSCP-2 and −20-+9proSCP-2 in buffer contained negligible levels of α-helical content, peptides −20-+24proSCP-2 and +1-+24SCP-2 contained 11–16% α-helix (Figure 6C), consistent with the fact that both peptides encompass α-helix-1 at their C-termini (Figure 1).
Figure 6.

Circular dichroism spectra of proSCP-2 and SCP-2 N-terminal peptides in aqueous buffer and 50% TFE. Circular dichroism spectra were obtained as described in Experimental Procedures: (A) 15 μM peptide in 10 mM potassium phosphate buffer (pH 7.4) [(●) peptide 1–20Pro, (○) peptide 1–29Pro, (▼) peptide 1–44Pro, and (∇) peptide 1–24SCP-2] and (B) 15 μM peptide in trifluoroethanol/buffer mixture (1:1, v:v). (C) Effect of solvent on α-helix formation by proSCP-2 and SCP-2 N-terminal peptides. Values represent means ± the standard error (n = 5). Three asterisks indicate a P < 0.001 compared with buffer only.
Since aqueous buffers do not favor α-helix formation, secondary structure elements of each of the peptides were also examined in 50% TFE aqueous buffer (Figure 6C). All peptides exhibited 5–8-fold more α-helical structure in 50% TFE buffer than in buffer alone (Figure 6C): −20-+1proSCP-2 had 18% α-helical content and 10% β-sheet content, roughly consistent with the predictions based on secondary structure modeling (45). Peptide −20-+9proSCP-2 [contains the entire N-terminal presequence and the nine-amino acid leader sequence of mature SCP-2 (Figure 1)], also had 18% α-helical content, not significantly different from that of −20-+1proSCP-2 and suggesting that the leader sequence did not contain additional α-helical structure. Peptide −20-+24proSCP-2 [contains the entire N-terminal presequence and the nine-amino acid leader sequence and α-helix-1 of mature SCP-2 (Figue 1)] exhibited 51% α-helix. Peptide +1-+24SCP-2 [containing the nine-amino acid leader sequence and α-helix-1 of mature SCP-2 (Figure 1)] had 72% α-helix. Taken together, these data were consistent with the N-terminal presequence not significantly altering the proportion of α-helix-1 in the mature SCP-2 portion of the protein; however, CD demonstrated that a significant portion of the N-terminal presequence exhibited organized secondary structure such as α-helix.
Secondary Structure Analysis of N-terminal Peptides Interacting with Membranes in Aqueous Buffer
The amphipathic α-helical region present in the N-terminal region of mature SCP-2 forms part of the ligand binding site (reviewed in refs 12, 38, 39, and 44) but also represents the membrane interaction domain and is necessary for functional activity (17). Thus, it was important to determine if the presence of the 20-amino acid N-terminal presequence in proSCP-2 altered the interaction of the N-terminal domain with membranes. Therefore, the interaction of the four N-terminal peptides with model membranes (small unilamellar vesicles, i.e., SUVs) of differing ionic and/or cholesterol content was examined by CD.
The secondary structures of −20-+1proSCP-2, −20-+9proSCP-2, and +1-+24SCP-2 were significantly altered by interaction with membranes, depending on the SUV lipid composition (Figure 7). Of the peptides examined, the largest change was noted for −20-+1proSCP-2 whose α-helical content decreased >3-fold in the presence of neutral charged membranes, but increased 3.5-fold upon binding membranes with the highest content of anionic phospholipid [35:35:30 (Figure 7A,B)]. As compared to the peptide in buffer only, binding to anionic phospholipid-rich membranes (35:35:30 SUVs) increased the α-helical content of −20-+1proSCP-2 and +1-+24SCP-2 to the highest degree, 3.5- and 1.9-fold, respectively (Figure 7B,H). By contrast, the secondary structure of the longest peptide −20-+24proSCP-2, which encompassed the N-terminal presequence as well as the first 24 amino acids of the mature SCP-2, was not affected by membrane interaction (Figure 7E,F). Thus, CD studies of peptides suggested that the presence of the 20-amino acid N-terminal presequence slightly altered the secondary structure of the two domains (leader sequence and downstream region, including α-helix-1) of the protein interacting with anionic phospholipid-rich membranes.
Figure 7.

Effect of SUV lipid composition on the α-helical content of proSCP-2 and SCP-2 N-terminal peptides upon membrane interaction. Circular dichroism spectra were obtained as described in Experimental Procedures: (A and B) peptide 1–20Pro, (C and D) peptide 1–29Pro, (E and F) peptide 1–44Pro, (G and H) peptide 1–24SCP-2. Symbols refer to the peptide (15 μM) spectra obtained in the presence of (●) 10 mM potassium phosphate (pH 7.4), (○) 1 mM SUV1 (65:35:0 POPC/cholesterol/DOPS), (▼) 1 mM SUV2 (55:35:10 POPC/cholesterol/DOPS), (∇) 1 mM SUV3 (40:50:10 POPC/cholesterol/DOPS), and (■) 1 mM SUV4 (35:35:30 POPC/cholesterol/DOPS). The values represent means ± the standard error (n = 5). Two asterisks indicate a P < 0.01 compared with peptide in buffer only and three asterisks indicate a P < 0.001 compared with peptide in buffer only.
Finally, to determine if these changes in N-terminal peptide secondary structure upon interaction with membranes were also reflected in the complete proteins, the α-helical content of proSCP-2 and SCP-2 proteins were examined in the absence or presence of SUVs differing in charge and cholesterol content. CD spectra were consistent with both proSCP-2 (Figure 8A) and SCP-2 (Figure 8B) exhibiting substantial α-helical content. SCP-2 in buffer contained 25% more α-helical structure than did proSCP-2 (Figure 8C), a difference that was increased to 46% in the presence of cholesterol-rich membranes SUVs (40:50:10) (Figure 8C). Binding to anionic phospholipid-rich membranes (35:35:30 SUVs) increased the α-helical content of both proSCP-2 and SCP-2 to the highest degree (Figure 8C). However, this high degree of interaction abolished the statistical difference in α-helical content between proSCP-2 and SCP-2 observed in buffer only and all other membranes examined, especially that in cholesterol-rich membranes (Figure 8C). The presence of the 20-amino acid N-terminal presequence did not interfere but rather appeared to facilitate interaction with anionic phospholipid-rich membranes as determined by an increased level of secondary structure.
Figure 8.

Effect of SUV lipid composition on circular dichroism spectra and α-helical content of proSCP-2 and SCP-2. Circular dichroism spectra of 4 μM proSCP-2 or SCP-2 were recorded in 10 mM potassium phosphate (pH 7.4) or 1 mM SUV as described in Experimental Procedures. (A) Symbols represent proSCP-2 CD spectra recorded in the presence of (●) buffer only, (○) SUV1 (65:35:0 POPC/cholesterol/DOPS), (▼) SUV2 (55:35:10 POPC/cholesterol/DOPS), (∇) SUV3 (40:50:10 POPC/cholesterol/DOPS), and (■) SUV4 (35:35:30 POPC/cholesterol/DOPS). (B) Symbols represent SCP-2 CD spectra recorded in the presence of (●) buffer only, (○) SUV1, (▼) SUV2, (∇) SUV3, and (■) SUV4. (C) α-Helical content of proSCP-2 (black bars) and SCP-2 (gray bars) in the presence of (1) buffer only, (2) SUV1, (3) SUV2, (4) SUV3, and (5) SUV4. The values represent means ± the standard error (n = 5). One asterisk indicates a P < 0.05 compared with proSCP-2, and two asterisks indicate a P < 0.01 compared with proSCP-2.
Effect of the N-terminal Presequence on Association of SCP-2 with the Peroxisomal PTS-1 Import Protein Peroxin 5p(C)
Both proSCP-2 and SCP-2 contain a canonical C-terminal peroxisomal targeting sequence 1 (PTS-1), a sequence known to be important for association of PTS-1-containing proteins with the peroxisomal import receptor peroxin 5p, Pex5p, and subsequent targeting to peroxisomes (38, 39, 44). Therefore, CD spectra were obtained to determine if (i) interaction of SCP-2 with Pex5p(C) altered secondary structure and (ii) the N-terminal presequence in proSCP-2 influenced the change in secondary structure. Examination of CD spectra of the three proteins in aqueous buffer suggested that Pex5p(C) contained the highest α-helical content (Figure 9A). This was supported by quantitative analysis, which showed that Pex5p(C) had 78 ± 2% α-helical structure while proSCP-2 and SCP-2 had only 11.8 ± 0.2% (6.6-fold less) and 15 ± 1% (4.5-fold less) α-helical structure, respectively [Figure 9B, H(r)]. When the total helical structure of all types [H(r) + H(d)] was considered, Pex5p(C), proSCP-2, and SCP-2 had 88.8 ± 0.3, 22.5 ± 0.3, and 29 ± 2% total helix structure, respectively (Figure 9C).
Figure 9.

Circular dichroism spectra and secondary structure analysis of proSCP-2, SCP-2, Pex5(C), and the proSCP-2-Pex5(C) complex. Circular dichroism spectra were recorded on individual protein samples containing 4 μM protein in 10 mM potassium phosphate (pH 7.4) as described in Experimental Procedures. (A) Circular dichroism (CD) spectra of proSCP-2 (●), SCP-2 (○), or Pex5(C) (▼). (B and C) SELCON 3 secondary structure analysis of CD data in panel A. H(r) is regular α-helix, H(d) distorted α-helix, S(r) regular β-strand, S(d) distorted β-strand, Unrd unordered, Helix total α-helix, and β-strand total β-strand content. The values represent means ± the standard error (n = 5). One asterisk indicates a P < 0.05 compared with proSCP-2, and two asterisks indicate a P < 0.01 compared with proSCP-2. (D–F) Circular dichroism spectra were recorded for samples containing 2 μM proSCP-2 with or without 2 μM Pex5p(C) in 10 mM potassium phosphate (pH 7.4) as described in Experimental Procedures. (D) Circular dichroism spectra of proSCP-2 and Pex5p(C) added mathematically as described in Experimental Procedures (●) and CD spectra of the proSCP-2-Pex5(C) complex (○). (E and F) SELCON 3 secondary structure analysis of CD data in panel D. The values represent means ± the standard error (n = 5). One asterisk indicates a P < 0.05 compared with “Individual Spectra Added”, and two asterisks indicate a P < 0.01 compared with “Individual Spectra Added”.
A representative experimental CD spectrum of the proSCP-2-Pex5p(C) complex differed from that calculated by mathematically adding and normalizing the individual spectra (Figure 9D). The complex formed by the association of proSCP-2 with Pex5p(C) contained 10% more helix and 3.8-fold more β-strand content than that calculated by mathematically adding the individual spectra of the two proteins (Figure 9E,F). Representative experimental CD spectra of SCP-2 interacting with Pex5p(C) also differed significantly from spectra calculated by mathematically adding the individual spectra of the two proteins (Figure 10A). Quantitative analysis of multiple spectra indicated that secondary structure of the SCP-2-Pex5p(C) complex contained 18% more helix and 7.5-fold more β-strand than that calculated from the individual protein spectra (Figure 10B,C). Taken together, these data suggest that the presence of the N-terminal presequence in proSCP-2 elicited less change in secondary structure in the complex with Pex5p(C) than in that of SCP-2 in the complex with Pex5p(C).
Figure 10.

Circular dichroism spectra and secondary structure analysis of the SCP-2-Pex5p(C) complex. Circular dichroism spectra were recorded for samples containing 2 μM SCP-2 with or without 2 μM Pex5p(C) in 10 mM potassium phosphate (pH 7.4) as described in Experimental Procedures. (A) Circular dichroism spectra of SCP-2 and Pex5p(C) added mathematically as described in Experimental Procedures (●) and CD spectra of the SCP-2-Pex5p(C) complex (○). (B and C) SELCON 3 secondary structure analysis of CD data in panel A. H(r) is regular α-helix, H(d) distorted α-helix, S(r) regular β-strand, S(d) distorted β-strand, Unrd unordered, Helix total α-helix, and β-strand total β-strand content. The values represent means ± the standard error (n = 5). Two asterisks indicate a P < 0.01 compared with “Individual Spectra Added” and three asterisks a P < 0.001 compared with “Individual Spectra Added”.
Fluorescence Resonance Energy Transfer (FRET) between Pex5p(C) and SCP-2 or Cy5-ProSCP-2
To further probe whether the differences in secondary structure between the SCP-2-Pex5p(C) and proSCP-2-Pex5p(C) complexes reflected differences in the respective binding affinities between these proteins, a fluorescence resonance energy transfer (FRET) binding assay (see Experimental Procedures) was used to determine (i) the binding affinity of Pex5p(C) for SCP-2 and proSCP-2 and (ii) the relative Cy3-Cy5 distance between Pex5p(C) and SCP-2 or proSCP-2 in the respective complexes. Interaction of Pex5p(C) with proSCP-2 displayed saturation binding (Figure 11A), at a single binding site (Figure 11A, inset), and a very high affinity [Kd = 2.8 ± 0.9 nM (Figure 11C)]. By contrast, while interaction of Pex5p(C) with SCP-2 also exhibited saturation binding (Figure 11B) at a single site (Figure 11B, inset), the affinity was 10-fold lower (P < 0.001) than for proSCP-2 (Figure 11C). While the relative Cy3-Cy5 distance between Pex5p(C) and proSCP-2 or Pex5p(C) and SCP-2 (calculated from the FRET curves as described in Experimental Procedures) indicated close molecular interactions, the Cy3-Cy5 distances differed significantly, 74 ± 2 Å for the Pex5p(C)-proSCP-2 complex and 66.8 ± 0.5 Å for the Pex5p(C)-SCP-2 complex [P < 0.01 (Figure 11C)], 10% greater for the former, likely reflecting the 2 kDa larger size of proSCP-2 vs SCP-2.
Figure 11.

Fluorescence Resonance Energy Transfer (FRET) from donor Cy3-labeled Pex5p(C) protein to acceptor Cy5-labeled SCP-2 or proSCP-2 protein. Cy3-labeled Pex5p(C) protein was titrated with increasing concentrations (from 0 to 400nM) of Cy5-labeled proSCP-2 (A) or Cy5-labeled SCP-2 (B), resulting in quenching of Cy3 fluorescence and an increase in Cy5 fluorescence upon energy transfer. Data are presented as ligand binding curves of the average change in Cy3 maximal fluorescence emission (F0 − F) at 570 nm upon excitation at 550 nm as a function of Cy5-labeled protein concentration. The insets are linear representations of binding curve data. The values represent means ± the standard error (n = 3–4). (C) Equilibrium dissociation constant, Kd, for Pex5p(C) and proSCP-2 or SCP-2 (left axis) and relative Cy3-Cy5 distance, R, between Pex5p(C) and proSCP-2 or SCP-2 (right axis). Values represent means ± the standard error (n =5). Two asterisks indicate a P < 0.01 for proSCP-2 vs SCP-2 and three asterisks indicate a P < 0.001 for proSCP-2 vs SCP-2.
Intracellular Targeting of SCP-2 and ProSCP-2 in L cell Fibroblasts
Although both SCP-2 and proSCP-2 contain the same C-terminal AKL peroxisomal targeting sequence-1 (PTS-1), the differences in SCP-2 versus proSCP-2 affinities and intermolecular distances with Pex5p(C) described above suggest that this might result in differential targeting of these proteins to peroxisomes versus mitochondria or other intracellular membranes such as the plasma membrane. To test if the N-terminal 20-amino acid presequence found in proSCP-2 altered the intracellular targeting, Cy5-labeled proSCP-2 or Cy5-labeled SCP-2 was incorporated into L cell fibroblasts as described in Experimental Procedures, followed by labeling with fluorescently tagged cellular markers for the plasma membrane [cholera toxin B (CTB)], mitochondria (Mitotracker Green), and peroxisomes [peroxisomal membrane protein 70 (PMP70)], and colocalization by laser scanning confocal microscopy (LSCM) also as described in Experimental Procedures. Cy5 labeling was chosen because (i) Cy5 labeling of proSCP-2 results in attachment of Cy5 to the 13 kDa SCP-2 part (not the 20-amino acid presequence), (ii) Cy5 labeling does not interfere with normal posttranslational cleavage of the presequence from Cy5-proSCP-2 (iii) Cy5 labeling results in covalent attachment of Cy5 to the mature SCP-2 part of the protein and therefore LSCM images of Cy5-proSCP-2 or Cy5-SCP-2 incorporated into cells reflect the distribution of Cy5-SCP-2 (31).
LSCM showed that Cy5-label was distributed throughout L-cells containing Cy5-SCP-2 (Figure 12A, green) or Cy5-proSCP-2 (Figure 12E, green). In contrast, CTB appeared distributed primarily at and near the plasma membrane (Figure 12B,F, red). Superposition of the respective CTB-labeled (red) and Cy5-labeled (green) protein images revealed the presence of some colocalization of green and red (Figure 12C,G). Selection of only the colocalized pixels (designated as yellow) showed that colocalization was primarily near the plasma membrane (Figure 12D,H, yellow). However, quantitative analysis of multiple cells indicated important differences: 18 ± 2% of Cy5-SCP-2 colocalized with the plasma membrane marker, while less than 4% (P < 0.001) of the Cy5-labeled proSCP-2 was found to colocalize with CTB (Figure 13).
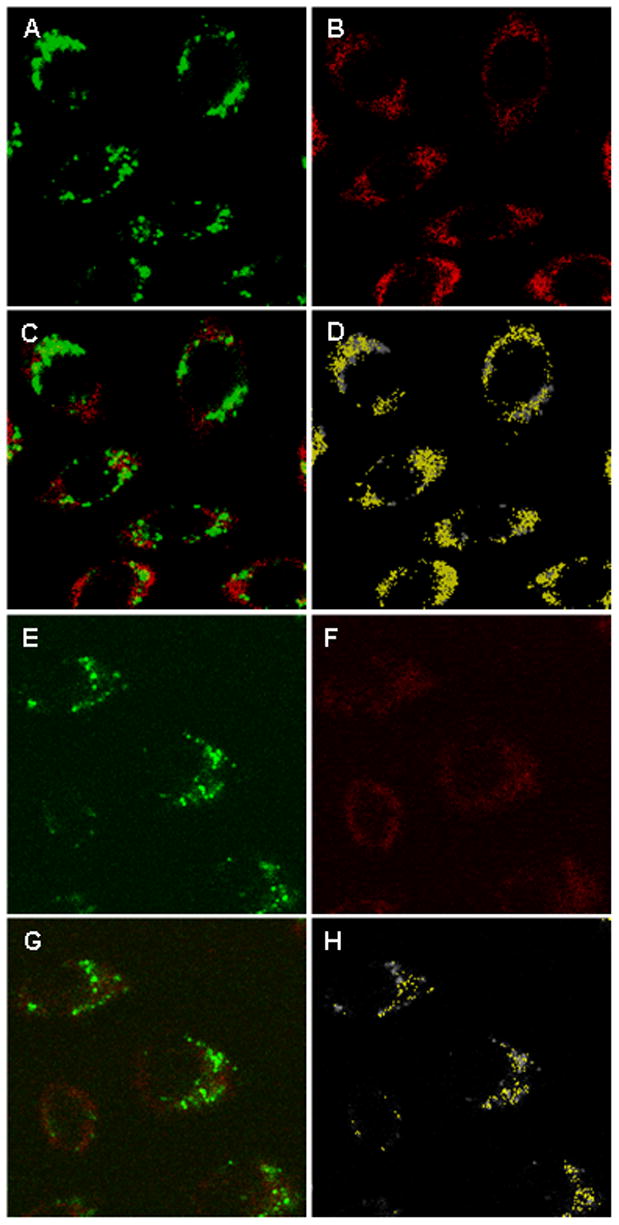
Figure 12.

Colocalization of Cy5-SCP-2 and Cy5-proSCP-2 with a plasma membrane marker in L cells. L cells were incubated in the presence of Cy5-SCP-2 (A–D) or Cy5-proSCP-2 (E–H) and the plasma membrane marker, AlexaFluor 488-cholera toxin B (AF488-CTB), and examined by laser scanning confocal microscopy (LSCM) as described in Experimental Procedures. (A) LSCM of Cy5-SCP-2 (green pixels) in L cells. (B) LSCM of AF488-CTB (red pixels) in L cells. (C) Merged images of Cy5-SCP-2 and AF488-CTB. (D) Colocalized Cy5-SCP-2 and AF488-CTB (yellow pixels) in L cells. (E) LSCM of Cy5-proSCP-2 (green). (F) LSCM of AF488-CTB (red). (G) Merged images of Cy5-proSCP-2 and AF488-CTB. (H) Colocalized Cy5-proSCP-2 and AF488-CTB (yellow).
Figure 13.
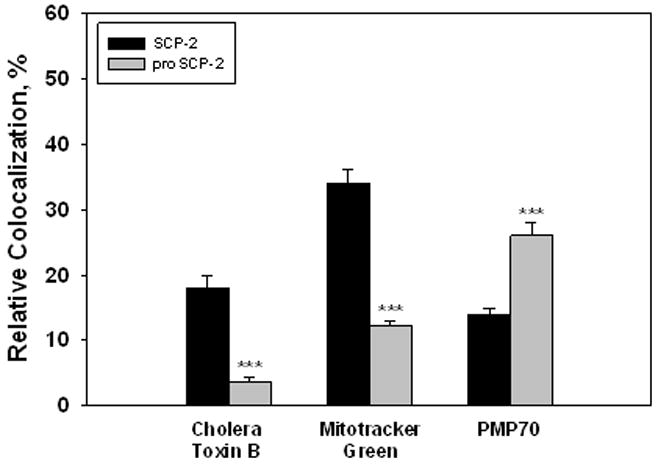
Relative colocalization of Cy5-SCP-2 or -proSCP-2 with cellular markers in L cells. L cells were incubated in the presence of Cy5-SCP-2 or Cy5-proSCP-2 and CTB, Mitotracker Green, or PMP70 as described in Experimental Procedures. Pixel colocalization was quantified as described in Experimental Procedures. The values represent means ± the standard error (n = 5–7). Three asterisks indicate a P < 0.001 compared with SCP-2.
A similar pattern of preferential colocalization of proSCP-2 was shown when the mitochondrial marker, Mitotracker Green, was used. LSCM showed that Cy5-SCP-2 (Figure 14A, green) and Cy5-proSCP-2 (Figure 14E, green) were distributed throughout the interior of L-cells. Likwise, Mitotracker Green was also distributed throughout the L-cell interior (Figure 14B,F, red). Superposition of the respective Mitotracker Green-labeled (red) and Cy5-labeled (green) protein images showed more substantial colocalization (Figure 14C,G). Selection of only the colocalized pixels showed that colocalization was primarily in the cell interior (Figure 14D,H). Significantly more Cy5-SCP-2 and Cy5-proSCP-2 colocalized with Mitotracker Green than with CTB (Figure 13). Furthermore, 2.8-fold more (P < 0.001) Cy5-SCP-2 than Cy5-proSCP-2 was shown to colocalize with the mitochondrial marker (Figure 13).
Figure 14.
Colocalization of Cy5-SCP-2 and Cy5-proSCP-2 with a mitochondrial marker in L cells. L cells were incubated in the presence of Cy5-SCP-2 (A-D) or Cy5-proSCP-2 (E-H) and Mitotracker Green and examined by LSCM as described in Experimental Procedures. (A) LSCM of Cy5-SCP-2 (green). (B) LSCM of Mitotracker Green (red). (C) Merged images of Cy5-SCP-2 and Mitotracker Green. (D) colocalized Cy5-SCP-2 and Mitotracker Green (yellow). (E) LSCM of Cy5-proSCP-2 (green). (F) LSCM of Mitotracker Green (red). (G) Merged images of Cy5-proSCP-2 and Mitotracker Green. (H) Colocalized Cy5-proSCP-2 and Mitotracker Green (yellow).
Finally, the pattern of colocalization of proSCP-2 versus SCP-2 with the peroxisomal marker (PMP70) was the opposite of that shown for the plasma membrane and mitochondrial markers. PMP70 (red) was distributed in a punctate pattern throughout the interior of L-cells containing Cy5-SCP-2 (Figure 15B) or Cy5-proSCP-2 (Figure 15F). Again, Cy5-SCP-2 (Figure 15A, green) and Cy5-proSCP-2 (Figure 15E, green) appeared to be distributed throughout the cell. Superposition of the respective PMP70-labeled (red) and Cy5-labeled (green) protein images showed significant colocalization (Figure 15C,G). Selection of only the colocalized pixels showed that colocalization was primarily in the cell interior (Figure 14D,H) where 1.8-fold more (P < 0.001) Cy5-proSCP-2 colocalized with the peroxisomal marker, PMP70: 26 ± 2% of the Cy5-proSCP-2 colocalized with PMP70, and only 14 ± 1% of the Cy5-SCP-2 colocalized with PMP70 (Figure 13).
Figure 15.

Colocalization of Cy5-SCP-2 and Cy5-proSCP-2 with a peroxisomal marker in L cells. L cells were incubated in the presence of Cy5-SCP-2 or Cy5-proSCP-2, fixed, permeabilized, incubated with rabbit anti-peroxisomal membrane protein 70 followed by AF488-conjugated goat anti-rabbit IgG, and examined by LSCM as described in Experimental Procedures. (A) LSCM of Cy5-SCP-2 (green). (B) Anti-PMP70 antibody detected with AF488-conjugated secondary antibody (red). (C) Merged images of Cy5-SCP-2 and PMP70. (D) Colocalized Cy5-SCP-2 and PMP70 (yellow). (E) LSCM of Cy5-proSCP-2 (green). (F) Anti-PMP70 antibody detected with AF488-conjugated secondary antibody (red). (G) Merged images of Cy5-proSCP-2 and PMP70. (H) Colocalized Cy5-proSCP-2 and PMP70 (yellow).
Thus, SCP-2 was not exclusively associated with peroxisomes but was also significantly associated with other membrane organelles (mitochondria and plasma membrane) such that 66% of total SCP-2 colocalized with these three membranes. However, the presence of the N-terminal presequence (i) significantly increased the proportion of total SCP-2 not associated with these membranes such that the proportion diffusely distributed in the cytosol increased from 34 to 58% and (ii) influenced the relative intracellular distribution of SCP-2 between these membranes in cultured L-cell fibroblasts. In the absence of the N-terminal presequence, SCP-2 was targeted to these membrane organelles in the order mitochondria > peroxisomes, plasma membrane. In contrast, the presence of the N-terminal presequence significantly altered the targeting of SCP-2 to these membrane organelles such that SCP-2 was localized in greatest amount in the order peroxisomes > mitochondria > plasma membrane.
Quantification of the amount of intact SCP-2 or proSCP-2 remaining after incorporation into cultured L cells, incubation, and LSCM revealed > 90% of the initial SCP-2 was remaining after 2 h (data not shown). Although a significant amount of proSCP-2 was remaining after 2 h, ~75% of the initial proSCP-2 was found as 13-kDa SCP-2 and ~25% of proSCP-2 was shown to be intact 15-kDa proSCP-2 (not shown). Although the biological significance of these findings is not well understood at this point, it is interesting to note that the amount of proSCP-2 that colocalized with the peroxisomal marker, PMP70 (26%), coincides with the amount of intact proSCP-2 remaining at the conclusion of the experiment (25%). Finally, significantly more total SCP-2 (66%) colocalized with the plasma membrane, mitochondrial, and peroxisomal marker proteins than did proSCP-2 (42%).
DISCUSSION
The SCP-2/SCP-x gene has alternate transcription sites encoding two precursor proteins (i.e., 15 kDa proSCP-2 and 58 kDa SCP-x), both of which undergo either complete (proSCP-2) or partial (SCP-x) posttranslational cleavage to yield the mature 13 kDa SCP-2 (reviewed in ref 9). While the presequence in SCP-x is established as the only known peroxisomal 3-ketoacyl-CoA thiolase enzyme with activity for branched-chain acyl-CoAs, almost nothing is known about either the structure or function of the 20-amino acid presequence present in proSCP-2 (reviewed in ref 9). Although the rapid segmental mobility of the 20-amino acid N-terminal presequence on the NMR and X-ray time scale has led to the interpretation that these regions are unstructured, this does not necessarily exclude the presence of secondary structure elements within these mobile segments. On the contrary, Chou-Fasman modeling of the 20-amino acid N-terminal presequence suggests the presence of both α-helix and β-sheet structures therein (45). Likewise secondary structure prediction based on the program PHDsec suggests the presence of an α-helix in the presequence (46). The studies presented herein were designed to further examine this possibility and provide additional structural and functional insights into the role of the N-terminal 20-amino acid sequence present in proSCP-2.
First, incorporation of proSCP-2 into cultured L cells followed by LSCM indicated a significant amount of intact 15 kDa proSCP-2 remained within L cells during the time frame of these studies. Biochemical analysis revealed that the amount of intact proSCP-2 present in L cells after 2 h (25%) was in good agreement with the amount of proSCP-2 that colocalized with the peroxisomal marker (26%). With regard to the significance of the colocalization and biochemical studies, proSCP-2 is known to be proteolytically cleaved to SCP-2 and a 20-amino acid N-terminal peptide (reviewed in ref 9). Since the Cy5 label in Cy5-proSCP-2 is not located within the 20-amino acid N-terminal presequence, Cy5-proSCP-2 is cleaved to Cy5-SCP-2. Consequently, the imaging data reflect the distribution of both the 25% intact Cy5-proSCP-2 remaining and the 75% cleaved to Cy5-SCP-2. This (25% intact)/(75% cleaved) distribution determined by biochemical analysis correlates with the (26% of Cy5-proSCP-2 colocalizing with peroxisomal marker PMP70)/(74% of Cy5-proSCP-2 derived signal in other intracellular compartments) distribution determined by confocal imaging. Since the distribution in cells incubated only with Cy5-SCP-2 is markedly different, i.e., very little colocalization with PMP70, this suggests that the intact Cy5-proSCP-2 targeted more to peroxisomes than Cy5-SCP-2. Taken together with the direct binding (FRET and CD) studies in vitro, these imaging studies are consistent with a potential role of the presequence in proSCP-2 for preferential targeting to peroxisomes. While the functional and physiological significance of the 20-amino acid N-terminal presequence in proSCP-2 is not addressed in this paper, the functional and physiological significance has been demonstrated in previous findings by our laboratory and others (reviewed in ref 9).
Second, it was shown that the 20-amino acid presequence is not unstructured but itself exhibits significant secondary structure, especially in buffers favoring normal polypeptide folding or in the presence of anionic phospholipid rich membranes. These data were roughly consistent with the predictions based on molecular modeling of the 20-amino acid N-terminal presequence (45). The finding that the presence of the presequence does not inhibit but rather facilitates interaction with anionic phospholipid-rich model membranes suggests that a larger conformational change upon lipid binding might influence ligand transfer ability. Indeed, some studies show that the presence of the 20-amino acid N-terminal presequence significantly reduced the ability of SCP-2 to transfer cholesterol (8) or bind nonfluorescent fatty acids and fatty acyl CoAs (47).
Third, spectroscopic (circular dichroism, absorbance, fluorescence, and fluorescence quenching) studies showed that the presence of the 20-amino acid N-terminal presequence significantly altered the secondary structure of SCP-2. This possibility was supported by the following findings. (i) CD of a series of peptides comprising the 20-amino acid N-terminal presequence and including either the nine-amino acid leader sequence or both the leader sequence and the downstream domain, including α-helix-1 of mature SCP-2, showed that the presequence slightly altered (i.e., increased α-helicity) the secondary structure of the polypeptide (amino acids 1-24) immediately downstream in mature SCP-2. (ii) Absorbance maxima, absorbance and emission maximal wavelength shifts, and increased acrylamide accessibility induced by the 20-amino acid N-terminal presequence indicated that 50Trp in proSCP-2 was located in a different electronic microenvironment and/or was more solvent-exposed in proSCP-2 than was 50Trp in SCP-2.
Fourth, ligand binding and cross-linking studies showed that the 20-amino acid N-terminal presequence significantly altered the properties of the SCP-2 binding site, especially in the region comprised of β-sheet II and α-helix 1. For example, the presence of the presequence significantly modified the microenvironment structure of 50Trp resulting not only in greater aqueous exposure but also altered the response to ligands. These findings were consistent with the fact that 50Trp is located in the middle of β-sheet II (Figure 1), a region that comprises part of one face of the ligand binding site (14, 44). Interestingly, the altered ligand binding site was also detected by photo-cross-linking of another ligand, FCBP, which contains a photoactivatable group present in the alkyl side chain of cholesterol. While both cross-linked peptides were within the lipid binding domain of the respective proteins, the 20-amino acid N-terminal presequence dramatically shifted the peptide region to which FCBP cross-linked within the lipid binding domain. Since 50Trp is located in β-sheet II, immediately adjacent to α-helix-1 in the tertiary structure of both proSCP-2 and SCP-2, this suggested that the bound FCBP penetrated deeper into the binding site or was differently oriented in the ligand binding site to interact with α-helix-1 rather than β-sheet II. While there is a considerable literature regarding the nature of the ligand binding pocket and specificity for SCP-2, relatively little is known about that in proSCP-2 (reviewed in refs 9 and 48). An NMR study reported that the aqueous solubility of proSCP-2 is 5-fold lower than that of SCP-2 (46), and both NMR and X-ray crystallography studies indicated that ligand binding elicited microheterogeneity in proSCP-2 such that the structures of holo-proSCP-2 were readily resolvable (reviewed in refs 12–14, 38, 39, 44, and 46). While NMR and X-ray studies have yielded limited insights regarding the structure of liganded proSCP-2 and its ligand binding domain, fluorescence binding assays (49) and tritration microcalorimetry (44) binding assays indicate that proSCP-2 differs up to 4-fold from SCP-2 in binding affinities and 2-fold in binding site number for some ligands (47, 49). In addition, some (47), but not all (38, 44), studies indicate proSCP-2 has a significantly lower affinity for fatty acyl-CoAs. Thus, differences in solubility, ligand binding affinities (fluorescence, microcalorimetry), and ligand effects on secondary structure (CD) were consistent with the 20-amino acid N-terminal presequence eliciting subtle changes in the structure and function of the SCP-2 ligand binding domain.
Fifth, the presence of the 20-amino acid N-terminal presequence markedly increased the affinity of proSCP-2 for Pex5p(C). Pex5p(C) is the soluble protein that interacts with proteins containing a C-terminal PTS-1 and this protein complex then binds to a peroxisomal membrane receptor followed by internalization of the cargo protein into the peroxisomal matrix mediated by additional peroxisomal proteins (45). The FRET binding assay showed that, although Pex5p(C) had a high affinity for both SCP-2 and proSCP-2, the affinity for proSCP-2 was significantly higher than for SCP-2. High affinity binding for both proSCP-2 and SCP-2 was also observed by titration microcalorimetry, but due to large standard deviations, the trend to higher affinity noted for proSCP-2 did not achieve statistical significance (38). Interestingly, in contrast to these studies with purified proteins, GST-Pex5p pull-down assays showed that only the native SCP-2 but not the proSCP-2 was pulled down from cell lysates, suggesting either (i) modulation of the C-terminal PTS-1 site by the N-terminal 20-amino acid presequence, a possibility supported by earlier studies showing that the presequence increased the aqueous accessibility of the C-terminal AKL to proteases and antibodies, or (ii) mediation by a cytosolic or membrane factor that interferes with or competes with GST-Pex5p binding.
Sixth, spectroscopic (CD) studies showed that the presence of the 20-amino acid N-terminal presequence significantly altered the conformational changes induced by SCP-2 binding to Pex5p(C). The complex formed by SCP-2 and Pex5p(C) contained more helix and more β-strand than that calculated from the individual protein spectra. NMR and X-ray crystallography show that SCP-2 interacts with Pex5p(C) through two sites: (i) insertion of the SCP-2 C-terminal 10-amino acid region (containing the C-terminal AKL PTS-1) into the PTS-1 recognition domain of Pex5p(C) and (ii) a 500 Å2 patch comprised of parts of α-helices-1 and -3 of SCP-2, which form a surface patch that interacts with the C-terminal helical bundle of Pex5p(C) (38, 44). It is important to note that NMR and X-ray crystallography show that interaction of Pex5p(C) with SCP-2 does not alter the structure of SCP-2 except for the 10 C-terminal amino acids (containing the C-terminal AKL peroxisomal targeting sequence 1), which adopt an extended conformation pointing away from the SCP-2 core and into Pex5p(C) (38, 39, 44). Instead, SCP-2 binding induces a major structural change in Pex5p(C) that undergoes a transition from an open, snail-like conformation to a closed, circular conformation (38, 44). There are as yet no available NMR or X-ray structures of the Pex5p(C)-proSCP-2 complex. However, NMR data show that the chemical shift perturbations in proSCP-2 upon binding of Pex5p(C) alter the same residues in proSCP-2 as in SCP-2 (38). While this indicates that, except for the C-terminal AKL, the “SCP-2” portion of proSCP-2 also undergoes little structural change in response to binding Pex5p(C), the CD data presented herein indicate that proSCP-2 also significantly changes the CD structure of the Pex5p(C)-proSCP-2 complex. Since these CD changes were nearly 2-fold smaller than those elicited by SCP-2 binding to Pex5p(C), this would suggest that proSCP-2 induced less structural change than SCP-2 in Pex5p(C). Indeed, comparison of the CD results shows that the SCP-2-Pex5p(C) complex had higher helix and β-strand content than the proSCP-2-Pex5p(C) complex. However, nothing is known regarding the type and extent of secondary structure change induced in Pex5p(C) by the cargo protein that is optimal for peroxisomal import of the complex, indicating that not only binding affinity but also the degree of conformational change induced in Pex5p(C) must be considered a contributory factor influencing interaction of the respective complexes with the other peroxisomal proteins involved in Pex5p(C)-mediated import of the bound cargo protein.
Finally, laser scanning confocal microscopy (LSCM) of proSCP-2 and SCP-2 incorporated into cultured cells indicated that the 20-amino acid N-terminal presequence significantly altered the intracellular targeting of the respective proteins within living and fixed cells. LSCM of Cy5-labeled proSCP-2 and SCP-2 incorporated into L-cell fibroblasts showed that SCP-2 was not exclusively associated with peroxisomes. Instead, SCP-2 was significantly associated with markers for other membrane organelles (mitochondria, plasma membrane) such that 66% of total SCP-2 colocalized with these three membranes. The 20-amino acid N-terminal presequence significantly influenced the relative intracellular distribution of SCP-2 between these membranes in cultured L-cell fibroblasts to preferentially target SCP-2 in the following order: peroxisomes > mitochondria > plasma membrane. It must be noted, however, that only 25% of proSCP-2 remained intact and only 42% of total proSCP-2 colocalized with these three membranes during the time frame of the experiment. The colocalization data together with in vitro studies (CD, FRET) were consistent with a role for the presequence in selective intracellular targeting of proSCP-2 versus SCP-2. In contrast, SCP-2 (without the 20-amino acid N-terminal presequence) was targeted preferentially to mitochondria > peroxisomes, plasma membrane. Detection of lower colocalization with the plasma membrane lipid raft and caveolae marker GM1 (bound by fluorescent CTX) in living cells was consistent with earlier biochemical fractionation, immunolabeling of fixed cells, and yeast two-hybrid studies showing that some SCP-2 directly interacts with caveolin-1 in lipid rafts and caveolae (5). Likewise, the more efficient targeting of proSCP-2 to peroxisomes was consistent with earlier studies showing that the C-terminal segment of 13 kDa SCP-2 is poorly accessible to antibodies and proteolytic enzymes (reviewed in refs 9, 12, and 49) as well as an NMR study indicating that the C-terminus covers the ligand binding site (14). In contrast, the C-terminus of 15 kDa proSCP-2 was more aqueous-exposed as indicated by accessibility to antibodies and proteolytic enzymes (49). Finally, immunolabeling of fixed cells shows that overexpression of proSCP-2 results in more SCP-2 colocalization with peroxisomal marker than overexpression of SCP-2 (49). Thus, it would appear that the 20-amino acid N-terminal presequence may facilitate targeting of the SCP-2 to peroxisomes potentially by (i) increasing aqueous exposure of the C-terminal AKL PTS-1 and (ii) altering the structure of the SCP-2 in the ligand binding domain in the region of the second membrane interaction site [i.e., 50Trp exposure and the cross-linking of bound FCBP with α-helix-1, which forms part of the second binding domain with Pex5p(C)]. The importance of the second interaction domain for peroxisomal targeting is underscored by results of studies with GFP fusion proteins containing the 25 amino acids in the N-terminus of proSCP-2 fused to the GFP N-terminus and/or the five-amino acid C-terminal portion of proSCP-2 (containing the AKL) fused to the GFP C-terminus, i.e., proGFP-AKL and GFP-AKL (45). Expression of these chimeras in CHO cells (wild type CHO, pex5-overexpressing, and pex7-overexpressing cells) and colocalization with organelle markers showed that proGFP-AKL was targeted to peroxisomes in a PTS-1-dependent Pex5p-mediated pathway while proGFP was colocalized with a mitochondrial marker, suggesting that the N-terminal presequence served as a mitochondrial targeting sequence and/or that peroxisomal import of SCP-2 requires not only the C-terminal AKL PTS-1 but also another region within SCP-2 [e.g., the surface patch comprised of α-helices-1 and -3 in SCP-2 that interacts with the C-terminal helical bundle of Pex5p(C) (38, 44)], but was not present in GFP (45). Although the N-terminal 20-amino acid presequence does not contain an N-terminal PTS-2 consensus sequence, i.e., −(R/K)(L/V/I)X5(H/Q)(L/A)- (45), other findings suggest a potential role for mitochondrial targeting. (i) The 20-amino acid N-terminal presequence of proSCP-2 shares some similarity to a peroxisomal targeting sequence as indicated by analysis with PSORT II (a sequence recognition program) (reviewed in refs 45 and 50). (ii) When CHO cells are transfected with a preGFP-AKL construct (i.e., 20-amino acid presequence of proSCP-2 fused to the N-terminus of GFP and AKL PTS-1 fused to the C-terminus of GFP), the GFP is targeted to mitochondria (45). (iii) In mutant CHO cells deficient in Pex5p, the proSCP-2 remained cytoplasmic while proGFP-AKL was mitochondrial, suggesting that mitochondrial targeting was interfered with in proSCP-2 (45).
In summary, the data presented herein are consistent with the 20-amino acid N-terminal presequence containing significant secondary structure (i.e., α-helix and β– sheet), altering the structure of SCP-2 (especially the ligand binding region), and differentially altering interaction with Pex5p(C) and suggest differential targeting of SCP-2 to peroxisomes versus mitochondria. These findings help to explain the distribution of SCP-2 detected not only by subcellular fractionation (see above) but also by anti-SCP-2 immunogold EM cytochemistry in cells and tissues showing the highest concentration of SCP-2 in peroxisomes, but significant amounts also in the cytoplasm, mitochondria, and endoplasmic reticulum. Taken together, these data indicate that more than half of the total SCP-2 is extraperoxisomal. The latter conclusion is confirmed by subcellular fractionation studies, which show that SCP-x, but not SCP-2, is copurified with peroxisomal markers (e.g., catalase), and even though 49% of the total SCP-2 is peroxisomal, half of the total SCP-2 is extraperoxisomal and localized in the cytosol (42%), mitochondria (7%), and endoplasmic reticulum (1%) (reviewed in refs 9, 51, and 52). Taken together, the data presented herein were consistent with proSCP-2 containing targeting sequences for both mitochondria (20 N-terminal amino acids) and peroxisomes (C-terminal AKL) (45). Regulation of intracellular localization of such proteins is complex as evidenced by another protein that also contains targeting sequences for both mitochondria and peroxisomes, i.e., L-alanine:glyoxylate aminotransferase, an enzyme present in peroxisomes of primates, in mitochondria of carnivores, and in both peroxisomes and mitochondria of rodents.
Footnotes
This work was supported in part by U.S. Public Health Service National Institutes of Health Grants DK41402 and GM31651. H. A. H. was supported in part by U.S. Public Health National Institutes of Health Grant DK077573; J. B. was supported in part by U.S. Public Health Service National Institutes of Health Grant GM63236.
Abbreviations: −20-+1proSCP-2, MGFPEAASSF RTHQIEAVPT; −20-+9proSCP-2, MGFPEAASSF RTHQIEAVPT SSASDGFKA; −20-+24proSCP-2, MGFPEAASSF RTHQIEAVPT SSASDGFKAN LVFKEIEKKL EEEG; +1-+24SCP-2, SSASDGFKAN LVFKEIEKKL EEEG; CD, circular dichroism; DOPS, dioleoylglycero-3-phosphoserine; FCBP, free cholesterol benzophenone; NMR, nuclear magnetic resonance; Pex5p(C), a 41-kDa fragment comprising residues 235-602 and encompassing the seven predicted tetratricopeptide repeat (TPR) region as well as the peroxisomal targeting signal-1 binding region of human peroxin 5; POPC, 1-palmitoyl-2-oleoylglycero-3-phosphocholine; proSCP-2, SCP-2 with the N-terminal 20-amino acid presequence; PTS1, peroxisomal targeting signal-1; SCP-2, sterol carrier protein-2; SUV, small unilamellar vesicle; TPR, tetratricopeptide repeat.
References
- 1.Gallegos AM, Atshaves BP, Storey SM, Starodub O, Petrescu AD, Huang H, McIntosh A, Martin G, Chao H, Kier AB, Schroeder F. Gene structure, intracellular localization, and functional roles of sterol carrier protein-2. Prog Lipid Res. 2001;40:498–563. doi: 10.1016/s0163-7827(01)00015-7. [DOI] [PubMed] [Google Scholar]
- 2.Schroeder F, Atshaves BP, Gallegos AM, McIntosh AL, Liu JC, Kier AB, Huang H, Ball JM. Lipid rafts and caveolae organization. In: Frank PG, Lisanti MP, editors. Advances in Molecular and Cell Biology. Elsevier; Amsterdam: 2005. pp. 3–36. [Google Scholar]
- 3.Atshaves BP, Gallegos A, McIntosh AL, Kier AB, Schroeder F. Sterol carrier protein-2 selectively alters lipid composition and cholesterol dynamics of caveolae/lipid raft vs non-raft domains in L-cell fibroblast plasma membranes. Biochemistry. 2003;42:14583–14598. doi: 10.1021/bi034966+. [DOI] [PubMed] [Google Scholar]
- 4.Atshaves BP, McIntosh AL, Payne HR, Gallegos AM, Landrock K, Maeda N, Kier AB, Schroeder F. Sterol carrier protein-2/sterol carrier protein-x gene ablation alters lipid raft domains in primary cultured mouse hepatocytes. J Lipid Res. 2007;48:2193–2211. doi: 10.1194/jlr.M700102-JLR200. [DOI] [PubMed] [Google Scholar]
- 5.Parr RD, Martin GG, Hostetler HA, Schroeder ME, Mir KD, Kier AB, Ball JM, Schroeder F. A new N-terminal recognition domain in caveolin-1 interacts with sterol carrier protein-2 (SCP-2) Biochemistry. 2007;46:8301–8314. doi: 10.1021/bi7002636. [DOI] [PMC free article] [PubMed] [Google Scholar]
- 6.Zhou M, Parr RD, Petrescu AD, Payne HR, Atshaves BP, Kier AB, Ball JA, Schroeder F. Sterol carrier protein-2 directly interacts with caveolin-1 in vitro and in vivo. Biochemistry. 2004;43:7288–7306. doi: 10.1021/bi035914n. [DOI] [PubMed] [Google Scholar]
- 7.Schroeder F, Zhou M, Swaggerty CL, Atshaves BP, Petrescu AD, Storey S, Martin GG, Huang H, Helmkamp GM, Ball JM. Sterol carrier protein-2 functions in phosphatidylinositol transfer and signaling. Biochemistry. 2003;42:3189–3202. doi: 10.1021/bi026904+. [DOI] [PubMed] [Google Scholar]
- 8.Matsuura JE, George HJ, Ramachandran N, Alvarez JG, Strauss JFI, Billheimer JT. Expression of the mature and the pro-form of human sterol carrier protein 2 in Escherichia coli alters bacterial lipids. Biochemistry. 1993;32:567–572. doi: 10.1021/bi00053a023. [DOI] [PubMed] [Google Scholar]
- 9.Gallegos AM, Atshaves BP, Storey SM, Starodub O, Petrescu AD, Huang H, McIntosh A, Martin G, Chao H, Kier AB, Schroeder F. Gene structure, intracellular localization, and functional roles of sterol carrier protein-2. Prog Lipid Res. 2001;40:498–563. doi: 10.1016/s0163-7827(01)00015-7. [DOI] [PubMed] [Google Scholar]
- 10.Atshaves BP, McIntosh AL, Landrock D, Payne HR, Mackie J, Maeda N, Ball JM, Schroeder F, Kier AB. Effect of SCP-x gene ablation on branched-chain fatty acid metabolism. Am J Physiol. 2007;292:939–951. doi: 10.1152/ajpgi.00308.2006. [DOI] [PubMed] [Google Scholar]
- 11.Seedorf U, Brysch P, Engel T, Schrage K, Assmann G. Sterol carrier protein X is peroxisomal 3-oxoacyl coenzyme A thiolase with intrinsic sterol carrier and lipid transfer activity. J Biol Chem. 1994;269:21277–21283. [PubMed] [Google Scholar]
- 12.Stolowich NJ, Petrescu AD, Huang H, Martin G, Scott AI, Schroeder F. Sterol carrier protein-2: Structure reveals function. Cell Mol Life Sci. 2002;59:193–212. doi: 10.1007/s00018-002-8416-8. [DOI] [PMC free article] [PubMed] [Google Scholar]
- 13.Choinowski T, Hauser H, Piotnek K. Structure of sterol carrier protein 2 at 1.8 Å resolution reveals a hydrophobic tunnel suitable for lipid binding. Biochemistry. 2000;39:1897–1902. doi: 10.1021/bi992742e. [DOI] [PubMed] [Google Scholar]
- 14.Garcia FL, Szyperski T, Dyer JH, Choinowski T, Seedorf U, Hauser H, Wuthrich K. NMR structure of the sterol carrier protein-2: Implications for the biological role. J Mol Biol. 2000;295:595–603. doi: 10.1006/jmbi.1999.3355. [DOI] [PubMed] [Google Scholar]
- 15.Schagger H, von Jagow G. Tricine-sodium dodecyl sulfate-polyacrylamide gel electrophoresis for the separation of proteins in the range from 1 to 100 kDa. Anal Biochem. 1987;166:368–379. doi: 10.1016/0003-2697(87)90587-2. [DOI] [PubMed] [Google Scholar]
- 16.Park ZY, Russell DH. Identification of individual proteins in complex protein mixtures by high-resolution, high-mass-accuracy MALDI TOF-mass spectrometry analysis of in-solution thermal denaturation/enzymatic digestion. Anal Chem. 2001;73:2558–2564. doi: 10.1021/ac001488p. [DOI] [PubMed] [Google Scholar]
- 17.Huang H, Gallegos A, Zhou M, Ball JM, Schroeder F. Role of sterol carrier protein-2 N-terminal membrane binding domain in sterol transfer. Biochemistry. 2002;41:12149–12162. doi: 10.1021/bi0260536. [DOI] [PubMed] [Google Scholar]
- 18.Gatto GJ, Jr, Geisbrecht BV, Gould SJ, Berg JM. Peroxisomal targeting signal-1 recognition by the TPR domains of human PEX5. Nat Struct Biol. 2000;7:1091–1095. doi: 10.1038/81930. [DOI] [PubMed] [Google Scholar]
- 19.Spencer TA, Wang P, Li D, Russel JS, Blank DH, Huuskonen J, Fielding PE, Fielding CJ. Benzophenone-containing cholesterol surrogates: Synthesis and biological evaluation. J Lipid R. 2004;45:1510–1518. doi: 10.1194/jlr.M400081-JLR200. [DOI] [PubMed] [Google Scholar]
- 20.Wang P, Spencer TA. Preparation of isotopically labelled benzophenone-containing lipid analogues. J Labelled Compd Radiopharm. 2005;48:781–788. [Google Scholar]
- 21.Pace CN, Vajdos F, Fee L, Grimsley G, Gray T. How to measure and predict the molar absorption coefficient of a protein. Prot Sci. 1997;4:2411–2423. doi: 10.1002/pro.5560041120. [DOI] [PMC free article] [PubMed] [Google Scholar]
- 22.Bradford M. A rapid and sensitive method for the quantitation of microgram quantities of protein utilizing the principle of protein dye binding. Anal Biochem. 1976;72:248–254. doi: 10.1006/abio.1976.9999. [DOI] [PubMed] [Google Scholar]
- 23.Eftink M, Ghiron CA. Exposure of tryptophanyl residues in proteins. Quantitative determination by fluorescence quenching studies. Biochem. 1976;15:672–680. doi: 10.1021/bi00648a035. [DOI] [PubMed] [Google Scholar]
- 24.Eftink MR, Ghiron CA. Fluorescence quenching studies with proteins. Anal Biochem. 1981;114:199–227. doi: 10.1016/0003-2697(81)90474-7. [DOI] [PubMed] [Google Scholar]
- 25.Lakowicz JR. Principles of Fluorescence Spectroscopy. 3. Springer Science; New York: 2006. Quenching of fluorescence; pp. 277–330. [Google Scholar]
- 26.Petrescu AD, Payne HR, Boedeker AL, Chao H, Hertz R, Bar-Tana J, Schroeder F, Kier AB. Physical and functional interaction of acyl CoA binding protein (ACBP) with hepatocyte nuclear factor-4α (HNF4α) J Biol Chem. 2003;278:51813–51824. doi: 10.1074/jbc.M303858200. [DOI] [PubMed] [Google Scholar]
- 27.Hostetler HA, Petrescu AD, Kier AB, Schroeder F. Peroxisome proliferator activated receptor α (PPARα) interacts with high affinity and is conformationally responsive to endogenous ligands. J Biol Chem. 2005;280:18667–18682. doi: 10.1074/jbc.M412062200. [DOI] [PubMed] [Google Scholar]
- 28.Hostetler HA, Kier AB, Schroeder F. Very-long-chain and branched-chain fatty acyl CoAs are high affinity ligands for the peroxisome proliferator-activated receptor α (PPARα) Biochemistry. 2006;45:7669–7681. doi: 10.1021/bi060198l. [DOI] [PMC free article] [PubMed] [Google Scholar]
- 29.Sreerama N, Woody R. Estimation of protein secondary structure from circular dichroism spectra: Comparison of CONTIN, SELCON, and DCSSTR methods with an expanded reference set. Anal Biochem. 2000;287:252–260. doi: 10.1006/abio.2000.4880. [DOI] [PubMed] [Google Scholar]
- 30.Fielding PE, Russell JS, Spencer TA, Hakamata H, Nagao K, Fielding CJ. Sterol efflux to apolipprotein A-1 originates from caveolin-rich microdomains and potentiates PDGF-dependent protein kinase activity. Biochem. 2002;41:4929–4937. doi: 10.1021/bi012091y. [DOI] [PubMed] [Google Scholar]
- 31.Wouters F, Bastiaens PI, Wirtz KW, Jovin TM. FRET microscopy demonstrates molecular association of non-specific lipid transfer protein (nsL-TP) with fatty acid oxidation enzymes. EMBO J. 1998;17:7179–7189. doi: 10.1093/emboj/17.24.7179. [DOI] [PMC free article] [PubMed] [Google Scholar]
- 32.Forster T. Mechanism of energy transfer. In: Florkin M, Statz EH, editors. Comprehensive Biochemistry. Elsevier Scientific Publishers; New York: 1967. pp. 61–77. [Google Scholar]
- 33.Bandichhor R, Petrescu AD, Vespa A, Kier AB, Schroeder F, Burgess K. Water Soluble through bond energy transfer cassettes in intracellular imaging. Bioconjugate Chem. 2006;17:1219–1225. doi: 10.1021/ja063784a. [DOI] [PubMed] [Google Scholar]
- 34.Bandichhor R, Petrescu AD, Vespa A, Kier AB, Schroeder F, Burgess K. Synthesis of a new water soluble rhodamine derivative and application to intracellular imaging. J Am Chem Soc. 2006;128:10688–10689. doi: 10.1021/ja063784a. [DOI] [PubMed] [Google Scholar]
- 35.Huang H, Starodub O, McIntosh A, Kier AB, Schroeder F. Liver fatty acid binding protein targets fatty acids to the nucleus: Real-time confocal and multiphoton fluorescence imaging in living cells. J Biol Chem. 2002;277:29139–29151. doi: 10.1074/jbc.M202923200. [DOI] [PubMed] [Google Scholar]
- 36.Martin GG, Danneberg H, Kumar LS, Atshaves BP, Erol E, Bader M, Schroeder F, Binas B. Decreased liver fatty acid binding capacity and altered liver lipid distribution in mice lacking the liver fatty acid binding protein (L-FABP) gene. J Biol Chem. 2003;278:21429–21438. doi: 10.1074/jbc.M300287200. [DOI] [PubMed] [Google Scholar]
- 37.Nemecz G, Jefferson JR, Schroeder F. Polyene fatty acid interactions with recombinant intestinal and liver fatty acid binding proteins. J Biol Chem. 1991;266:17112–17123. [PubMed] [Google Scholar]
- 38.Stanley WA, Filipp FV, Kursula P, Schuller N, Erdmann R, Schliebs W, Sattler M, Wilmanns M. Recognition of a functional peroxisome type 1 target by dynamic import receptor Pex5p. Mol Cell. 2006;24:653–663. doi: 10.1016/j.molcel.2006.10.024. [DOI] [PMC free article] [PubMed] [Google Scholar]
- 39.Stanley WA, Sokolova A, Brown A, Clarke DT, Wilmanns M, Svergun DI. Synergistic use of synchrotron radiation techniques for biological samples in solution: A case study on protein-ligand recognition by the peroxisomal import receptor Pex5p. J Synchrotron Radiat. 2004;11:490–496. doi: 10.1107/S090904950402504X. [DOI] [PubMed] [Google Scholar]
- 40.Cantor CR, Schimmel PR. Absorption Spectroscopy. In: Cantor CR, Schimmel PR, editors. Part II: Techniques for the study of biological structure and function. W. H. Freeman; San Francisco, CA: 1980. pp. 349–408. [Google Scholar]
- 41.Lakowicz JR. Protein Fluorescence. In: Lakowicz JR, editor. Principles of Fluorescence Spectroscopy. 3. Springer; New York: 2006. pp. 530–577. [Google Scholar]
- 42.Eftink M. The use of fluorescence methods to monitor unfolding transitions in proteins. Biophys J. 1994;64:482–501. doi: 10.1016/s0006-3495(94)80799-4. [DOI] [PMC free article] [PubMed] [Google Scholar]
- 43.Szyperski T, Scheek S, Johansson J, Assmann G, Seedorf U, Wuthrich K. NMR determination of the secondary structure and the three-dimensional polypeptide backbone fold of the human sterol carrier protein 2. FEBS Lett. 1993;335:18–26. doi: 10.1016/0014-5793(93)80431-s. [DOI] [PubMed] [Google Scholar]
- 44.Filipp FV, Sattler M. Conformational plasticity of the lipid transfer protein SCP-2. Biochemistry. 2007;46:7980–7991. doi: 10.1021/bi6025616. [DOI] [PMC free article] [PubMed] [Google Scholar]
- 45.Otera H, Nishimura M, Stetoguchi K, Mori T, Fujiki Y. Biogenesis of nonspecific lipid transfer protein and sterol carrier protein x. J Biol Chem. 2001;276:2858–2864. doi: 10.1074/jbc.M007730200. [DOI] [PubMed] [Google Scholar]
- 46.Weber FE, Dyer JH, Garcia FL, Werder M, Szyperski T, Wuthrich K, Hauser H. In pre-sterol carrier protein 2 (SCP2) in solution the leader peptide is flexibly disordered, and residues 21-143 adopt the same globular fold as in mature SCP-2. Cell Mol Life Sci. 1998;54:751–759. doi: 10.1007/s000180050203. [DOI] [PMC free article] [PubMed] [Google Scholar]
- 47.Dansen TB, Westerman J, Wouters F, Wanders RJ, van Hoek A, Gadella TW, Wirtz KW. High affinity binding of very long chain fatty acyl CoA esters to the peroxisomal non-specific lipid transfer protein (sterol carrier protein-2) Biochem J. 1999;339:193–199. [PMC free article] [PubMed] [Google Scholar]
- 48.Schroeder F, Atshaves BP, McIntosh AL, Gallegos AM, Storey SM, Parr RD, Jefferson JR, Ball JM, Kier AB. Sterol carrier protein-2: New roles in regulating lipid rafts and signaling. Biochim Biophys Acta. 2007;1771:700–718. doi: 10.1016/j.bbalip.2007.04.005. [DOI] [PMC free article] [PubMed] [Google Scholar]
- 49.Schroeder F, Frolov A, Starodub O, Russell W, Atshaves BP, Petrescu AD, Huang H, Gallegos A, McIntosh A, Tahotna D, Russell D, Billheimer JT, Baum CL, Kier AB. Pro-sterol carrier protein-2: Role of the N-terminal presequence in structure, function, and peroxisomal targeting. J Biol Chem. 2000;275:25547–25555. doi: 10.1074/jbc.M000431200. [DOI] [PubMed] [Google Scholar]
- 50.Keller GA, Scallen TJ, Clarke D, Maher PA, Krisans SK, Singer SJ. Subcellular localization of sterol carrier protein-2 in rat hepatocytes: Its primary localization to peroxisomes. J Cell Biol. 1989;108:1353–1361. doi: 10.1083/jcb.108.4.1353. [DOI] [PMC free article] [PubMed] [Google Scholar]
- 51.van Heusden GPH, Bos K, Wirtz KWA. The occurrence of soluble and membrane-bound non-specific lipid transfer protein (sterol carrier protein 2) in rat tissues. Biochim Biophys Acta. 1990;1046:315–321. doi: 10.1016/0005-2760(90)90247-u. [DOI] [PubMed] [Google Scholar]
- 52.van Heusden GPH, Bos K, Raetz CR, Wirtz KWA. Chinese hamster ovary cells deficient in peroxisomes lack the nonspecific lipid transfer protein (sterol carrier protein 2) J Biol Chem. 1990;265:4105–4110. [PubMed] [Google Scholar]
- 53.Rost B, Sander C. Prediction of protein secondary structure at better than 70% accuracy. J Mol Biol. 1993;232:584–599. doi: 10.1006/jmbi.1993.1413. [DOI] [PubMed] [Google Scholar]
- 54.Rost B, Fariselli P, Casadio R. Topology prediction for helical transmembrane proteins at 86% accuracy. Prot Sci. 1996;5:1704–1718. doi: 10.1002/pro.5560050824. [DOI] [PMC free article] [PubMed] [Google Scholar]