Abstract
Nile Red is sequentially metabolized by Cytochrome P4503A4 to the N-monoethyl and N-desethyl products, which typifies the metabolism of many amine-containing drugs. Sequential metabolism of a single substrate results in complex kinetics that confound predictive models of drug clearance. As a fluorescent model for drugs which undergo sequential metabolism, Nile Red provides the opportunity to monitor drug-CYP interactions wherein the fluorescent properties of Nile Red could, in principle, be exploited to determine individual rate and equilibrium constants for the individual reactions. Previously, it was shown that Nile Red binds at the active site and fluoresces (KD = 50 nM) with maximum emission at ~620 nm, but it was unclear whether a red-shifted emission, at ~660 nm, consisted of only free Nile Red or Nile Red bound at a second site on the protein. Here, equilibrium binding studies, including ‘reverse titrations’ spanning low ratios of CYP3A4/Nile Red, indicate two binding sites for Nile Red with a contribution to the ‘red emission’ greater than can be accounted for by free Nile Red. Singular value decomposition affords basis spectra for both spectral components and fits well to the experimentally determined concentration dependence of Nile Red emission. In addition, the red spectral component, with an apparent KD = 2.2 µM, is selectively eliminated by titration with the known allosteric effectors of CYP3A4, α-napthoflavone and testosterone. Furthermore, the double mutant L2311F/D214E, previously demonstrated to perturb a peripheral allosteric site, lacks the red-emitting Nile Red binding site, but retains the blue-emitting site. Together these data indicate that a second Nile Red site competes with other effectors of CYP3A4 at a site that results in Nile Red emission at 660 nm.
Keywords: Cytochrome P450 3A4, drug metabolism, allosterism, homotropic effectors, Nile Red, solvatochromism
As detoxification enzymes, Cytochrome P450’s (CYPs)1 catalyze a wide range of oxidative and reductive reactions with an enormous range of structurally distinct substrates [1–4]. CYPs dominate the metabolism of nearly all prescribed therapeutic drugs, as well as a number of endogenous hormones and xenobiotics, and thus control their steady state plasma and tissue levels [1, 5, 6]. Their ability to perform complex oxidative metabolism on a structurally diverse set of compounds is often accompanied by complex non-Michaelis-Menten, or “allosteric”, kinetics [7–9]. The predominant human hepatic drug metabolizing CYP isoform, CYP 3A4, has been studied extensively with regard to allosteric kinetic phenomena [10–13]. Most models used to explain the cooperativity of this enzyme have relied on the postulate that multiple ligands bind simultaneously to the enzyme [8, 14, 15], although direct confirmation of the specific location of binding sites has been challenging. Spectroscopic studies [16, 17] and recently published X-ray crystal structures [18] have suggested that multiple ligand binding within the CYP3A4 active site is possible, as is binding at a remote site on the protein surface. However, allosteric kinetics could be observed, even in the absence of multiple ligand binding, if kinetically distinct conformations are not in rapid equilibrium [19, 20]. As described by Korzekwa and co-workers, the kinetic patterns resulting from any of these binding scenarios fall into four categories: heterotropic activation, homotropic activation, substrate inhibition, and biphasic kinetics [9]. A further complication of CYPs is their ability, in some cases, to catalyze sequential oxidations of a single substrate, thus generating a complex distribution of products.
In a previous study we identified Nile Red as a sequential substrate for CYP3A4 with potentially useful fluorescent properties that could be used to probe allosteric effects and mechanisms of sequential metabolism [21]. Nile Red is metabolized to the N-mono-ethyl- and N-des-ethyl analogs, and thus mimics the sequential N-dealkylation observed for many drugs that contain a tertiary amine group. To the extent that drugs of this type often lead to mechanism-based inactivation of CYPs it would be valuable to further understand the sequential metabolism of Nile Red. Whereas the velocity vs. [Nile Red] plots are hyperbolic with CYP3A4, the concentration dependence of the ferric heme spin state is sigmoidal, suggesting multiple binding of Nile Red. An aspect of the previous work that remained unresolved was whether two separate Nile Red binding sites on CYP3A4 could be distinguished spectroscopically against a potential background of fluorescence from free Nile Red.
Previously, our lab and others have elucidated the utility of model fluorescent probes to better characterize the location and thermodynamics of effector ligand binding to CYP3A4 [10, 22, 23]. Here, we extend the previous studies of CYP3A4 interactions with the fluorescent substrate Nile Red, which provides the advantage of strong solvatochromism and which could, in principle, be used to explore the properties of CYP3A4 at different ligand occupancies. We also studied changes in Nile Red fluorescence caused by the CYP3A4 allosteric effectors α-napthoflavone (ANF) and testosterone (TST). The fluorescent properties of Nile Red are likely to be useful in subsequent studies of CYP3A4 function.
Materials and Methods
Chemicals
All chemicals used were of analytical grade and obtained from commercial sources. Solvents were HPLC grade and all water used was deionized, distilled Milli-Q quality. Nile Red was obtained from Invitrogen Corp. (Carlsbad, CA). The potassium salt of 2-p-toluidinylnapthalene-6- sulfonic acid (TNS) was obtained from Marker Gene Technologies (Eugene, OR). All other chemicals used were obtained from Sigma-Aldrich (St. Louis, MO), unless otherwise noted.
Protein Expression and Purification
Recombinant CYP3A4 was expressed and purified from E. coli as described previously, using a French press to lyse the cells [10]. The CYP3A4-L211F/D214E mutant originally produced by Harlow and Halpert [24] was generated with the QuikChange site-directed mutagenesis kit (Stratagene) using the following primer sequences: 5'-CGGGATCCAAAAAATCAAATCTAAAAAGCTTCTTGG-3' (L211F) and 5'-CGGGATCCAAAAATTCAAATCT-3' (D214E), designed to hybridize in the reverse direction. The mutant protein was expressed and purified under the same conditions as used for the wild-type CYP3A4 protein. When purification was complete, the concentration of CYP3A4 was quantified by the method of Omura and Sato, using an extinction coefficient of 91 mM−1cm−1 [25]. The protein was greater than 95% pure based on SDS-PAGE gel analysis. The purified CYP3A4 was divided into 1 mL aliquots and stored at −80°C until further use.
Absorbance Spectroscopy
The Type I spectral shift induced by Nile Red was monitored by optical difference spectroscopy as previously described [21]. For reverse titrations, the absolute absorbance of a 10 µM solution of Nile Red in buffer was monitored as small aliquots of a solution containing 5 µM CYP3A4 and 10 µM Nile Red were added. This ensured that Nile Red concentration was held constant at 10 µM throughout the reverse titration.
Steady-State Fluorescence Spectroscopy
All steady-state fluorescence measurements were carried out using an 8100 SLM-Aminco spectrofluorometer with both emission and excitation monochromators. For binding titrations with Nile Red, the excitation wavelength used was 550 nm with a bandpass of 4 nm for both monochromators. Emission spectra were acquired from 560 nm to 800 nm at a scan rate of 5 nm/s. For the initial titration, either a 0.5 mM or a 1 mM stock solution of Nile Red dissolved in acetonitrile was used. The titration was carried out by sequentially adding 1 µL aliquots of the Nile Red stock solution to a 1 mL solution of 1 µM CYP3A4 diluted in 100 mM potassium phosphate, 20% glycerol, and 1 mM EDTA, pH 7.4. Emission spectra were acquired after a 1 min. equilibration period. Samples were continuously stirred during both equilibration and spectral acquisition. Care was taken so that the final concentration of acetonitrile in the cuvette did not exceed 1.5%. All spectra were recorded at 22°C (room temperature).
For reverse titrations, the fluorescence emission of 10 µM Nile Red in buffer (excited at 550 nm) was monitored between 590 nm and 730 nm as small aliquots of a solution containing 5 µM CYP3A4 and 10 µM Nile Red were added. As with the absorbance reverse titration, this procedure ensured that Nile Red concentration was constant at 10 µM.
In order to determine the extent of the relative fluorescence contribution from different fluorescent species, Singular Value Decomposition (SVD) was performed using an in-house SVD analysis program (available at http://bob.mchem.washington.edu/pca/). Fluorescence scans at a range of ligand concentrations were assembled into a matrix, for which the Compact SVD was calculated using the linalg.svd() function of the SciPy scientific computing package [26] for Python.
Kinetic Simulations
Kinetic simulations were performed using the GEPASI Biochemical Simulation Module [27–29] as described previously [11]. Briefly, two-site random-ordered binding models were created with all bimolecular association constants fixed at 1 µM−1s−1. The Levenberg-Marquadt fitting module of GEPASI was used to vary dissociation constants and specific contributions to experimental signals (absorbance change, or specific fluorescence) so as to minimize χ2 between observed data and simulated steady-state concentrations.
Results and Discussion
Homotropic Cooperativity of Nile Red
Titration of Nile Red into a solution of 1µM CYP 3A4 yields a peak at ~620 nm at low stoichiometries of ligand followed by a shift to fluorescence at ~660 nm at higher Nile Red concentrations (Figure 1A). The high affinity binding that yields emission at shorter wavelength, the ‘blue species,’ has been previously characterized and suggested to correspond to active site binding by Nile Red [21]. The emission at 660 nm, the ‘red species’, requires further characterization as its emission overlaps that of free Nile Red in the solution conditions used, and presumably includes a contribution from it. The intensity of this red species at low concentrations of Nile Red is significantly enhanced in the presence of CYP3A4 (Figure 1B). (Note that in the experimental concentration range, Nile Red background fluorescence increases in a non-linear sigmoidal manner (gray lines in Figure 2C and Figure 3B), possibly reflecting increased quantum yields for low-stoichiometry complexes of the dye, and subsequent quenched dye aggregates in solution.) In addition, the decrease in the blue-shifted fluorescence at high ligand concentrations suggests that this signal may be primarily due to a lower-occupancy CYP3A4-ligand complex, which becomes less populated in favor of complexes with multiple Nile Reds bound at higher [Nile Red[. Along with the sigmoidal nature of the Type I spectral change induced by Nile Red (Figure 1C), these observations qualitatively suggest that there exists a second binding site for Nile Red on CYP3A4.
Figure 1.
A. Fluorescence of increasing concentrations of Nile Red in the presence of 1 µM wtCYP3A4. The signal shifts from a λem of ~620 nm at low ligand concetrations to a λem of ~660 nm at high concentrations. B. The fluorescence of 2 µM Nile Red in the presence and absence of 1 µM CYP3A4. Both ‘blue’ (~620 nm) and ‘red’ (~660 nm) spectral components are enhanced by binding to CYP3A4. C. Absorbance spectroscopy of the Type I spin shift induced by Nile Red binding wtCYP3A4. The binding isotherm fits well (solid line) to a two-site sequential model with KD values of 0.05 ± 0.1 µM and 2.3 ± 0.35 µM, with the first Nile Red molecule having 13% of the effect on the spin state that the second molecule does.
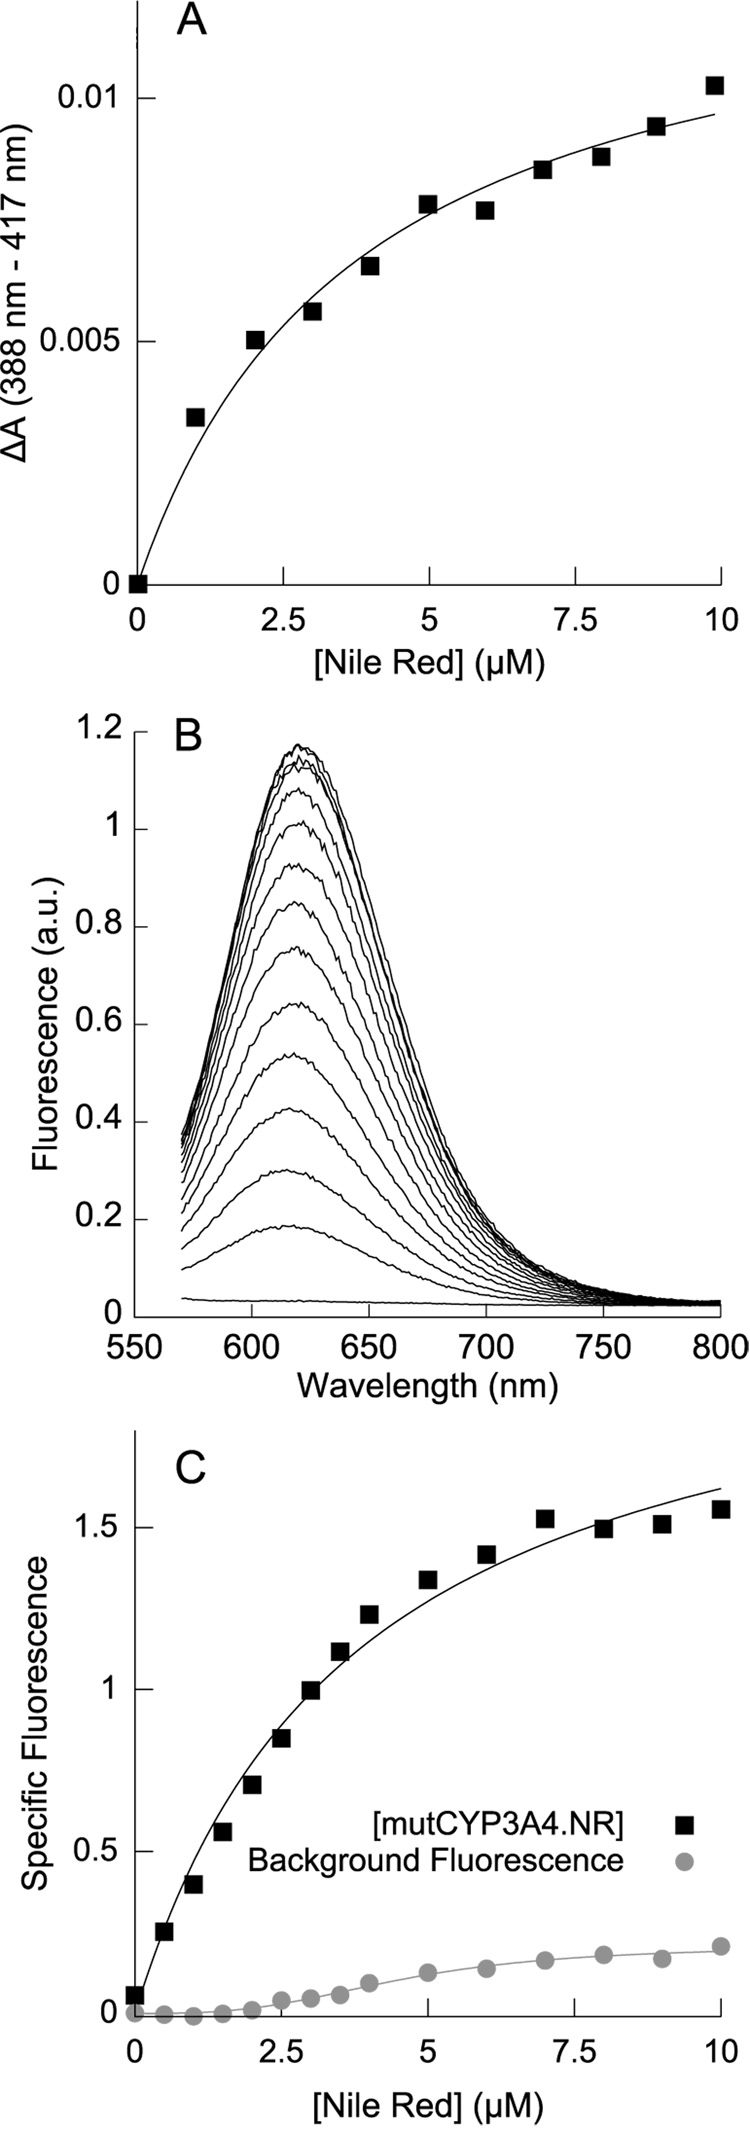
Figure 2.
A. Absorbance spectroscopy of the Type I spin shift induced by Nile Red binding mutCYP3A4, globally fit (along with the fluorescence data in C) to a hyperbolic binding equation with KD value of 3.8 ± 0.33 µM. B. Fluorescence of increasing concentrations of Nile Red with 1 µM mutCYP3A4 (CYP3A4 L211F/D214E) shows a single fluorescent species corresponding to the blue species centered at ~620 nm observed with wtCYP3A4. This species may represent the singly-occupied [CYP3A4•Nile Red] complex. C. Nile Red fluorescence when binding to mutCYP3A4, globally fit (along with the absorbance data in A) to a hyperbolic binding equation with a KD value of 3.8 ± 0.33 µM. Global fits of the data in A and C to the Hill binding equation yield a Hill coefficient of 1.06 and an S50 of 3.4 µM. The simpler hyperbolic model is supported by both the Akaike Information Criterion and the F-test, suggesting that mutCYP3A4 only binds a single Nile Red molecule.
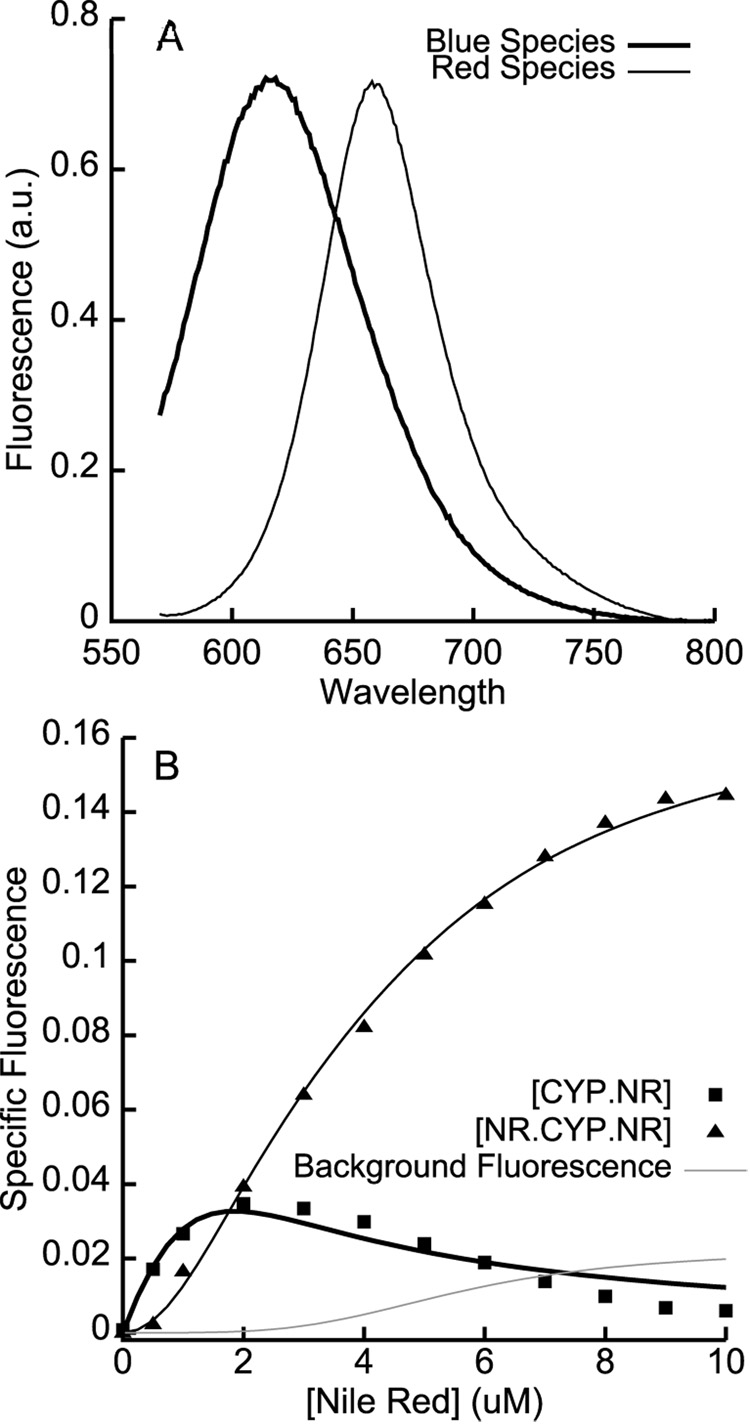
Figure 3.
A. The basis spectra used for spectral deconvolution of Nile Red fluorescence. The blue species was obtained from Nile Red bound to CYP3A4 L211F/D214E; the red species basis spectrum was obtained from the normalized difference between the blue basis spectrum and Nile Red bound to wtCYP3A4. B. The deconvoluted specific binding isotherms show the initial increase in the blue species at low [Nile Red], followed by its decline and the concomitant sigmoidal increase in the red species at higher [Nile Red]. The solid lines are global fits to kinetic simulations of a two-site sequential binding model with KD values of 0.32 ± 0.18 µM and 2.2 ± 0.33 µM. The grey line shows the free Nile Red contribution to the ‘red’ fluorescent species, based on a standard curve with Nile Red in buffer and the steady-state free Nile Red concentration obtained from the kinetic simulations.
To investigate the possibility of multiple binding and better understand the complexity of the observed fluorescence, we studied the binding of Nile Red to the CYP3A4 L211F/D214E double mutant [24, 30], in which ligand binding to an allosteric site is abolished. Several compounds that display sigmoidal turnover kinetics and binding behavior with wild-type CYP3A4 (wtCYP3A4) show hyperbolic behavior with CYP3A4 L211F/D214E (mutCYP3A4), including known effectors such as α-naphthoflavone. When Halpert and coworkers first characterized this double mutant [24, 30], no CYP3A4 crystal structure existed. However, with several crystal structures now available, functional properties of this mutant are reasonably expected. Specifically, both Asp-214 and Leu-211 are within 4 Å of the peripherally bound progesterone molecule observed in the structure reported by Williams et al. [31], and they contribute direct or first sphere interactions with the ligand. Mutation of both residues presumably disrupts the peripheral effector site and thereby favors initial binding near the heme.
Nile Red binding to mutCYP3A4 was monitored by the Type I spectral shift (Fig 2A) and by Nile Red fluorescence when titrated into mutCYP3A4 (Figure 2B, C); the data from both experiments were globally well-fit by a single-site hyperbolic binding model with a KD of 3.8 ± 0.33 µM. Fits to the Hill equation yielded a Hill coefficient of 1.06 and an S50 of 3.4 µM; the simpler hyperbolic model is preferred by virtue of a lower Akaike Information Criterion (ΔAIC = 2.47), and by the F-test (P-value for Hill binding model = 0.55). The hypothesis of a single Nile Red binding site on mutCYP3A4 is supported by the fact that only the blue fluorescent component (~620 nm) is observed, with no significant red-shifted fluorescence. Taken together, these data suggest that Nile Red can bind to the same peripheral site in wtCYP3A4 observed for other effectors.
SVD-based spectral deconvolution is a well-known analytical technique [32] that can be conveniently applied to the analysis of steady-state fluorescence data. Deconvolution requires the careful selection of basis spectra for the various species contributing to an observed experimental signal. The emission spectrum of Nile Red bound to mutCYP3A4 exactly matched the blue species apparent in the titration with wt CYP3A4. We therefore used the mutCYP3A4-Nile Red spectrum as a putative basis spectrum for the blue species; the normalized difference between wtCYP3A4-Nile Red and mutCYP3A4-Nile Red emission spectra at various concentrations provided a basis spectrum for the red species (Figure 3A). Spectral deconvolution on the titration of Nile Red into wtCYP3A4 using these basis spectra provided apparent binding isotherms for both fluorescent species (Figure 3B). The concentration of the blue species initially increased and then decreased in a manner reminiscent of substrate inhibition ν-[S] plots, while the concentration of the red species increased sigmoidally. Both specific fluorescence curves were globally fit to a sequential 2-site binding model where the blue species represented singlyoccupied CYP3A4•NR, and the red species represented doubly-occupied NR•CYP3A4•NR. The recovered KD values for the two binding events were 0.32 ± 0.18 µM and 2.2 ± 0.33 µM, in good agreement with the values previously obtained (0.05 ± 0.1 µM and 2.3 ± 0.35 µM respectively) from fits of a similar model to Type I spectral shift data (Figure 1C).
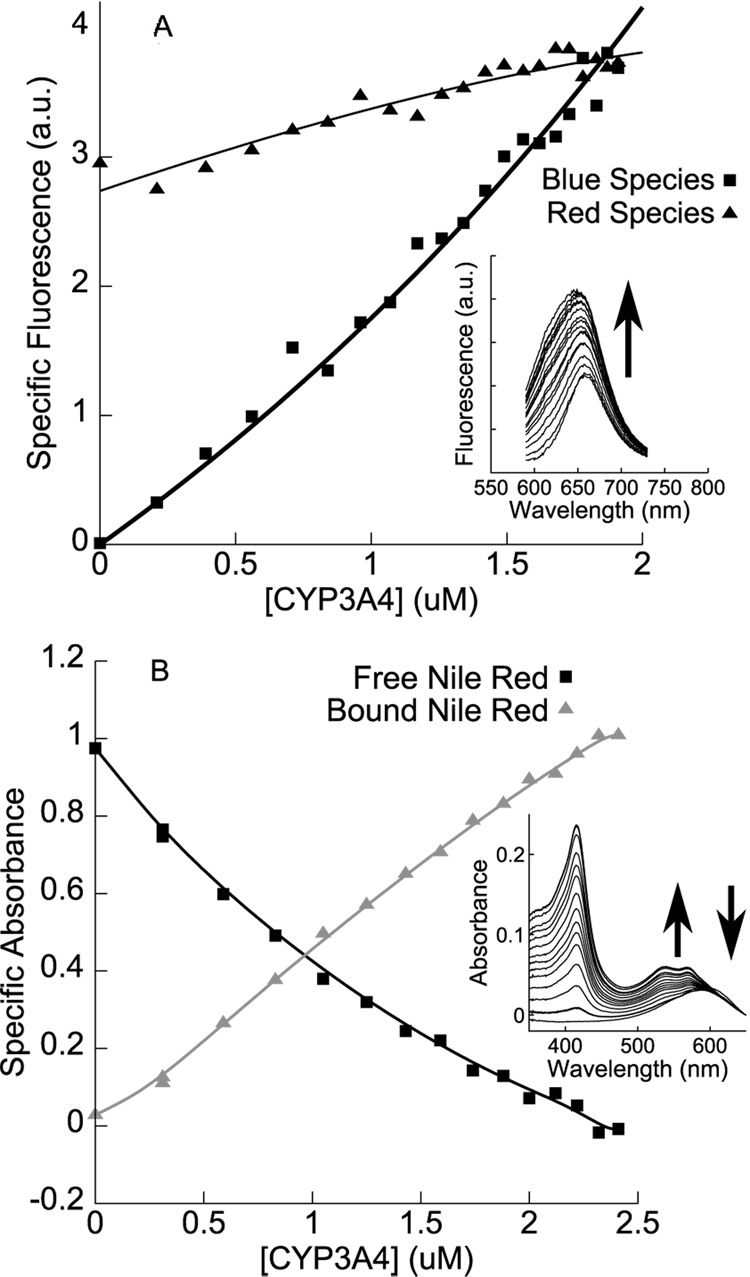
Fluorescence data from reverse titrations of CYP3A4 into fixed concentrations of Nile Red (Figure 4A) show an increase in both blue and red species, qualitatively confirming that both species represent Nile Red bound to CYP3A4. The experimental design distinguishes between a single site yielding the blue emission vs. multiple sites that include a blue emission and a component overlapping the free Nile Red emission. If only a single site existed, then at low concentrations of protein, the blue emission would increase at the expense of the red emission, which would decrease if it reflected only free Nile Red emission. Instead, both the blue and the red components increase, even at low stoichiometry of Nile Red/Protein. Absorbance reverse titrations (Figure 4B) also show that Nile Red absorbance is blue-shifted upon binding to CYP3A4 in a concentration-dependent manner: this may be evidence of the formation of a ground-state dye complex, or may simply represent the effect of the protein environment on Nile Red dynamics. In the absorbance reverse titration (Fig 4B), the free Nile Red is clearly distinguishable from the bound, and it decreases as protein is titrated into the sample, over the same concentration range that yields an increase in the red fluorescence species of Fig. 4A. This combination of results suggests that the red emission is not due only to free Nile Red. The fluorescence and absorbance reverse titration data are consistent with the models used to fit the data in Figure 1 and the optical spin-state data, but unfortunately, experimental considerations (specifically, protein solubility and background fluorescence) make quantitative deconvolution difficult. Consequently, fits to these data are highly overparametrized and do not provide useful information as to the affinity of Nile Red binding wtCYP3A4.
Figure 4.
A. Fluorescence-monitored reverse titration of CYP3A4 into a fixed (10 µM) concentration of Nile Red, with an increase in the fluorescence of both red and blue species confirming the binding of multiple Nile Red molecules to a single molecule of CYP3A4. (Solid lines are guides to the eye.) B. Absorbance-monitored reverse titration under similar conditions, showing the blue-shift of Nile Red absorbance upon binding to CYP3A4. Specific absorbance isotherms were generated by spectral deconvolution, using as basis spectra CYP3A4 absorbance spectra in high-spin and low-spin states, the absorbance spectrum of 10 µM Nile Red in buffer, and the residual between the aforementioned three bases and the last spectrum of the titration (taken to represent ‘bound Nile Red’). Only isotherms for free and bound Nile Red are shown. Solid lines are guides to the eye.
Taken together, the data presented in Figure 1–Figure 4 strongly suggest that at least two molecules of Nile Red can bind wtCYP3A4. The higher-affinity binding site (KD = 0.05 µM – 0.32 µM) has a minor effect on the heme spin-state equilibrium and results in a singly occupied CYP3A4•Nile Red complex, while the second lower-affinity binding event (KD = 2.2 µM – 2.3 µM) is responsible for the majority of the ligand-induced spin shift, and results in a doubly-occupied NR•CYP3A4•NR complex with a dramatically red-shifted and enhanced fluorescence. Although a red-shift in Nile Red fluorescence is typically associated with partial quenching in more polar environments, a red-shift coupled with an increase in fluorescence has been observed in constrained Nile Red complexes in sol-gel glasses [33]. An exciting possibility is that the dramatic change in optical properties between the singly- and doubly-occupied complexes may provide information on the relative orientation and proximity of multiple Nile Red molecules simultaneously bound to CYP3A4. Several published studies have related similar behavior (red-shift coupled with increased quantum yields) to dye-complex geometries for cyanine dyes and porphyrins [34–37].
Effectors Compete with the ‘Red’ Species
Two well established heterotropic effectors of CYP3A4 include α-napthoflavone (ANF) and testosterone (TST). Crystallographic analyses of TST, and its congener progesterone, indicate that these ligands bind with highest affinity at a surface site on CYP3A4, distinct from the active site to which they bind with lower affinity. Furthermore, there is potential for communication between this site and the active site via the F-G region, which provides a ‘wall’ between the surface and active sites, wherein conformational rearrangement of the wall may control access to the active site. In addition to the crystallographic results, spectroscopic studies and energetic analyses [11, 38] of the ligand-dependent spin equilibrium suggest that TST and ANF populate a high affinity site that is not tightly coupled to the spin equilibrium, followed by a lower affinity site that induces a larger spin state change. Together, the available data suggest that TST and ANF bind with highest affinity to a site other than the active site, and we have suggested that ANF binds to the TST/progesterone site. The behavior of both effectors closely parallels our proposed model for Nile Red binding. In order to determine whether Nile Red also binds to the same high-affinity site as ANF and TST, a preformed complex of NR•CYP3A4•NR was titrated separately with either ANF (Figure 5) or TST (Figure 6).
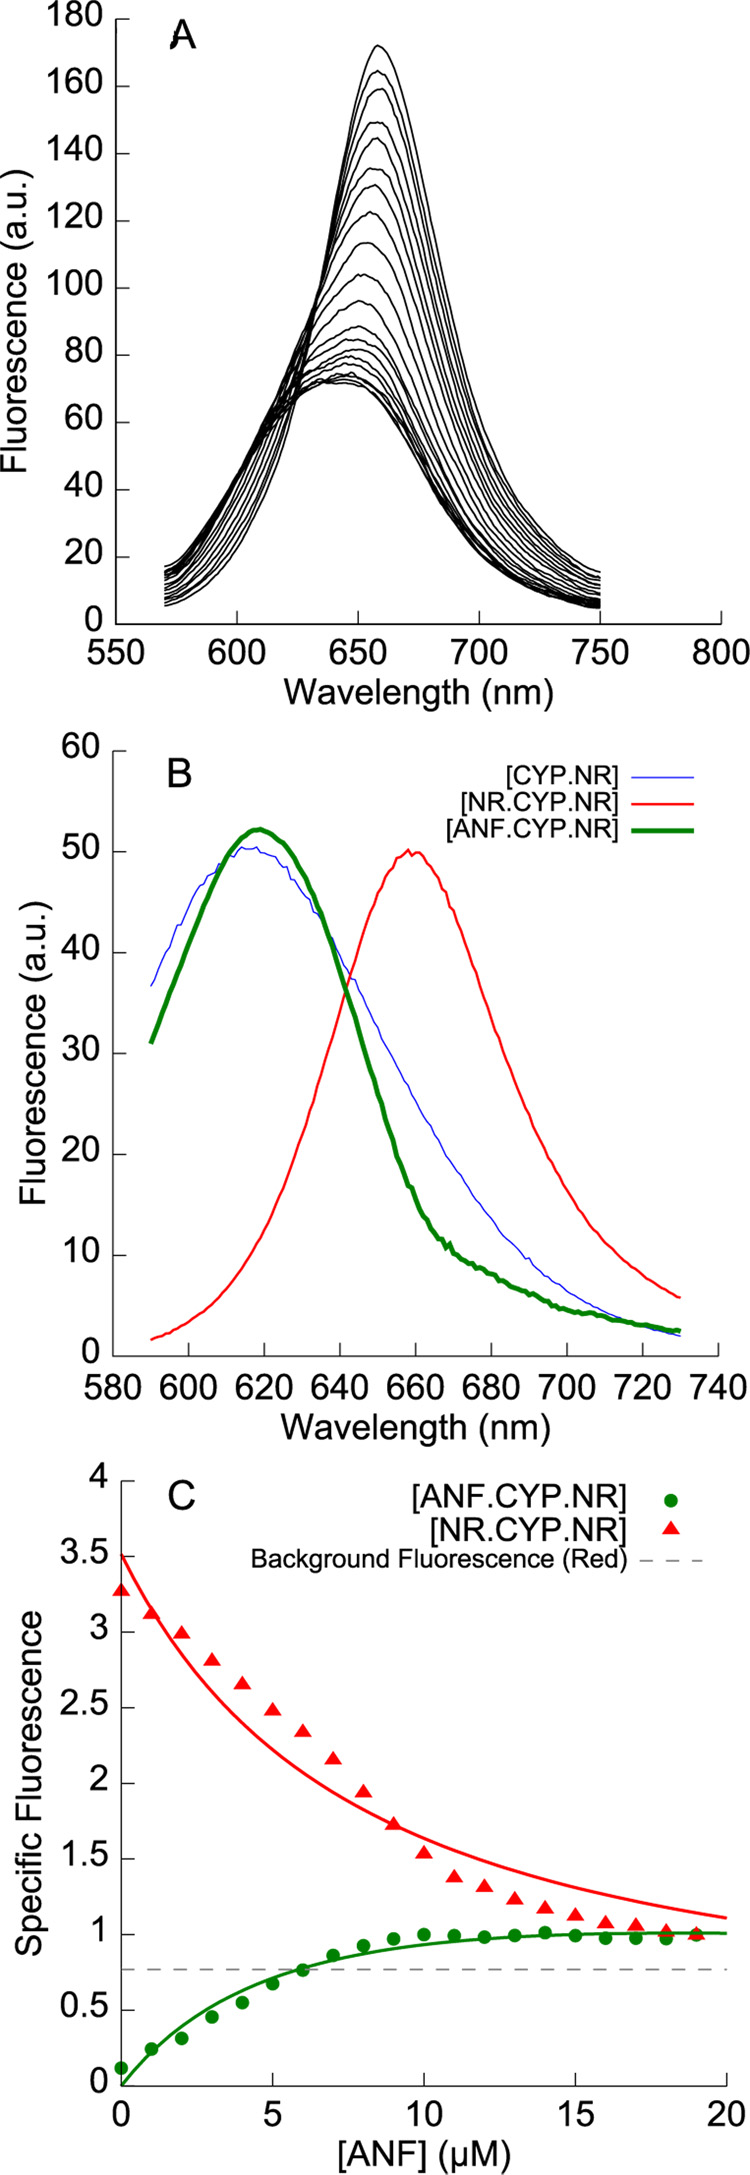
Figure 5.
A. Fluorescence emission spectra when α-naphthoflavone (0 to 19 µM) is titrated into a preformed complex of 1 µM CYP3A4 and 5 µM Nile Red. ANF displaces one molecule of Nile Red from NR•CYP3A4•NR, to form a mixed ANF•CYP3A4•NR complex. B. The basis spectrum for ANF•CYP3A4•NR (green line) shows a blue-shifted species with a markedly sharper emission peak than CYP3A4•NR. C. Deconvolution of the data in A showing the decrease in NR•CYP3A4•NR and the increase in ANF•CYP3A4•NR, fit to a model (solid lines) where ANF and Nile Red compete for a high-affinity effector site.
Figure 6.
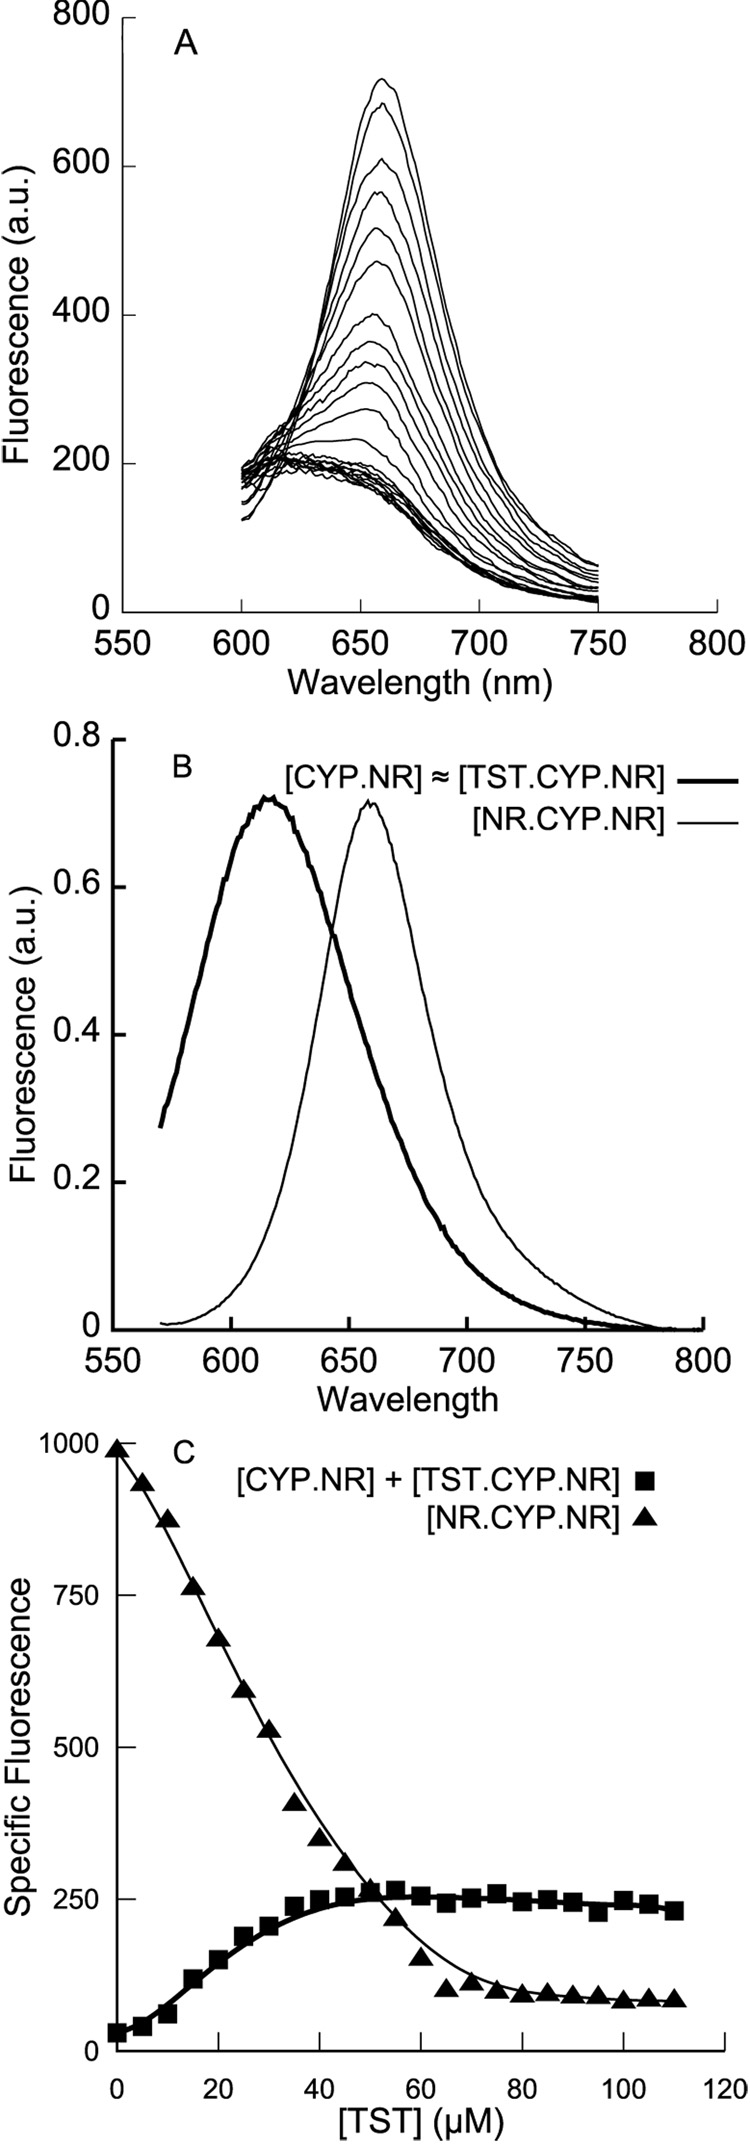
A. Fluorescence emission spectra when testosterone (0 to 110 µM) is titrated into a preformed complex of 1 µM CYP3A4 and 3 µM Nile Red. A decrease in red specific fluorescence is coupled with an increase in blue specific fluorescence. B. The putative TST•CYP3A4•NR heterocomplex is spectrally indistinguishable from CYP3A4•NR, and so spectral deconvolution was performed using the same two basis spectra as shown in Figure 3A. C. Deconvolution of the data in A shows that the apparent KD is in the 20 to 40 µM range, but the two-site competitive model proposed for ANF does not adequately fit these data. Since at least three TST molecules are known to bind CYP3A4 in this concentration regime, the additional complexity may be due to quaternary complexes of CYP3A4 and three ligand molecules. Fits of such complex models to the data in A are overparametrized, and cannot be meaningfully compared; solid lines are shown solely as guides to the eye.
When ANF was titrated into a mixture of 1 µM CYP3A4 and 5 µM Nile Red (Figure 5A), a decrease in the red-shifted fluorescence (representing NR•CYP3A4•NR) was coupled with an increase in blue-shifted fluorescence (presumably due to the ANF•CYP3A4•NR mixed complex). Remarkably, the blue-shifted spectrum of the putative ANF•CYP3A4•NR species differs from the spectrum of the singly-occupied CYP3A4•NR complex: it has a markedly narrower peak shape, and is also slightly red-shifted (Figure 5B). This suggests that the changes in Nile Red’s photophysical properties can be used to study the changes in CYP3A4 structure and dynamics induced by effector binding.
The isotherms obtained from spectral deconvolution are displayed in Figure 5C, along with fits to a model of the heterotropic interactions between ANF and Nile Red. We have previously proposed a two-site sequential model for ANF binding to CYP3A4, with KDs of 1 µM and 55 µM [38]. Global fits (R2 = 0.97) of both isotherms in Figure 5C using these values for ANF binding, and the previously determined KDs for Nile Red, yielded a KD of 2.2 ± 0.19 µM for the binding of ANF to the CYP3A4•NR complex. The similarity of this value to the high-affinity KD for ANF suggests that the initial (high-affinity) Nile Red binding site does not overlap with the peripheral effector site observed for ANF.
The effect of TST on the fluorescence of a preformed complex of 1 µM CYP3A4 and 3 µM Nile Red was qualitatively similar to that of ANF: a decrease in the red NR•CYP3A4•NR species coupled with an increase in a blue species that presumably represents TST•CYP3A4•NR. The spectrum of the latter species closely matches CYP3A4•NR, in contrast to the ANF•CYP3A4•NR heterocomplex. This suggests that ANF and TST, although both effectors of CYP3A4, may have differential effects on CYP3A4 structure and dynamics as probed by Nile Red fluorescence.
The isotherms for the TST competition experiment are not well-fit by the two-site model employed above for ANF. Given that three at least TST molecules are known to bind CYP3A4 simultaneously with sequential KDs of ~20 µM, ~40 µM and ~60 µM [39], the additional complexity is possibly due to quarternary complexes of CYP3A4 and three ligand molecules. Steady-state fluorescence data are insufficient to resolve this complexity; future studies incorporating data from turnover kinetics and other experiments will be necessary to understand this system. Nonetheless, the fact that the apparent KD for both isotherms is in the 20 to 40 µM range suggests that high-affinity Nile Red binding may not compete with the highest-affinity binding observed for TST (KD ≈ 20 µM) [11, 39].
Summary
This work extends the previous demonstration that Nile Red is a substrate for CYP3A4, and provides the important new information that multiple Nile Red molecules bound to CYP3A4 simultaneously can be resolved spectrally on the basis of their fluorescence properties. Fluorescence spectroscopy has been successfully exploited by several labs to probe the various putative binding sites of CYP3A4 [10, 12, 16, 17, 22, 40]. Some studies have utilized heme-dependent quenching of fluorophores to measure ligand binding and to monitor putative conformational changes [22, 23]. Here, we utilize the unquenched fluorescence of Nile Red to resolve multiple sites. The distinct photophysical properties of the NR•CYP3A4•NR may ultimately shed light on the relative orientation and proximity of multiple ligands bound to CYP3A4.
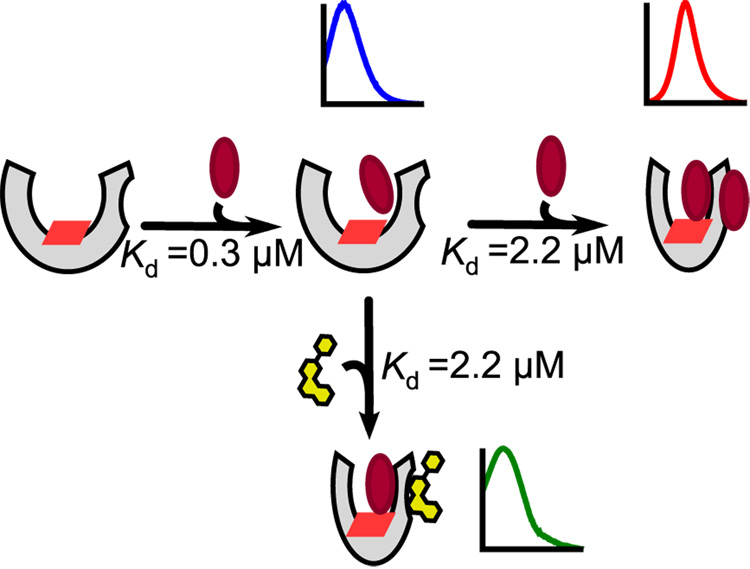
Moreover, the clear competition observed spectrally between ANF or TST with the ‘Red Site’ for Nile Red suggests that each of these ligands binds at the same location, although we can not rule out the possibility that conformational changes induced by TST or ANF could quench the red species. A simple model consistent with the observed competitive behavior is presented in Figure 7: Nile Red binds with high affinity to the CYP3A4 active site; lower-affinity binding of a second Nile Red molecule at a peripheral effector binding site induces a conformational change that increases the accessibility of the active-site Nile Red molecule to the heme-iron center and thereby induces a significant spin-shift. In contrast, effector molecules such as ANF and TST bind with higher affinity to the peripheral site than to the active site. Such effectors can displace the peripheral Nile Red molecule and form a mixed ternary complex with CYP3A4 and active-site Nile Red. Perhaps most exciting is the observation that ANF and TST, two qualitatively similar CYP3A4 effectors, form ternary heterocomplexes with Nile Red that are clearly spectrally distinct. This suggests that Nile Red is a highly sensitive fluorimetric probe of the changes in the CYP3A4 active site environment inducedby different effectors.
Figure 7.
Proposed model for Nile Red allosterism. Nile Red (maroon ellipse) binds with high affinity to the active site. Lower-affinity binding of a second Nile Red molecule at a peripheral effector binding site induces a conformational change that increases the accessibility of the active-site Nile Red molecule to the heme-iron center (red parallelogram). In contrast, effector molecules such as ANF (yellow) bind with higher affinity to the peripheral site, and can form a mixed ternary complex with CYP3A4 and Nile Red; the photophysical properties of Nile Red may provide insight into the nature of this mixed complex for different effectors.
ACKNOWLEDGEMENTS
We thank Matt Honaker for assistance with CYP3A4 expression and purification.
TEL: (206) 685-0379; FAX: (206) 685-3252; this work was supported by NIH grants GM32165 (WMA) and GM07750 (JNL).
ABBREVIATIONS
- AIC
Akaike Information Criterion
- ANF
alpha-napthoflavone
- CYP
cytochrome P450
- EDTA
ethylene diamine tetra-acetic acid
- GSH
glutathione
- ITZ
itraconazole
- KTZ
ketoconazole
- MS
mass spectral
- NADPH
nicotinamide adenine dinucleotide phosphate
- SVD
singular value decomposition
- TNS
2-p-toluidinylnapthalene-6-sulfonic acid
- TST
testosterone
- UV-vis
ultraviolet-visible
Footnotes
Publisher's Disclaimer: This is a PDF file of an unedited manuscript that has been accepted for publication. As a service to our customers we are providing this early version of the manuscript. The manuscript will undergo copyediting, typesetting, and review of the resulting proof before it is published in its final citable form. Please note that during the production process errors may be discovered which could affect the content, and all legal disclaimers that apply to the journal pertain.
References
- 1.Ortiz De Montellano PR. Cytochrome P450: Structure, Mechanism, and Biochemistry. New York: Kluwer Academic/Plenum Publishers; 2005. [Google Scholar]
- 2.Guengerich FP. Nat Rev Drug Discov. 2002;1:359–366. doi: 10.1038/nrd792. [DOI] [PubMed] [Google Scholar]
- 3.Verras A, Ortiz De Montellano PR. Biochem Soc Trans. 2006;34:1170–1172. doi: 10.1042/BST0341170. [DOI] [PubMed] [Google Scholar]
- 4.Johnson EF, Stout CD. Biochem Biophys Res Commun. 2005;338:331–336. doi: 10.1016/j.bbrc.2005.08.190. [DOI] [PubMed] [Google Scholar]
- 5.Guengerich FP. Aaps J. 2006;8:E101–E111. doi: 10.1208/aapsj080112. [DOI] [PMC free article] [PubMed] [Google Scholar]
- 6.Atkins WM. Annu Rev Pharmacol Toxicol. 2005;45:291–310. doi: 10.1146/annurev.pharmtox.45.120403.100004. [DOI] [PubMed] [Google Scholar]
- 7.Shou M. Drug Discov Today. 2004;9:636–637. doi: 10.1016/S1359-6446(04)03132-0. [DOI] [PubMed] [Google Scholar]
- 8.Shou M, et al. Biochemistry. 1994;33:6450–6455. doi: 10.1021/bi00187a009. [DOI] [PubMed] [Google Scholar]
- 9.Korzekwa KR, et al. Biochemistry. 1998;37:4137–4147. doi: 10.1021/bi9715627. [DOI] [PubMed] [Google Scholar]
- 10.Lampe JN, Atkins WM. Biochemistry. 2006;45:12204–12215. doi: 10.1021/bi060083h. [DOI] [PubMed] [Google Scholar]
- 11.Roberts AG, Campbell AP, Atkins WM. Biochemistry. 2005;44:1353–1366. doi: 10.1021/bi0481390. [DOI] [PubMed] [Google Scholar]
- 12.Tsalkova TN, et al. Biochemistry. 2007;46:106–119. doi: 10.1021/bi061944p. [DOI] [PMC free article] [PubMed] [Google Scholar]
- 13.Isin EM, Guengerich FP. J Biol Chem. 2006;281:9127–9136. doi: 10.1074/jbc.M511375200. [DOI] [PubMed] [Google Scholar]
- 14.Shou M, et al. J Biol Chem. 2001;276:2256–2262. doi: 10.1074/jbc.M008799200. [DOI] [PubMed] [Google Scholar]
- 15.Denisov IG, et al. J Biol Chem. 2007 [Google Scholar]
- 16.Dabrowski MJ, et al. J Am Chem Soc. 2002;124:11866–11867. doi: 10.1021/ja027552x. [DOI] [PubMed] [Google Scholar]
- 17.Khan KK, Liu H, Halpert JR. Drug Metabolism and Disposition. 2003;31:356–359. doi: 10.1124/dmd.31.4.356. [DOI] [PubMed] [Google Scholar]
- 18.Ekroos M, Sjogren T. Proc Natl Acad Sci U S A. 2006;103:13682–13687. doi: 10.1073/pnas.0603236103. [DOI] [PMC free article] [PubMed] [Google Scholar]
- 19.Koley AP, et al. J Biol Chem. 1995;270:5014–5018. doi: 10.1074/jbc.270.10.5014. [DOI] [PubMed] [Google Scholar]
- 20.Davydov DR, et al. Biochem Biophys Res Commun. 2003;312:121–130. doi: 10.1016/j.bbrc.2003.09.247. [DOI] [PubMed] [Google Scholar]
- 21.Lampe JN, et al. Biochemistry. 2007 [Google Scholar]
- 22.Fernando H, Halpert JR, Davydov DR. Biochemistry. 2006;45:4199–4209. doi: 10.1021/bi052491b. [DOI] [PMC free article] [PubMed] [Google Scholar]
- 23.Stortelder A, et al. Biochem J. 2006;393:635–643. doi: 10.1042/BJ20051169. [DOI] [PMC free article] [PubMed] [Google Scholar]
- 24.Harlow GR, Halpert JR. Proc Natl Acad Sci U S A. 1998;95:6636–6641. doi: 10.1073/pnas.95.12.6636. [DOI] [PMC free article] [PubMed] [Google Scholar]
- 25.Omura T, Sato R. J Biol Chem. 1962;237:1375–1376. [PubMed] [Google Scholar]
- 26.Jones E, Oliphant T, Peterson P, et al. SciPy: Open Source Scientific Tools for Python. 2001 [Google Scholar]
- 27.Mendes P. Comput Appl Biosci. 1993;9:563–571. doi: 10.1093/bioinformatics/9.5.563. [DOI] [PubMed] [Google Scholar]
- 28.Mendes P. Trends Biochem Sci. 1997;22:361–363. doi: 10.1016/s0968-0004(97)01103-1. [DOI] [PubMed] [Google Scholar]
- 29.Mendes P, Kell D. Bioinformatics. 1998;14:869–883. doi: 10.1093/bioinformatics/14.10.869. [DOI] [PubMed] [Google Scholar]
- 30.He YA, Roussel F, Halpert JR. Arch Biochem Biophys. 2003;409:92–101. doi: 10.1016/s0003-9861(02)00484-8. [DOI] [PubMed] [Google Scholar]
- 31.Williams PA, et al. Science. 2004;305:683–686. doi: 10.1126/science.1099736. [DOI] [PubMed] [Google Scholar]
- 32.Hendler RW, Shrager RI. J Biochem Biophys Methods. 1994;28:1–33. doi: 10.1016/0165-022x(94)90061-2. [DOI] [PubMed] [Google Scholar]
- 33.Ferrer ML, Del Monte F. J Phys Chem B. 2005;109:80–86. doi: 10.1021/jp047550u. [DOI] [PubMed] [Google Scholar]
- 34.Tanaka H, Mizutani T, Kuroda S-I. Colloids and Surfaces A: Physicochemical and Engineering Aspects. A selection of papers from the 11th International Conference on Organized Molecular Films (LB11); June 26–30, 2005; Sapporo. 2006. pp. 97–102. [Google Scholar]
- 35.Achyuthan KE, et al. Photochem Photobiol Sci. 2006;5:931–937. doi: 10.1039/b607884m. [DOI] [PubMed] [Google Scholar]
- 36.Zhang Y, et al. Biophys Chem. 2007;128:197–203. doi: 10.1016/j.bpc.2007.04.002. [DOI] [PubMed] [Google Scholar]
- 37.Andrade SM, et al. Biophys Chem. 2007 [Google Scholar]
- 38.Roberts AG, Atkins WM. Arch Biochem Biophys. 2007;463:89–101. doi: 10.1016/j.abb.2007.03.006. [DOI] [PMC free article] [PubMed] [Google Scholar]
- 39.Denisov IG, et al. J Biol Chem. 2007;282:7066–7076. doi: 10.1074/jbc.M609589200. [DOI] [PubMed] [Google Scholar]
- 40.Hungerford G, Rei A, Ferreira MI. Febs J. 2005;272:6161–6169. doi: 10.1111/j.1742-4658.2005.05019.x. [DOI] [PubMed] [Google Scholar]


