

Abstract
During development axon outgrowth and branching are independently regulated such that axons can stall or retract while their interstitial branches extend toward targets. Previous studies have shown that guidance cues and intracellular signaling components can promote branching of cortical axons without affecting axon outgrowth. However, the mechanisms that regulate differential outgrowth of axons and their branches are not well understood. Based on our previous work showing the importance of localized repetitive calcium transients in netrin-1-induced cortical axon branching, we sought to investigate the role of calcium signaling in regulating differential outgrowth of axons and their branches. Using fluorescence calcium imaging of dissociated developing cortical neurons, we show that localized spontaneous calcium transients of different frequencies occur in restricted regions of axons and their branches. Higher frequencies occur in more rapidly extending processes whereas lower frequencies occur in processes that stall or retract. Direct induction of localized calcium transients with photolysis of caged calcium induced rapid outgrowth of axonal processes. Surprisingly outgrowth of one axonal process was almost invariably accompanied by simultaneous retraction of another process belonging to the same axon, suggesting a competitive mechanism for differential process outgrowth. Conversely, reducing frequencies of calcium transients with nifedipine and TTX reduced the incidence of differential process outgrowth. Together these results suggest a novel activity-dependent mechanism whereby intrinsic localized calcium transients regulate the competitive growth of axons and their branches. These mechanisms may also be important for the development of cortical connectivity in vivo.
Keywords: calcium signaling, axon outgrowth, axon branching, cortical development, calcium imaging, neural activity
Introduction
In vivo (Bastmeyer and O'Leary, 1996; Portera-Cailliau et al., 2005; Meyer and Smith, 2006) and in vitro (Ruthel and Hollenbeck, 2000; Dent et al., 2004), the outgrowth of axons and the extension of branches are independently regulated such that branches can extend while their axons stall or retract (Luo and O'Leary, 2005). However, the mechanisms whereby axons and their branches can have differential rates of outgrowth are unknown. Calcium has been shown to have varying effects on axon outgrowth and guidance (Henley and Poo, 2004; Gomez and Zheng, 2006). In most cases, calcium activity was measured in the axon or the growth cone and levels of intracellular Ca2+ were found to be inversely correlated with rates of axon outgrowth (Gomez and Spitzer, 1999; Tang et al., 2003; Jacques-Fricke et al., 2006) or changes in the direction of axon growth (Nishiyama et al., 2003; Henley et al., 2004; Wen et al., 2004). In previous studies, we found that global Ca2+ transients inhibited extension of the primary axon (Tang et al., 2003), whereas localized Ca2+ transients evoked by netrin-1 signaling could promote branching of the axon in regions of high-frequency Ca2+ transients (Tang and Kalil, 2005). It has been well established that competitive activity-dependent mechanisms can regulate synaptic innervation at target sites. The competition among neighboring axon arbors for synaptic space was shown previously to favor arbors with higher levels of neural activity (Hua and Smith, 2005). Because electrical activity is reflected by changes in intracellular Ca2+ (Spitzer, 2006), we hypothesized that differences in Ca2+ levels could also be a mechanism for regulating the differential growth of axons and their branches.
However, competitive mechanisms for growth of axons and collateral branches of the same axon have been little studied. Previous studies of trophic factor-mediated axon growth (Goldberg et al., 2002; Singh and Miller, 2005) showed that electrical activity enhanced axon outgrowth. In populations of sympathetic neurons grown in divided chambers axons depolarized experimentally with KCl in one chamber extended longer axons at the expense of their unstimulated branches in another chamber (Singh and Miller, 2005). However, it was not known whether a developing neuron could spontaneously exhibit different levels of activity in axon branches belonging to the same axon. To address this question, we asked whether dissociated cortical neurons could express differential Ca2+ activity in axons versus branches. Imaging Ca2+ activity in isolated neurons permitted us to obtain accurate measurements of frequencies of Ca2+ activity. Importantly we were able to correlate differences in frequencies of Ca2+ transients with differential outgrowth of axons and their branches. A further advantage of this approach was the ability to impose Ca2+ transients of specific frequencies with photolysis of caged calcium to restricted regions of axons and branches. Here we show that differential frequencies of Ca2+ transients in a cortical axon and its branch favor the growth of the process with higher-frequency transients while at the same time the process with lower frequency transients is actively retracted. These results suggest a competitive mechanism whereby higher-frequency Ca2+ activity in one axonal process promotes its extension at the expense of another process of lower Ca2+ activity that stalls or retracts.
Materials and Methods
Cell culture.
Primary cortical neurons were prepared from the sensorimotor cortex of postnatal day 0 (P0)–P3 Syrian hamster pups as described previously (Dent and Kalil, 2003). Primary neurons were dissociated and plated onto acid-etched coverslips coated with 0.5 mg/ml poly-d-lysine (Sigma, St. Louis, MO) or 2.5 μg/cm2 fibronectin (Sigma; photolysis experiments only) at a density of 1- to 3-k cells/cm2. Cultures were then incubated in 5% CO2 and 9% O2 at 37°C for 24–48 h until imaging.
Experimental reagents.
Stock solutions were prepared by dissolving drugs in water or dimethyl sulfoxide (DMSO) according to the recommendations of the manufacturer. Stock solutions were then diluted into serum-free medium and bath applied to cultures, with the exception of netrin-1, which was locally applied. The following drugs were used to modulate calcium activity: L-type voltage-gated calcium channel inhibitor nifedipine (10 μm; Calbiochem, La Jolla, CA) and activator BayK 8644 (BayK; 20 μm; Alomone Labs, Jerusalem, Israel), recombinant chicken protein netrin-1 (25 μg/ml; R&D Systems, Minneapolis, MN), voltage-gated sodium channel inhibitor tetrodotoxin (TTX; 1 μm; Calbiochem), and caged calcium o-nitrophenyl (NP)-EGTA AM (4 μm; Invitrogen, Eugene, OR).
Measurements of calcium activity.
Calcium imaging and analysis were performed as previously described (Tang et al., 2003; Tang and Kalil, 2005). Briefly, 18–72 h after plating cell cultures were loaded with 4 μm Fluo4 AM (Invitrogen) for 30 min. After loading, the medium was changed and cultures were allowed to recover for 30 min in the incubator before imaging. Under these conditions, Fluo-4 brightly labeled every cell examined. Fluorescence time-lapse images were taken every 5–10 s with a Princeton Instruments (Trenton, NJ) MicroMax 512 BFT cooled CCD camera mounted on an inverted Nikon (Tokyo, Japan) TE300 epifluorescence microscope while cultures were maintained at 37°C with an incubator blower. Images were acquired and binned under low light conditions, increasing the sensitivity of the camera while maintaining low levels of background noise. Image acquisition and analysis were performed with MetaMorph image processing software (Molecular Devices, Union City, CA).
Calcium activity was measured as the average fluorescence pixel intensity (F) in an axon region divided by the baseline fluorescence in that region (F0). Background fluorescence was measured frame-by-frame in an empty region of the viewing field and was subtracted from measurements of fluorescence intensity. To minimize the effects of any morphological changes that could affect fluorescence measurements through changes in volume, the baseline (F0) was calculated as a shifting average of the fluorescence intensity over a 5-min window. Calcium transients were defined as fluorescence signals (F/F0) that exceed 150% of the baseline fluorescence, which were confirmed by frame-by-frame analysis of the time-lapse images. To ensure that random fluctuations were not counted as calcium transients we included a requirement that the peak amplitude of transients be at least 2 SDs from baseline. To measure the spatial extent of localized calcium transients, the background-subtracted fluorescence image (F) was divided by an average of the frames preceding the localized calcium event (F0) and borders were defined as the points where the signal (F/F0) dropped to 110%. If the signal did not drop to 110% before reaching a branch point the localized calcium transient was considered to encompass the entire branch and was not included in the analysis of length of localized calcium transients. Calcium signals with no localization to an axonal process or region of an axonal process were considered to be global, although it was not always possible to image the entire neuron in the same field of view to confirm the global nature of the calcium transient.
For ratiometric experiments, cultures were loaded with 4 μm Fluo4 AM and 250 nm volumetric indicator Calcein Red/Orange (Invitrogen) for 30 min. Fluorescence images of Calcein Red/Orange were acquired immediately after each frame of Fluo-4 fluorescence. Ratiometric measurements (R) were obtained by dividing the Fluo-4 fluorescence value by the fluorescence value of Calcein Red/Orange. Frame-by-frame background subtraction was performed for each indicator as described above. Calcium signals (R/R0) were then measured as the percentage change from a shifting average baseline (R0) of the ratiometric measurements as described above for nonratiometric measurements.
After imaging, the frequency and amplitude of calcium transients in a region of each axon process were measured and analyzed with computer algorithms in Microsoft (Redmond, WA) Excel. Regions in each axonal process were chosen around the areas of maximal calcium activity and did not change throughout the imaging session. Relative frequencies of calcium transients expressed in two branches of the same axon were calculated as the frequency of calcium transients in the process of interest divided by the sum of the frequencies of calcium transients in each process. This ratio of calcium activity was then correlated with the rate of outgrowth for each process.
Measurements of rates of process outgrowth.
Outgrowth rates were measured as the difference in axon or branch length between differential interference contrast (DIC) or phase-contrast images acquired at the beginning and end of the imaging session, divided by the duration of the imaging session. For short term experiments DIC images were acquired immediately before and after calcium imaging. For long term BayK 8644 and silencing experiments phase contrast images were acquired on a Zeiss (Thornwood, NY) Axiovert 35M inverted microscope with a 20× objective. Drugs were applied after 24–48 h in vitro, and axon and branch length were recorded at the beginning and end of the drug treatment, which lasted up to 24 h. For quantification of differential outgrowth in BayK and silencing experiments, differences in outgrowth rates of axons and their branches were considered significant if the magnitude of the difference in outgrowth rates was at least twice the average rate of outgrowth for that experiment. Only isolated neurons, that had a branched axon at least twice as long as the next longest primary neurite, were selected for imaging and analysis. Processes longer than 20 μm extending from the axon were considered branches.
Local application of netrin-1.
Local application of netrin-1 was performed as described previously (Tang and Kalil, 2005). Briefly, pulled pipettes with 0.5–1 μm tips connected to an Eppendorf (Hamburg, Germany) microinjection system were loaded with 25 μg/ml stock solution of netrin-1 and positioned nearby (10–20 μm) axons or branches. Netrin was puffed out of the pipettes by a pressure of 20–40 kPa every second for imaging periods up to an hour. Calcium activity was measured during local application of netrin-1 and outgrowth of existing and de novo branches was measured from DIC images as described above.
Caged calcium experiments.
Neurons were loaded with 4 μm NP-EGTA AM for 30 min, then rinsed and allowed to recover for 30 min before imaging. Caged calcium was released by photolysis of NP-EGTA with 360 nm UV light from a 100 W mercury lamp filtered to 25% intensity with a neutral density filter. The size of the exposed region was restricted to a column of light up to 50 μm in diameter by placing a pinhole aperture in the light path. A programmable Uniblitz (Rochester, NY) shutter controlled opening and closing of the shutter, exposing a region of the axon up to 50 μm in diameter to a UV light pulse 200 ms in duration. To confirm that photolysis of NP-EGTA increased calcium activity some cultures were coloaded with NP-EGTA and Fluo-4, and calcium activity was measured concurrently with photolysis on an Olympus (Center Valley, PA) Fluoview 500 laser-scanning confocal system mounted on an AX-70 upright microscope with a 40× fluorite objective. Outgrowth was measured from DIC images as described above. Control neurons were exposed to UV light without loading with NP-EGTA. To acquire higher-resolution DIC images, additional experiments were performed on the inverted Nikon TE300 epifluorescence system. No significant differences in response to photolysis of caged calcium were observed between these two systems. However, because simultaneous calcium imaging during photolysis to measure the size of evoked calcium transients could not be performed on the Nikon system, these additional experiments were omitted from the quantifications of outgrowth.
Statistical analysis and image processing.
Graphs and statistical analysis were performed with GraphPad (San Diego, CA) Prism statistical analysis software. Unless otherwise noted, comparisons between two groups were made with Student's t test and comparisons between multiple groups were made with a one-way ANOVA with Tukey's posttest. Measurements are given in mean ± SEM unless otherwise noted. The DIC images presented in figures were enhanced with a high-pass filter and brightness-contrast adjustments in Adobe (Mountain View, CA) Photoshop. Images representing raw fluorescence data (F) were not modified except to perform background subtraction with an image of background fluorescence taken from an empty field of view. Images representing the change in calcium signal (F/F0 and R/R0, as described above) were additionally passed through a 2 × 2 low-pass filter in MetaMorph to reduce single-pixel noise. Supplemental time-lapse images (available at www.jneurosci.org as supplemental material) were assembled into Apple (Cupertino, CA) QuickTime movies with Adobe Premiere software.
Results
Localized Ca2+ transients of different frequencies can occur in axons and their branches
Cortical neurons exhibit calcium transients that are either global or localized (Tang et al., 2003; Tang and Kalil, 2005). Previously, we found that global transients were characterized by spontaneous fluctuations in levels of Ca2+ that appeared instantaneously throughout the entire neuron and occurred at frequencies averaging ∼1 transient per minute. In the present study we found spontaneous localized Ca2+ transients that were typically confined to a region of the axon or to a branch or were expressed alternately in the primary axon and a branch (Fig. 1). Here we were able to measure localized Ca2+ transients confined to regions of the axon or a branch as small as 20 μm in length (Fig. 1A,B). To define the borders of the localized calcium transients we adopted the criterion that the amplitude of the localized calcium signal was 110% of the baseline fluorescence (see Materials and Methods). Localized regions of calcium activity in the axon or branch averaged 45.8 ± 4 μm (mean ± SEM, n = 24), a measurement that excluded localized transients encompassing an entire branch.
Figure 1.

Localized calcium transients occur in restricted regions of primary axons or their collateral branches. A, DIC image (top left) and fluorescence images of calcium activity (panels labeled F) in a cortical neuron in which calcium transients are localized to the primary axon (time point 9:45) or its collateral branch (time point 7:20). At 1:05, the neuron shows no calcium activity. Arrowheads (black and red) correspond to regions of localized calcium activity. Panels labeled F/F0 correspond to the same images shown above but show the fluorescence change from baseline. Pseudocolor calibration bars for images of raw fluorescence (F) and for fluorescence normalized to baseline (F/F0) are shown at right. The graph (bottom left) shows calcium activity measured in the primary axon (black), branch (red) and cell body (green) during the calcium transients shown in the fluorescence images (7:20, red arrow, 9:45, black arrow). B, DIC image (left) and fluorescence images of localized calcium activity indicated by black arrowheads in the primary axon of a cortical neuron (right panels). As shown in the graph of calcium activity (far right), localized calcium transients occurred only in the primary axon (black), making its average frequency of calcium transients much higher than that of the branch (red). One global calcium transient occurred near the beginning of the imaging session. Calibration bars as in A. C, Both the primary axon (black arrowheads) and branch (red arrowheads) show localized calcium transients but the branch has a higher frequency of calcium transients (graph, right). D, Distribution of total cortical neurons with different types of calcium activity. Pseudocolor scales are the same for all images of raw fluorescence and normalized fluorescence, respectively. Times are given in minutes and seconds. Scale bars, 10 μm.
Measurements of the amplitude of Ca2+ transients based on comparisons between the signal and the baseline (F/F0) are accurate as long as the axonal process does not change shape during the imaging session. Nevertheless, we decided to obtain a more accurate characterization of the amplitudes of localized axonal transients by performing ratiometric imaging with a volumetric marker. As shown in the example in Figure 2B, the axonal branch (white arrowheads) has a region of high Ca2+ activity whose peak amplitude is >200% of baseline, which takes any volumetric changes into account. Importantly, line scans through the axonal areas of interest in five different neurons show that the concentration of Fluo-4 is uniform (Fig. 2A), demonstrating that our measurements of amplitudes of Ca2+ activity are not affected by an uneven distribution of the indicator dye. The area of localized Ca2+ activity (48 μm) is within the average axon length calculated by nonratiometric imaging. These ratiometric measurements therefore validate our criteria for characterizing localized Ca2+ transients and also made it possible to compare the amplitudes of localized and global in different neurons (Fig. 2B,C). Global Ca2+ transients had an average amplitude of 231 ± 4% of baseline whereas amplitudes of localized Ca2+ transients averaged 175 ± 8% of baseline (p < 0.001, t test; n ≥ 6 independent experiments for each condition). It is clear that localized regions do not correspond to microdomains involving the cytoplasm in close proximity to small clusters of calcium channels (Augustine et al., 2003). Measurements of Ca2+ activity in 81 cortical neurons showed that 77% exhibited spontaneous transients. Of these 45% showed localized Ca2+ transients and of these 55% exhibited both local and global transients (Fig. 1D). The remaining 55% of neurons had only global transients.
Figure 2.

Ratiometric imaging controls for differences in cell volume over time and reveals that amplitudes of global calcium transients are larger than those of localized calcium transients. A, Overlay of Fluo-4 (green) and volumetric marker Calcein Red/Orange (red) fluorescence shows uniform loading of both dyes (top). Arrows indicate regions through the axon from which line scans were obtained. Linescans through axonal processes of five neurons (shown below in different colors) during 5 min periods when calcium activity did not change showed that the ratio of fluorescence intensities over the entire axonal process remained constant. B, DIC image (left) and corresponding ratiometric images of calcium activity (R/R0, middle, right) of a cortical neuron at rest (middle, 9:40) and later exhibiting a localized calcium transient (right, 10:00). Arrowheads indicate corresponding positions on DIC and fluorescence images. The pseudocolor calibration bars are shown at right. C, DIC image (left) and ratiometric images of calcium activity (R/R0, right) of a cortical neuron at rest (middle, 5:10) and later exhibiting a global calcium transient (right, 5:55). Scale bars, 10 μm.
As we had noted previously (Tang and Kalil, 2005) netrin-1 evoked Ca2+ transients alternating between two axonal processes could have different frequencies. Because spontaneous Ca2+ transients occurred in localized regions of axons and their branches we asked whether these transients also exhibited different frequencies. We found that calcium transients were not only localized but that in most of these cases neurons exhibited Ca2+ transients of different frequencies in a region of an axon vs a branch or in one branch vs another branch of the same axon. Ca2+ transients were defined as events that exceeded 150% of a shifting average baseline of fluorescence intensity (see Materials and Methods). To distinguish real events from random fluctuations, we also required that the events be 2 SDs from baseline. Of 20 neurons showing spontaneous differential Ca2+ activity in their axons and branches, frequencies ranged from 1.5 to 30/h and averaged 11.1 transients/h. Measurements of frequencies of repetitive localized Ca2+ transients were all made in the same spatial extent of the axon which did not significantly change over time. As shown in Figure 1, B and C, frequencies of localized Ca2+ transients in both neurons differed in their two axonal processes. In the example in Figure 1B, only the process at right (black arrow) showed localized activity whereas the branch at left (red arrow) had no measurable activity (see also supplemental Movie 1, available at www.jneurosci.org as supplemental material). Note that at the beginning of the image sequence a large global Ca2+ transient occurred. In Figure 1C, both the axon and its branch had localized transients which were of different frequencies (6.3 vs 2.1 transients/h).
Differential Ca2+ activity is correlated with differential outgrowth of axons and their branches
To determine whether frequencies of Ca2+ transients were correlated with rates of process outgrowth, we first measured the frequencies of Ca2+ transients in axons with at least one branch that was at least 20 μm in length. Figure 3A shows an example of an axon and a branch each with spontaneous localized Ca2+ transients of a different frequency. During the 30 min imaging period the axon had 8.37 transients/h localized to the region of the growth cone whereas the branch had no localized activity. During the imaging period, there were no global transients. We then compared DIC images taken at the beginning and end of the imaging session to calculate the rate of process outgrowth. The axon tip had advanced 14 μm (28 μm/h), but the branch grew only 1.2 μm during this time period. These results seem to suggest that higher-frequency Ca2+ transients promote process outgrowth. However, additional analysis revealed that the relationship between frequency of Ca2+ transients and process outgrowth was not simply linear (Fig. 3B). Instead, differences in rates of outgrowth between processes of the same axon were dependent on relative differences in their frequencies of Ca2+ transients. In 20 neurons in which localized Ca2+ transients were observed in axons and their branches, we found that, in most cases, the processes with higher-frequency transients were favored for growth (Fig. 3C). In many cases (76%) (Fig. 3C,D) processes with lower-frequency Ca2+ transients actually retracted, suggesting a competitive effect in which the growth of the favored process occurred at the expense of another with lower frequency Ca2+ transients. Moreover, the greatest differences in outgrowth of two different processes of the same axon occurred when differences in frequencies were the highest (Fig. 3D). As shown in Figure 3D, the differences in relative frequency of Ca2+ transients in two axonal processes were proportional to the differences in their rates of outgrowth. Higher growth rates of axonal processes were correlated with higher frequencies of Ca2+ transients regardless of whether the process was an axon or a branch (Fig. 3). Moreover these transients could occur along the shaft or at the growth cone of the axonal process.
Figure 3.

Differential calcium activity correlates with differential outgrowth of cortical axons and their branches. A, DIC images of an axon (black arrowhead) and its branch (white/gray arrowhead) with different levels of spontaneous calcium activity (graphed on right). The primary axon had 8.37 localized transients/h and extended 14 μm whereas the branch had no calcium transients and grew only 1.2 μm. B, Frequencies of calcium transients in individual axonal processes do not correlate absolutely with rates of outgrowth (p > 0.05, one-way ANOVA). C, D, Direct comparisons were made among processes from the same axon to correlate relative differences in calcium activity with differential outgrowth (n = 20 independent experiments). C, Left, Processes with higher frequencies of calcium transients had higher rates of outgrowth, whereas processes with lower frequencies tended to retract (+++p < 0.0001, paired t test; n = 25 comparisons). Right, Processes with faster outgrowth had significantly higher frequencies of calcium transients (+++p < 0.0001, paired t test; n = 28 comparisons). D, Comparison of rates of outgrowth in single axonal processes to their relative frequencies of calcium transients (n = 56). Relative frequencies were calculated as the ratio of the frequency in the process of interest to the frequency in another process from that axon, expressed as a percentage. Processes with the highest relative frequencies had the highest rates of outgrowth whereas processes with the lowest relative frequencies had the highest rates of retraction (*p < 0.05, ANOVA on ranks with Dunn's post-test). Scale bar, 10 μm.
Because global Ca2+ transients often occurred during the same sequences in which localized transients were measured, it was important to determine whether global transients also contributed to differential process outgrowth. In neurons that exhibited only global transients (n = 20), differences in rates of growth for two processes of the same axon were relatively small compared with differences in rates of growth for processes that had localized Ca2+ transients of different frequencies (4.8 ± 1.4 μm/h vs 10.9 ± 2 μm/h; p < 0.005, rank sum test). These data show that global transients contribute relatively little to differential process outgrowth.
Localized Ca2+ transients evoked with BayK and netrin-1 promote differential outgrowth of axons and their branches
All of our measurements thus far involved endogenous Ca2+ transients. To induce localized Ca2+ transients, we bath applied BayK 8644, which has been shown to open L-type voltage-gated Ca2+ channels. In most cases in which Ca2+ activity was imaged, BayK evoked an initial burst of global activity followed by localized Ca2+ activity (6 of 7 experiments) but in one case only global activity occurred. As shown in Figure 4A, application of BayK to neurons showing little fluctuation in Ca2+ activity almost immediately evoked localized high-frequency transients in the axon (black arrowhead) and asynchronous transients of lower-frequency (Fig. 4B) in the branch (red arrowhead). These transients persisted throughout the imaging period (see also supplemental Movie 2, available at www.jneurosci.org as supplemental material). To monitor effects on axon outgrowth, we then performed longer term experiments in which neurons were exposed to BayK for periods up to 24 h (Fig. 5). In some cases, images were acquired every 2 h (Fig. 5A) and in others images were acquired at the beginning and end of the imaging period (Fig. 5B–D). Exposure to BayK had no deleterious effects on the neurons which continued to extend processes robustly. In 64% of neurons (n = 129) exposed to BayK for 10–24 h significant differences in process outgrowth and retraction occurred in axons and their branches (Fig. 5E). As shown in Figure 5B, during the 12 h exposure to BayK the axon grew 140 μm whereas both branches (24 and 45 μm in length) completely retracted. In contrast another neuron (Fig. 5C) initially had an axon 400 μm long and numerous branches. After exposure to BayK for 20 h, the axon retracted for 88 μm back to a branch point whereas two short branches of 18 and 44 μm showed dramatic extension of 100 and 148 μm, respectively. In contrast only 35% of control neurons (n = 130) showed significant differences in outgrowth and retraction in axons versus branches (Fig. 5D,E). Interestingly, differential rates of process outgrowth in BayK experiments more often involved complete retraction of an axonal process compared with controls in which one or more processes grew more rapidly than another. Because BayK opens L-type channels leading to increased Ca2+ activity, we measured whether overall axon outgrowth was decreased by BayK. This was indeed the case because overall axon outgrowth was reduced to 67 ± 6% of control rates (p < 0.001, t test). This is consistent with our previous results in which high Ca2+ activity was correlated with reduced axon outgrowth (Tang et al., 2003).
Figure 4.
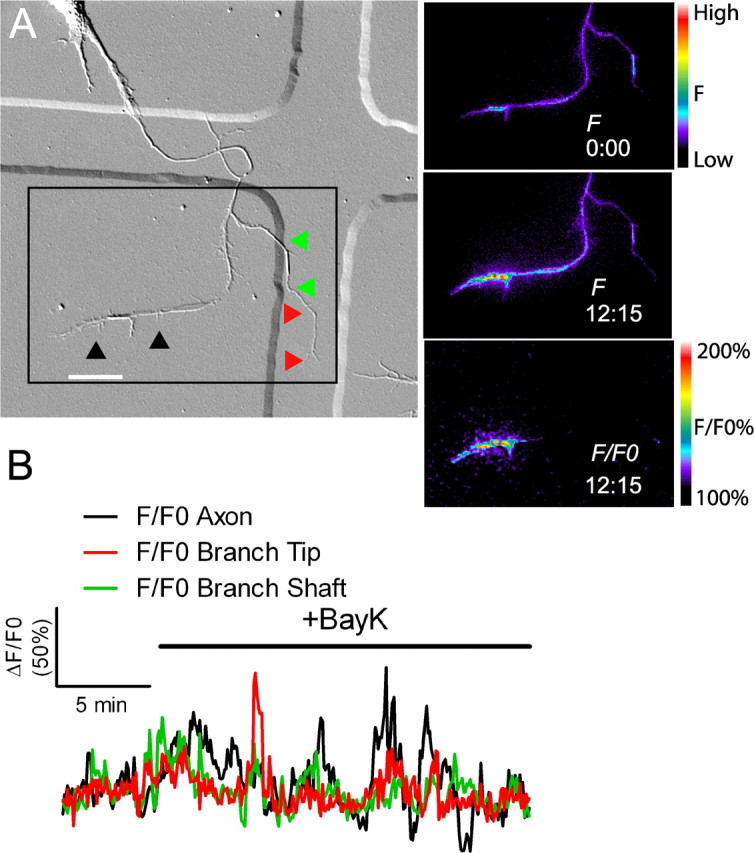
Bath application of BayK 8644 induces localized calcium transients. A, DIC (left) and fluorescence images (right) of a cortical neuron exposed to BayK 8644. Bath application of BayK at 0:00 induced high-frequency localized calcium transients primarily in the axon (between black arrowheads), but also in the branch (red and green arrowheads). An example of a localized calcium transient evoked by BayK is shown at time point 12:15. Calibration bars for raw fluorescence (F) and normalized fluorescence (F/F0) are shown at right. B, Graph of calcium activity before and after application of BayK (indicated by the black bar). Colors in the graph correspond to arrowheads in A. BayK 8644 induced localized calcium activity in six of seven experiments. Scale bar, 20 μm.
Figure 5.

Bath application of BayK 8644 increases differential process outgrowth. A, Time-lapse images of a cortical neuron exposed to BayK for 8 h, showing extension of the primary axon and retraction of the branch. B, C, Phase images showing the effect of BayK on increasing differential outgrowth between different processes from the same axon. B, After 12 h of exposure to BayK, the primary axon (black arrowhead) extended whereas the two branches (green and red arrowheads) completely retracted. C, After 20 h of exposure to BayK the primary axon (black arrowhead) retracted back to the nearest branch point whereas two branches (green and red arrowheads) extended. D, An example of a control neuron with only small differences in rates of outgrowth during the imaging session. In contrast to BayK treatment, differences in rates of outgrowth are smaller in control cultures. E, Quantifications of the effect of BayK on increasing differential outgrowth. E, Left, Bath application of BayK increased the number of neurons with significant differences in outgrowth rates among their axonal processes compared with control (***p < 0.001, Fisher's exact test, n ≥ 129 neurons from 5 experiments) (see Materials and Methods). Right, Bath application of BayK significantly increased the number of neurons that had both extending and retracting axonal processes (***p < 0.001, Fisher's exact test, n ≥ 129 neurons from 5 experiments). Scale bar, 20 μm.
Although BayK reduced overall rates of axon outgrowth, we found that it increased differential growth of axons and their branches in comparison with untreated controls. It was not possible to image Ca2+ transients throughout the long term BayK experiments without compromising the ability of axons to extend. Therefore to correlate Ca2+ activity evoked by BayK with rates of process outgrowth, we performed Ca2+ imaging during the last 10–15 min of BayK exposure in 16 experiments. In 14 of these neurons, localized differential Ca2+ transients were observed in axons and branches. In the example shown in Figure 6A, the neuron before the addition of BayK had two major axonal processes, but after 12 h of BayK exposure, the left process was undergoing retraction, whereas the other process had extended. Higher-frequency Ca2+ transients were found in the extending process than in the retracting process (Fig. 6B). The correlation between higher-frequency Ca2+ transients and increased rates of process outgrowth versus lower-frequency Ca2+ transients associated with retraction or slower outgrowth growth was observed in almost all (13 of 16) of the long-term BayK experiments in which Ca2+ activity was measured (Fig. 6C).
Figure 6.

BayK-induced calcium transients persist throughout long term treatments. A, Phase images of a cortical neuron treated with BayK for 12 h. At the end of the imaging session the processes on right (black arrowhead) extended, whereas the process on the left retracted (white/gray arrowhead). B, After phase imaging, cortical neurons were loaded with Fluo-4 and calcium activity was measured. The extending process from A (black) showed high levels of calcium activity compared with the retracting process (gray). C, Quantifications from 16 experiments imaging calcium activity after long-term BayK treatments revealed correlations between BayK-induced differential calcium activity and outgrowth. C, Left, Comparisons between processes from the same axon showed that processes with higher frequencies of BayK-induced calcium transients had higher rates of outgrowth, whereas processes with lower frequencies retracted (n = 22 comparisons; ***p < 0.001, paired t test). Right, Processes that extended faster had higher frequencies of calcium transients (n = 26 comparisons; **p < 0.01, paired t test). Scale bar, 20 μm.
Given our previous results (Tang and Kalil, 2005) showing that local application of netrin-1 can evoke localized Ca2+ transients in regions of the axon concomitant with promotion of branches from these same regions, we investigated whether differential Ca2+ activity evoked by netrin-1 could also elicit differential outgrowth of axons and branches. In contrast to the BayK experiments, the rapid effects of local netrin-1 application on axon branching made it possible to measure Ca2+ activity simultaneously with axon outgrowth. Of 15 neurons that expressed localized Ca2+ activity in their axons in response to local application of netrin-1, five neurons responded by developing branches de novo in the region of evoked Ca2+ activity. In one example (Fig. 7A,B) during the 30 min observation period, local application of netrin-1 elicited extension of two branches in the vicinity of the pipette tip. Measurements of Ca2+ activity in this region showed that the highest frequencies occurred in the developing branches. Importantly the branches show the highest rates of outgrowth compared with the distal region of the axon which retracts and shows lower-frequency transients. Measurements of frequencies of Ca2+ transients in 15 neurons in which local application of netrin-1-evoked localized Ca2+ activity revealed that higher frequencies in a branch or an axon were correlated with higher rates of outgrowth concomitant with reduced outgrowth or retraction of another process of the same axon (6.9 ± 1.9 μm/h vs −4.4 ± 1.6 μm/h; p < 0.0001, paired t test).
Figure 7.

Local application of netrin-1 increases outgrowth in stimulated processes and retraction in unstimulated processes. A, DIC images before (top left) and after (top right) local application of netrin-1 to the axon shaft. Filopodia (red and green arrowheads) showed increased calcium activity (bottom panels) and rapid branching during the experiment whereas the primary axon (black arrowhead) showed little calcium activity and retracted. Examples of fluorescence before application of netrin-1 (time point −5:00) and of fluorescence during localized calcium transients evoked by netrin-1 (times 10:30 and 18:20) are shown below. Pseudocolor scale bars indicating fluorescence intensity or normalized fluorescence intensity are shown to the side of the respective images. B, Graph of calcium activity in processes from A indicated by the colored arrowheads. Scale bar, 10 μm.
Localized Ca2+ transients evoked by photolysis of caged calcium promote differential outgrowth of axons and their branches
To determine whether axon outgrowth is promoted when localized Ca2+ transients are experimentally evoked, we sought to restrict Ca2+ activity to defined regions of axonal processes. We therefore used photolysis of caged calcium to evoke repetitive transients in localized regions of axons and their branches. We chose a frequency of Ca2+ transients close to the average transients (40 transients/h) observed previously (Tang and Kalil, 2005) in axonal branches of netrin-1 stimulated neurons undergoing relatively rapid outgrowth. Because the spot exposed to UV light was ∼50 μm in diameter, we were able to restrict photolysis to regions (12–50 μm) of axons or branches that typically included the distal region of the process and its growth cone. In the first set of experiments (n = 7), we verified that our photolysis procedures were able to evoke localized Ca2+ transients. Neurons with at least one branch were loaded with Fluo-4 and NP-EGTA (caged calcium) and a chosen region of the axon was stimulated at the desired frequency with repetitive pulses of UV light. As shown in Figure 8, A and B, each UV stimulation reliably evoked an immediate Ca2+ transient in the region of interest that was on average 106.5% of baseline Ca2+ levels (Fig. 8C). Although this was smaller than the average increase in amplitude that we found for spontaneous localized Ca2+ activity (175% of baseline) this increase was consistent with that evoked by photolysis in previous studies in which a similar increase in amplitude of Ca2+ activity was shown to induce growth cone turning (Tojima et al., 2007) or prevent neurite retraction (Lohmann et al., 2002). To further confirm that photolysis reliably evoked Ca2+ activity we increased the UV light intensity by four times and found that the amplitude of evoked Ca2+ activity was increased to 122% of baseline (Fig. 8D).
Figure 8.
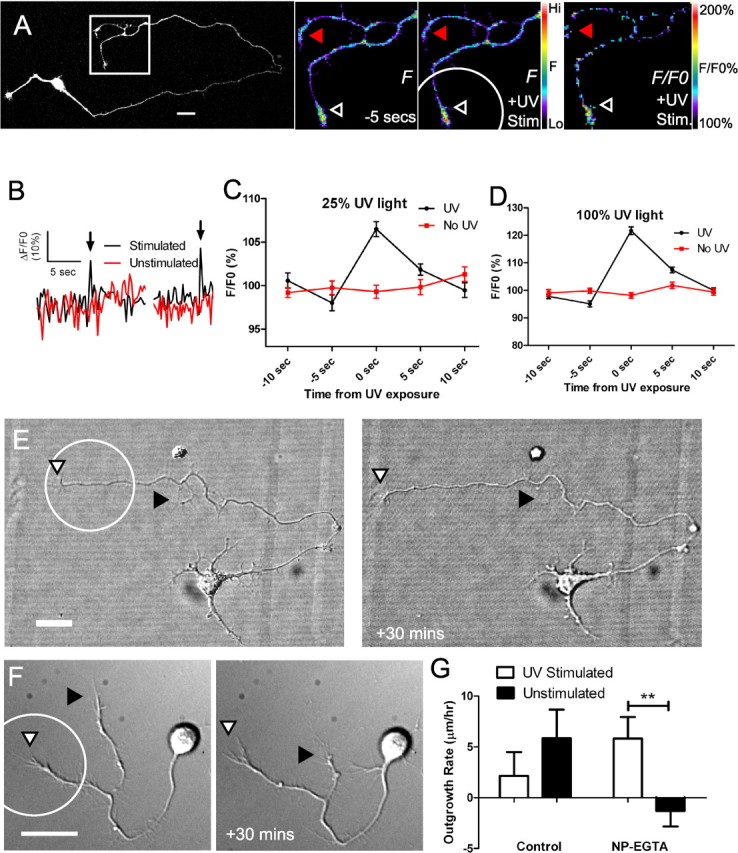
Localized photolysis of caged calcium increases differential outgrowth of stimulated vs unstimulated processes. A, Fluorescence image of a cortical neuron loaded with NP-EGTA and Fluo-4. Fluorescence images of calcium activity at rest (−5 s) and during UV stimulation of the bottom process (+UV Stim; circle indicates the stimulated region) show a localized calcium transient caused by photorelease of caged calcium (pseudocolor scale bar on right). Normalized fluorescence image indicates the change in fluorescence compared with baseline (F/F0 +UV Stim; pseudocolor scale on right). Arrowheads indicate unstimulated (red) and stimulated (black) regions of the axon where calcium activity was measured. B, Graph of calcium activity over time during the experiment shown in A. Exposure to UV light increases calcium activity in the stimulated region (black), but not in the unstimulated process (red). Arrows indicate the time point of UV exposure. C, Quantification of amplitudes of calcium activity evoked by stimulation with UV light filtered to 25% of maximum intensity in seven experiments. Stimulation increased fluorescence intensity to 106.5% of baseline in stimulated (black) but not unstimulated (red) processes (n ≥ 40 measurements). All outgrowth experiments were performed at this light intensity. D, Increasing the intensity of the UV light to 100% of maximum intensity increased the amplitude of the evoked response to 122% of baseline in five experiments. E, DIC images of a cortical neuron before (left) and after (right) repetitive stimulation in the region indicated by the circle. The primary axon (white arrowhead) extended 17.4 μm whereas the branch (black arrowhead) retracted. F, Higher-magnification DIC images of a cortical neuron before (left) and after (right) repetitive stimulation. The stimulated process (indicated with a circle) extended 8.5 μm whereas the unstimulated process retracted 23 μm. G, Quantification of outgrowth in stimulated (black bars) versus unstimulated processes (**p < 0.01, t test). Control neurons were not loaded with NP-EGTA, but were stimulated with UV light (n = 21 NP-EGTA loaded neurons and 18 control neurons). Scale bars, 20 μm.
To determine whether evoked Ca2+ activity increased rates of axon outgrowth, we performed photolysis for 30 min on neurons (n = 21) with at least one axon branch and then compared outgrowth of the stimulated and unstimulated axons and their branches. NP-EGTA is a calcium chelator with a low dissociation constant and it has been shown that neurons loaded with NP-EGTA do not express spontaneous Ca2+ transients (Gomez et al., 2001). As shown in Figure 8 in the majority of cases (67%), the stimulated process was favored for growth compared with the unstimulated process (Fig. 8G). This was true whether the stimulated process was an axon or a branch, which were stimulated in equal numbers. As shown in Figure 8E, stimulation of the distal region of the primary axon for 30 min resulted in axon growth of 17.4 μm, approximately three times the average for unstimulated control neurons, in contrast to the unstimulated branch which retracted 5.6 μm. In another example (Fig. 8F), photolysis was performed on the lower axonal process which extended ∼10 μm whereas the unstimulated process retracted ∼15 μm. Thus, in each case the unstimulated process served as an internal control for potentially harmful effects of photolysis which might be expected to impair neurite outgrowth. In addition, we performed control experiments by exposing axon processes to flashes of UV light in the absence of caged calcium. As expected, exposure to UV light reduced outgrowth of the exposed processes compared with the unexposed processes (Fig. 8G). Taking this negative effect on axon outgrowth into account, the effects of evoked localized Ca2+ activity on increasing axon outgrowth may have been underestimated in our measurements. Together, results from the photolysis induced and spontaneous Ca2+ activity show the same competitive effects on the growth of one axonal process at the expense of another.
Silencing localized Ca2+ transients reduces differences in growth rates in processes of the same axon
Having shown that localized Ca2+ transients can favor outgrowth of one axonal process over another, we sought to determine whether silencing localized Ca2+ activity would reduce or eliminate disparities in rates of process outgrowth. BayK induces Ca2+ activity through L-type voltage-gated channels. Therefore to silence Ca2+ transients, we used nifedipine, which we previously found to block Ca2+ entry through L-type channels on cortical neurons. As shown in Figure 9A, nifedipine blocked most localized activity and consequently reduced differential outgrowth of axons and their branches (Fig. 9C), an effect which persisted in long term exposure to nifedipine up to 24 h (Fig. 9D,E). Nifedipine reduced differential process outgrowth while at the same time increasing the overall outgrowth of axons and their branches to 120 ± 7% of control rates (p < 0.05, t test), consistent with our previous results showing that nifedipine increases rates of cortical axon outgrowth (Tang et al., 2003). As an additional means to reduce Ca2+ transients we applied TTX to neurons exhibiting localized Ca2+ activity. Compared with the frequencies of transients before treatment, which averaged 14.4 per hour, TTX reduced Ca2+ activity to an average of 7.2 per hour (Fig. 9B). Concomitantly, differences in outgrowth rates of axons and their branches were reduced by a factor of 3 compared with untreated control neurons (Fig. 9C).
Figure 9.

Nifedipine silences localized calcium transients and decreases differential outgrowth. A, DIC image (left) and graph of calcium activity (right) of a neuron with localized calcium transients in the axon (black arrowhead) and the branch (white/gray arrowhead) silenced by nifedipine. Robust localized calcium activity was almost completely silenced after addition of nifedipine (indicated by black bar). Nifedipine decreased localized calcium activity in five of six experiments. B, An example of a neuron in which TTX reduced localized calcium activity. TTX reduced localized calcium activity in five of five experiments. C, Differences in rates of outgrowth among processes from the same axon were smaller in neurons in which localized calcium activity was silenced by nifedipine (n = 5) and TTX (n = 5) than in control neurons (n = 12) (*p < 0.05, ANOVA on ranks with Dunn's posttest). D, An example of process outgrowth during 12 h of nifedipine application. Both processes (white/gray and black arrowheads) showed robust outgrowth at approximately the same rates. E, Bath application of nifedipine in long-term experiments (n ≥ 130 cells from 5 experiments for each condition) decreased the number of neurons with significant differences in the rates of outgrowth of their axonal processes (left) and decreased the number of neurons with both extending and retracting axonal processes (right, *p < 0.05, Fisher's exact test). Scale bars: 10 μm.
Discussion
In the present study, we investigated the role of localized calcium signaling in differential outgrowth of axons and their branches. We found that, in addition to global Ca2+ activity, axons and their branches can express spontaneous Ca2+ transients of different frequencies, which were localized to small regions of axons or restricted to single branches. Measurements of rates of outgrowth showed that higher frequencies of Ca2+ transients were correlated with higher rates of process outgrowth. Surprisingly, we observed that when an axonal process with higher-frequency Ca2+ transients extended relatively rapidly another process of the same axon with lower-frequency Ca2+ transients either stalled or retracted. This suggested a competitive mechanism whereby processes with higher-frequency Ca2+ transients extended at the expense of processes with lower levels of Ca2+ activity. To support these results experimentally we imposed Ca2+ activity pharmacologically with BayK, physiologically with netrin-1 or with localized photolysis of caged calcium. In each case, imposition of repetitive Ca2+ activity in one axonal process led to growth of that process, but stalling or retraction of the unstimulated branch. Conversely, pharmacologically silencing Ca2+ activity reduced the disparities in growth of axons and their branches. Together, these results suggest a competitive frequency-dependent mechanism whereby localized Ca2+ activity selectively promotes growth of one axonal process at the expense of another with Ca2+ activity of lower frequency.
Previous studies from our laboratory (Tang et al., 2003; Tang and Kalil, 2005) have shown that the growth of axons and branches of developing cortical neurons is regulated by levels of calcium activity. For spontaneous activity, we found that high-frequency high-amplitude global Ca2+ transients inhibited axon outgrowth and that silencing L-type voltage-gated Ca2+ channels promoted axon outgrowth (Tang et al., 2003). Although the present study showed that localized Ca2+ transients promoted differential axonal outgrowth, we also found that BayK, which opens L-type channels leading to increased Ca2+ activity, decreased overall axon outgrowth, consistent with our previous findings for global transients, in which rates of axon growth were inversely proportional to levels of calcium activity (Tang et al., 2003). For calcium activity induced by application of netrin-1, we found that the emergence of branches from the axon shaft was promoted by high-frequency localized Ca2+ transients that evoked localized calcium/calmodulin dependent protein kinase II (CaMKII) and mitogen-activated protein kinase signaling (Tang and Kalil, 2005). The present results are consistent with these findings because the growth of axonal processes was correlated with higher-frequency localized Ca2+ transients. Importantly, however, we show here for the first time that axons and their branches or different branches from the same axon can exhibit spontaneous calcium transients of different frequencies and that the relative differences in these frequencies as opposed to absolute levels of Ca2+ activity were responsible for differential and competitive growth of axonal processes.
Activity-dependent mechanisms govern competitive axon outgrowth
Previously, spontaneous fluctuations in intracellular calcium at early stages of development have been shown to reflect electrical activity (Cossart et al., 2005; Spitzer, 2006). Previous studies have described a role for activity-dependent mechanisms in the competition among different axons for synaptic territory during neural development (Sengpiel and Kind, 2002; Uesaka et al., 2006). In general, axons with higher levels of electrical activity outcompete axons with lower activity levels. A previous study in the zebrafish visual system showed that electrical activity in one axon relative to neighboring axons is a key determinant for elaborating a terminal arbor (Hua et al., 2005). Silencing electrical activity in single neurons by expressing an inward rectifying potassium channel decreased the size of their terminal axon arbors, and silencing neighboring axons with TTX rescued the arbor size and complexity of the transfected neurons. These results suggest that electrical activity per se confers a competitive advantage to axons with higher levels of electrical activity. Several previous studies support the role of activity in differentiation of CNS neurons. For example, Uesaka et al. (2007) demonstrated in organotypic cocultures of thalamus and cortex that neural activity enhanced the branch dynamics of thalamocortical axons that were biased toward more branch addition and elongation of branches in specific cortical target layers. The importance of electrical activity was also shown in vivo because reducing neuronal activity by overexpressing an inward-rectifying K+ channel in cortical neurons inhibited their morphological maturation including neurite length and branch number (Cancedda et al. 2007). In addition, eliminating correlated waves of electrical activity during development of the mammalian visual system disrupts pruning of axonal branches and refinement of the retinotopic map (McLaughlin et al., 2003; Chandrasekaran et al., 2005) supporting an instructive role for electrical activity in interaxonal competition.
In contrast, the role of differential Ca2+ activity in regulating competitive outgrowth among different processes of the same axon has been little studied. A previous study of NGF-mediated axon outgrowth demonstrated that local depolarization of axons with KCl to induce calcium entry resulted in increased outgrowth of those processes at the expense of outgrowth in unstimulated branches and neighboring axons (Singh and Miller, 2005). Furthermore, this competitive outgrowth was dependent on calcium influx through voltage gated channels and downstream activation of CaMKII. Because Ca2+ activity was not measured, it is not known whether the effects on outgrowth were frequency dependent. Thus, our results based on careful measurements of Ca2+ activity support the novel finding that higher frequencies of Ca2+ transients confer a competitive advantage for growth of one branch over another.
Branching of cortical neurons in vitro reflects in vivo branching mechanisms
In vivo, axons and branches projecting to different regions of the nervous system are likely to encounter different types and concentrations of guidance cues such as netrin-1 that evoke different levels of Ca2+ activity leading to competition among different processes of the same axon for growth. This mechanism would permit the primary axon to stall or regress while a branch of the same axon extends toward targets, as has been observed directly in the callosal pathway within cortical slices (Halloran and Kalil, 1994). How might differences in frequencies of Ca2+ transients favor the growth of one process over another? It seems likely that differential activation of calcium frequency-dependent effectors such as CaMKII and calcineurin would occur in each axonal process. Positive effectors such as CaMKI and CaMKII, which have been shown to promote neurite outgrowth (Borodinsky et al., 2003; Wayman et al., 2004, 2006) are preferentially activated in axonal processes with higher frequencies of Ca2+ transients (Tang and Kalil, 2005). CaMKIIβ has been shown to bind directly to actin filaments and increase filopodial dynamics (Fink et al., 2003), consistent with results indicating that direct elevation of Ca2+ activity by photolysis of caged calcium can rapidly evoke protrusion of new filopodia through polymerization of actin filaments (Lau et al., 1999). Different frequencies of Ca2+ transients may target different kinases and phophatases such as CaMKII and calcineurin, respectively, in the cytoplasm to elicit different cellular responses (Tomida et al., 2003). Opposing events such as extension and retraction of axonal processes may be regulated by Ca2+ transients at optimal frequencies (Eshete and Fields, 2001). Interestingly, we found here that for rapid extension of cortical axons and branches the optimal frequencies of both spontaneous and induced localized Ca2+ transients were similar across experiments. Thus, one role for localized Ca2+ signaling may be to confine Ca2+ transients at optimal frequencies to localized regions of the axon. Localized Ca2+ signaling would thereby regulate extension and retraction of axonal processes in response to environmental growth and guidance cues such as netrin-1, which we have shown previously to evoke high-frequency Ca2+ transients and induce axon branching (Tang and Kalil, 2005). At present, the signaling mechanisms whereby the growth of one axonal process is coordinated with the retraction of another are not known. However, we show here for the first time that localized Ca2+ transients are required for frequency dependent competitive growth of axons and their branches.
Footnotes
This work was supported by National Institutes of Health (NIH) Grant NS14428 and by a grant from the Whitehall Foundation. B.I.H. was supported by an Advanced Opportunity Fellowship, Predoctoral Training Grant GM07075, and a Research Supplement for Underrepresented Minorities from the NIH. We thank Dr. Timothy Gomez for help with the photolysis experiments and helpful advice during the course of this work.
References
- Augustine GJ, Santamaria F, Tanaka K. Local calcium signaling in neurons. Neuron. 2003;40:331–346. doi: 10.1016/s0896-6273(03)00639-1. [DOI] [PubMed] [Google Scholar]
- Bastmeyer M, O'Leary DD. Dynamics of target recognition by interstitial axon branching along developing cortical axons. J Neurosci. 1996;16:1450–1459. doi: 10.1523/JNEUROSCI.16-04-01450.1996. [DOI] [PMC free article] [PubMed] [Google Scholar]
- Borodinsky LN, O'Leary D, Neale JH, Vicini S, Coso OA, Fiszman ML. GABA-induced neurite outgrowth of cerebellar granule cells is mediated by GABA(A) receptor activation, calcium influx and CaMKII and erk1/2 pathways. J Neurochem. 2003;84:1411–1420. doi: 10.1046/j.1471-4159.2003.01638.x. [DOI] [PubMed] [Google Scholar]
- Cancedda L, Fiumelli H, Chen K, Poo MM. Excitatory GABA action is essential for morphological maturation of cortical neurons in vivo. J Neurosci. 2007;27:5224–5235. doi: 10.1523/JNEUROSCI.5169-06.2007. [DOI] [PMC free article] [PubMed] [Google Scholar]
- Chandrasekaran AR, Plas DT, Gonzalez E, Crair MC. Evidence for an instructive role of retinal activity in retinotopic map refinement in the superior colliculus of the mouse. J Neurosci. 2005;25:6929–6938. doi: 10.1523/JNEUROSCI.1470-05.2005. [DOI] [PMC free article] [PubMed] [Google Scholar]
- Cossart R, Ikegaya Y, Yuste R. Calcium imaging of cortical networks dynamics. Cell Calcium. 2005;37:451–457. doi: 10.1016/j.ceca.2005.01.013. [DOI] [PubMed] [Google Scholar]
- Dent EW, Kalil K. Dynamic imaging of neuronal cytoskeleton. Methods Enzymol. 2003;361:390–407. doi: 10.1016/s0076-6879(03)61020-7. [DOI] [PubMed] [Google Scholar]
- Dent EW, Barnes AM, Tang F, Kalil K. Netrin-1 and semaphorin 3A promote or inhibit cortical axon branching, respectively, by reorganization of the cytoskeleton. J Neurosci. 2004;24:3002–3012. doi: 10.1523/JNEUROSCI.4963-03.2004. [DOI] [PMC free article] [PubMed] [Google Scholar]
- Eshete F, Fields RD. Spike frequency decoding and autonomous activation of Ca2+-calmodulin-dependent protein kinase II in dorsal root ganglion neurons. J Neurosci. 2001;21:6694–6705. doi: 10.1523/JNEUROSCI.21-17-06694.2001. [DOI] [PMC free article] [PubMed] [Google Scholar]
- Fink CC, Bayer KU, Myers JW, Ferrell JE, Jr, Schulman H, Meyer T. Selective regulation of neurite extension and synapse formation by the beta but not the alpha isoform of CaMKII. Neuron. 2003;39:283–297. doi: 10.1016/s0896-6273(03)00428-8. [DOI] [PubMed] [Google Scholar]
- Goldberg JL, Espinosa JS, Xu Y, Davidson N, Kovacs GT, Barres BA. Retinal ganglion cells do not extend axons by default: promotion by neurotrophic signaling and electrical activity. Neuron. 2002;33:689–702. doi: 10.1016/s0896-6273(02)00602-5. [DOI] [PubMed] [Google Scholar]
- Gomez TM, Spitzer NC. In vivo regulation of axon extension and pathfinding by growth-cone calcium transients. Nature. 1999;397:350–355. doi: 10.1038/16927. [DOI] [PubMed] [Google Scholar]
- Gomez TM, Zheng JQ. The molecular basis for calcium-dependent axon pathfinding. Nat Rev Neurosci. 2006;7:115–125. doi: 10.1038/nrn1844. [DOI] [PubMed] [Google Scholar]
- Gomez TM, Robles E, Poo M, Spitzer NC. Filopodial calcium transients promote substrate-dependent growth cone turning. Science. 2001;291:1983–1987. doi: 10.1126/science.1056490. [DOI] [PubMed] [Google Scholar]
- Halloran MC, Kalil K. Dynamic behaviors of growth cones extending in the corpus callosum of living cortical brain slices observed with video microscopy. J Neurosci. 1994;14:2161–2177. doi: 10.1523/JNEUROSCI.14-04-02161.1994. [DOI] [PMC free article] [PubMed] [Google Scholar]
- Henley J, Poo MM. Guiding neuronal growth cones using Ca2+ signals. Trends Cell Biol. 2004;14:320–330. doi: 10.1016/j.tcb.2004.04.006. [DOI] [PMC free article] [PubMed] [Google Scholar]
- Henley JR, Huang KH, Wang D, Poo MM. Calcium mediates bidirectional growth cone turning induced by myelin-associated glycoprotein. Neuron. 2004;44:909–916. doi: 10.1016/j.neuron.2004.11.030. [DOI] [PMC free article] [PubMed] [Google Scholar]
- Hua JY, Smear MC, Baier H, Smith SJ. Regulation of axon growth in vivo by activity-based competition. Nature. 2005;434:1022–1026. doi: 10.1038/nature03409. [DOI] [PubMed] [Google Scholar]
- Jacques-Fricke BT, Seow Y, Gottlieb PA, Sachs F, Gomez TM. Ca2+ influx through mechanosensitive channels inhibits neurite outgrowth in opposition to other influx pathways and release from intracellular stores. J Neurosci. 2006;26:5656–5664. doi: 10.1523/JNEUROSCI.0675-06.2006. [DOI] [PMC free article] [PubMed] [Google Scholar]
- Lau PM, Zucker RS, Bentley D. Induction of filopodia by direct local elevation of intracellular calcium ion concentration. J Cell Biol. 1999;145:1265–1275. doi: 10.1083/jcb.145.6.1265. [DOI] [PMC free article] [PubMed] [Google Scholar]
- Lohmann C, Myhr KL, Wong RO. Transmitter-evoked local calcium release stabilizes developing dendrites. Nature. 2002;418:177–181. doi: 10.1038/nature00850. [DOI] [PubMed] [Google Scholar]
- Luo L, O'Leary DD. Axon retraction and degeneration in development and disease. Annu Rev Neurosci. 2005;28:127–156. doi: 10.1146/annurev.neuro.28.061604.135632. [DOI] [PubMed] [Google Scholar]
- McLaughlin T, Torborg CL, Feller MB, O'Leary DD. Retinotopic map refinement requires spontaneous retinal waves during a brief critical period of development. Neuron. 2003;40:1147–1160. doi: 10.1016/s0896-6273(03)00790-6. [DOI] [PubMed] [Google Scholar]
- Meyer MP, Smith SJ. Evidence from in vivo imaging that synaptogenesis guides the growth and branching of axonal arbors by two distinct mechanisms. J Neurosci. 2006;26:3604–3614. doi: 10.1523/JNEUROSCI.0223-06.2006. [DOI] [PMC free article] [PubMed] [Google Scholar]
- Nishiyama M, Hoshino A, Tsai L, Henley JR, Goshima Y, Tessier-Lavigne M, Poo MM, Hong K. Cyclic AMP/GMP-dependent modulation of Ca2+ channels sets the polarity of nerve growth-cone turning. Nature. 2003;423:990–995. doi: 10.1038/nature01751. [DOI] [PubMed] [Google Scholar]
- Portera-Cailliau C, Weimer RM, De Paola V, Caroni P, Svoboda K. Diverse modes of axon elaboration in the developing neocortex. PLoS Biol. 2005;3:e272. doi: 10.1371/journal.pbio.0030272. [DOI] [PMC free article] [PubMed] [Google Scholar]
- Ruthel G, Hollenbeck PJ. Growth cones are not required for initial establishment of polarity or differential axon branch growth in cultured hippocampal neurons. J Neurosci. 2000;20:2266–2274. doi: 10.1523/JNEUROSCI.20-06-02266.2000. [DOI] [PMC free article] [PubMed] [Google Scholar]
- Sengpiel F, Kind PC. The role of activity in development of the visual system. Curr Biol. 2002;12:R818–R826. doi: 10.1016/s0960-9822(02)01318-0. [DOI] [PubMed] [Google Scholar]
- Singh KK, Miller FD. Activity regulates positive and negative neurotrophin-derived signals to determine axon competition. Neuron. 2005;45:837–845. doi: 10.1016/j.neuron.2005.01.049. [DOI] [PubMed] [Google Scholar]
- Spitzer NC. Electrical activity in early neuronal development. Nature. 2006;444:707–712. doi: 10.1038/nature05300. [DOI] [PubMed] [Google Scholar]
- Tang F, Kalil K. Netrin-1 induces axon branching in developing cortical neurons by frequency-dependent calcium signaling pathways. J Neurosci. 2005;25:6702–6715. doi: 10.1523/JNEUROSCI.0871-05.2005. [DOI] [PMC free article] [PubMed] [Google Scholar]
- Tang F, Dent EW, Kalil K. Spontaneous calcium transients in developing cortical neurons regulate axon outgrowth. J Neurosci. 2003;23:927–936. doi: 10.1523/JNEUROSCI.23-03-00927.2003. [DOI] [PMC free article] [PubMed] [Google Scholar]
- Tojima T, Akiyama H, Itofusa R, Li Y, Katayama H, Miyawaki A, Kamiguchi H. Attractive axon guidance involves asymmetric membrane transport and exocytosis in the growth cone. Nat Neurosci. 2007;10:58–66. doi: 10.1038/nn1814. [DOI] [PubMed] [Google Scholar]
- Tomida T, Hirose K, Takizawa A, Shibasaki F, Iino M. NFAT functions as a working memory of Ca2+ signals in decoding Ca2+ oscillation. EMBO J. 2003;22:3825–3832. doi: 10.1093/emboj/cdg381. [DOI] [PMC free article] [PubMed] [Google Scholar]
- Uesaka N, Ruthazer ES, Yamamoto N. The role of neural activity in cortical axon branching. Neuroscientist. 2006;12:102–106. doi: 10.1177/1073858405281673. [DOI] [PubMed] [Google Scholar]
- Uesaka N, Hayano Y, Yamada A, Yamamoto N. Interplay between laminar specificity and activity-dependent mechanisms of thalamocortical axon branching. J Neurosci. 2007;27:5215–5223. doi: 10.1523/JNEUROSCI.4685-06.2007. [DOI] [PMC free article] [PubMed] [Google Scholar]
- Wayman GA, Kaech S, Grant WF, Davare M, Impey S, Tokumitsu H, Nozaki N, Banker G, Soderling TR. Regulation of axonal extension and growth cone motility by calmodulin-dependent protein kinase I. J Neurosci. 2004;24:3786–3794. doi: 10.1523/JNEUROSCI.3294-03.2004. [DOI] [PMC free article] [PubMed] [Google Scholar]
- Wayman GA, Impey S, Marks D, Saneyoshi T, Grant WF, Derkach V, Soderling TR. Activity-dependent dendritic arborization mediated by CaM-kinase I activation and enhanced CREB-dependent transcription of Wnt-2. Neuron. 2006;50:897–909. doi: 10.1016/j.neuron.2006.05.008. [DOI] [PubMed] [Google Scholar]
- Wen Z, Guirland C, Ming GL, Zheng JQ. A CaMKII/calcineurin switch controls the direction of Ca2+-dependent growth cone guidance. Neuron. 2004;43:835–846. doi: 10.1016/j.neuron.2004.08.037. [DOI] [PubMed] [Google Scholar]