

Abstract
High-speed biplane x-ray and neutral density targets were used to examine brain displacement and deformation during impact. Relative motion, maximum principal strain, maximum shear strain, and intracranial pressure were measured in thirty-five impacts using eight human cadaver head and neck specimens. The effect of a helmet was evaluated. During impact, local brain tissue tends to keep its position and shape with respect to the inertial frame, resulting in relative motion between the brain and skull and deformation of the brain. The local brain motions tend to follow looping patterns. Similar patterns are observed for impact in different planes, with some degree of posterior-anterior and right-left symmetry. Peak coup pressure and pressure rate increase with increasing linear acceleration, but coup pressure pulse duration decreases. Peak average maximum principal strain and maximum shear are on the order of 0.09 for CFC 60 Hz data for these tests. Peak average maximum principal strain and maximum shear increase with increasing linear acceleration, coup pressure, and coup pressure rate. Linear and angular acceleration of the head are reduced with use of a helmet, but strain increases. These results can be used for the validation of finite element models of the human head.
Keywords: Cadaver, impact, head kinematics, brain motion, intracranial pressure, strain, helmet
Introduction
Traumatic brain injury (TBI) continues to be a substantial problem to society. Approximately 50,000 people die annually from TBI in the United States, representing more than 33 percent of all injury-related deaths (Centers for Disease Control and Prevention, 2002). The leading causes of TBI death are violence, motor vehicle accidents, and falls. Mild traumatic brain injury (MTBI) cases account for roughly 75 percent of the 1.5 million persons who suffer TBI each year in the US, representing almost $17 billion in costs (National Center for Injury Prevention and Control, 2003).
Among the numerous theories regarding the mechanisms of brain injury are negative pressure, positive pressure, pressure gradients, and rotation and shear effects (Hardy et al., 1994). These theories resulted from numerous animal and cadaver experiments, and physical and analytical models. The practical results of these studies have been limited as most reflect gross approximations of a complex living biological system in response to general, external impact parameters. For example, a head injury predictor such as the Head Injury Criterion (HIC), which relies only on external kinematics measurements, is currently used for the design and evaluation of vehicles, environments, and protective equipment. However, HIC might not reflect the response of the brain. Precise brain injury mechanisms and tolerance criteria are not known. Decades of research have yet to show the relationship between kinetic input and resultant head injury in simple cause and effect terms. An understanding of the relationship between the local response of the intracranial contents and injury outcome is required.
The local response parameters that might be important are transient pressure, tissue strain, shear strain, and strain rate. Although cadavers cannot provide injury response data, knowledge of the mechanical response of the brain will contribute to a better understanding of brain injury. Work in this area will forward the development of a graded scale related to the severity of specific brain injuries to assess the potential for harm during automotive crashes, sporting events, and intentional or accidental injury. Finite element models validated against relative motion and strain data will be instrumental in assessing the potential for injury and in designing improved restraint systems, safer environments, and better protective equipment.
Brain deformation and relative motion between the brain and skull have been examined using a variety of techniques. These include application of a transparent calvarium to subhuman primates in an attempt to visualize brain motion and distortion directly, implanting accelerometers in the brains of post-mortem human subjects, high-speed x-ray imaging of animals and cadavers, finite element (FE) modeling, and magnetic resonance imaging (MRI) of human subjects undergoing voluntary motion.
Pudenz and Shelden (1946) replaced a portion of the skull of Macaques with a transparent polymer calvarium. The calvarium was attached to the skull using screws, after removal of the dura. High-speed film was used to record motion during impact. Regardless of the site of impact, motion was observed to be maximal in the parieto-occipital region and minimal in the frontal region, a phenomenon thought to be related to constraint by the anterior fossa. For impacts in the sagittal plane, rotational motion of the brain was observed to lag that of the skull. This was not observed in the coronal plane, a phenomenon thought to be related to the constraint by the falx cerebri. Minimal contrecoup injury was obtained in tests for which the head was fixed, but pronounced lesions were found in tests for which the head was free. Gosch et al. (1969) employed a similar calvarium in a study of Rhesus monkeys in which EEG was monitored. Minimal deformation was found to be associated with concussion, but relative movement between the brain and skull was associated with contusions. It was postulated that injury was a consequence of structures interacting at different rates. In these studies, the effect of the removal of portions of skull and dura, and the influence of intracranial gasses introduced during surgery is unknown.
Although researchers began using x-ray for the investigation of head injury mechanisms long ago, relatively few studies have been conducted over the years. The earliest approaches employed flash x-ray techniques. Hodgson et al. (1966) used intravascular contrast media and lead targets to track brain motion in anesthetized dogs subjected to impact. A single plain film image was captured near the time of maximum head compression. The curvilinear pattern revealed by the targets suggested a shearing response of the brain. The targets were said to have returned to their original positions, suggesting that the brain underwent an elastic deformation. Although this observation also suggested that the inertial effect of the targets was less than the elastic capacity of the brain tissue, the influence of target density on brain displacement is not known.
Shatsky et al. (1974) used a flash x-ray system to investigate in vivo head injury in subhuman primates. High-frequency skull displacements were observed. High-frequency movement of cerebral blood vessels was observed early in the impact event. Subsequent low frequency movement of cerebral blood vessels was found. These motions were on the order of 2-3 mm. High frequency oscillations and low frequency movements of the ventricular system were noted as well. For temporoparietal impacts, an attempt was made to examine strain in terms of the change in lateral distance from the skull to the midline anterior cerebral artery. Strain on the order of 0.086 ± 0.019 was observed.
Stalnaker et al. (1977) used high-speed x-ray and lead markers in a series of cadaver impacts to show that vascular and cerebrospinal repressurization greatly increased the coupling between the brain and skull, providing a more rigid response of the head. Subsequently, Nusholtz et al. (1984) investigated head impact in anesthetized monkeys, deceased monkeys, and repressurized cadavers. High-speed x-ray was used to observe skull and brain deformation. Curved lines of neutral density radio opaque gel were injected into the brain tissue and ventricles. In some cases, no differential motion between the brain and skull was found, but internal distortion of the brain was observed. However, for a case involving skull fracture, relative motion of the brain with respect to the skull on the order of 6 mm was found. It was postulated that a “stick-slip” condition might exist and that substantial local skull acceleration could initiate relative brain motion.
After these early experiments, the use of high-speed x-ray for the investigation of head injury mechanisms subsided temporarily. During this hiatus, accelerometry was used in an attempt to quantify brain motion during impact. Trosseille et al. (1992) implanted accelerometers in the brains of cadavers and conducted five tests to obtain data for validation of a finite element model of the head. However, the density of the accelerometers was not the same as that of the surrounding brain tissue, and water was used for perfusion. Hardy et al. (1997) developed miniature triaxial neutral density accelerometers, or NDAs. The NDAs were designed to displace a minimum of brain tissue when implanted and to maintain their position with respect to surrounding tissue during impact. For a series of low-speed cadaver head impacts, comparison of NDA output to a skull mounted accelerometer array disclosed 3-5 mm displacement or distortion of the brain inside the skull. The performance of the NDAs was validated in three-dimensional space using high-speed biplane x-ray. In addition to validating the NDA performance, this x-ray system was used to image a small cluster of seven reduced density targets. Stretch within this cluster was estimated to be on the order of 5-7 percent for the first-peak response, which occurred near 7 ms.
Given the technical challenges associated with imaging and tracking a small cluster of targets in the cadaver brain using high-speed x-ray, the cluster approach was set aside temporarily in favor of implanting columns of larger neutral density targets (NDTs). Al-Bsharat et al. (1999) presented the resultant relative displacement between the brain and skull for a few cadaver head impacts, the results of which were used for development and validation of an FE model of the human head. Resultant relative motion was found to be on the order of 3 mm for these tests.
Hardy et al. (2001) continued testing using high-speed biplane x-ray and neutral density technology. Inverted, repressurized, human cadaver head and neck complexes were subjected to frontal and occipital impacts, resulting in motion in the median plane. Motion of the brain was presented for two columns of NDTs, anterior and posterior, in the sagittal perspective. The local brain motions were shown to follow loop or figure-eight patterns, with peak displacements on the order of ± 5 mm. The orientation and extent of the path described by each NDT depended upon the location of the NDT in the brain, with those closer to the periphery being aligned with the boundary of the skull and having greater excursion. Angular speed was found to be the most convenient measure for comparison of brain and skull motion. The displacements of the brain were found to lag the motion of the skull, but the brain returned to its initial configuration after impact. King et al. (2002) furthered the analyses of Hardy et al. (2001), describing the brain displacements as having a major deformation axis (MDA), and as being related to an average instant center (AIC) of rotation. Motion for impact in the median and coronal planes was found to be remarkably similar, as was the angular speed of each test. The brain motions exhibited substantial anterior-posterior and right-left symmetry.
Zou et al. (2007) examined the brain motion data of Hardy et al. (2001) in terms of rigid-body displacement and deformation components. An analytical model was created in which each NDT location was attached to all others via linear springs, creating an NDT network. The NDT positions during impact were compared to their initial positions prior to impact. Minimization of total pseudo-strain energy was applied to best align the network of NDTs to its initial conformation using rigid-body transformation. At low speed, brain displacement could be described primarily in terms of rigid-body motion (4-5 mm and ± 5 degrees), while at higher speed deformation accounted for most of the additional movement.
FE models of the human head have become increasingly more important to the study of head injury. Multiple analyses on a fine scale are possible with these models, permitting investigation of various conditions and parameters not practical or possible in cadaver tests. The data generated by Hardy et al. (2001) have been used in the validation of a few such models. Validation efforts using these data include the WSUBIM (Zhang et al., 2001), the KTH model (Kleiven and Hardy, 2002), and SIMon (Takhounts et al., 2003). A challenge for all models using these data is subject geometry: The NDT data are referenced to the head c.g., which provides no information regarding the boundary conditions. The response of a tissue region is highly dependant upon the subject-specific local boundaries, which are unlikely to correspond well to those of any given FE model.
At least two studies have attempted to characterize human brain motion in vivo using MRI. Ji et al. (2004) examined the difference in position of the brain stem and orientation of the cerebellum for a neutral posture, 7-degrees flexion, and 54-degrees flexion. For 54-degrees flexion, axial motion of the brain stem with respect to the skull was found to be between 0.8 and 1.6 mm. Relative rotation of the cerebellum was found to be between 2.7 and 4.3 degrees. Bayly et al. (2005) examined brain deformation in human subjects undergoing voluntary deceleration on the order of 2-3 g. Multiple images were acquired as the head motion was repeated to build a time history of data. Points along tag lines imposed on the images were tracked. Strain was estimated to be on the order of 0.02-0.05 using these points.
To further the understanding of the mechanics of head impact, controlled impacts of inverted human cadaver head preparations were conducted in this study, similar to those conducted by Hardy et al. (2001). Displacement and deformation of the brain were observed using neutral density targets and a high-speed, biplane x-ray system. However, instead of columns of targets, clusters of targets were implanted in each specimen similar to the approach of Hardy et al. (1997). Displacements of the brain were compared to the kinematics of the skull, which were measured using a nine-accelerometer array. Maximum principal strain and shear strain were evaluated within the target clusters. Various levels of linear and angular acceleration were applied to the specimens. A helmet was used for approximately one-half of the tests. Intracranial pressure was monitored.
Methods
Human cadaver1 head and neck complexes were tested in an inverted configuration. The specimens were repressurized using artificial cerebral spinal fluid (aCSF). The specimens were brought to speed using a pneumatic piston device, and then stopped rapidly against an acrylic block impact surface. The impacts were designed to produce greater or lesser levels of angular acceleration compared to linear acceleration. The tests were conducted with the principal motion being confined to a single plane. Some tests were conducted with the specimen fitted with a helmet. The generalized three-dimensional head kinematics, coup and contrecoup intracranial pressure, and relative brain motion were measured. The methods herein are related to those described by Hardy et al. (2001) for use of Neutral Density Targets (NDTs) and high-speed biplane x-ray.
Specimens and Conditions
Table 1 shows the eight cadavers used for these tests and the cadaver characteristics. The average age, stature, and mass were 73 years, 167 cm, and 80 kg, respectively. These eight cadavers were used for thirty-five tests. Table 2 provides the testing conditions. Each specimen was tested from two-to-six times (T1-T6). Two different high-speed camera systems were used: the Vision Research Phantom 4 (VR4) and 9.1 (VR9).
TABLE 1.
Specimen characteristics
| Head dimensions | ||||||
|---|---|---|---|---|---|---|
| Cadaver | Gender | Age | Stature
(cm) |
Mass
(kg) |
Depth
(cm) |
Breadth
(cm) |
| C288 | f | 69 | 160 | 77.0 | 18.4 | 13.3 |
| C241 | m | 61 | 178 | 131.0 | 18.1 | 14.5 |
| C015 | m | 75 | 175 | 86.1 | 17.6 | 14.5 |
| C064 | m | 82 | 171 | 64.6 | 17.7 | 14.5 |
| C380 | f | 78 | 154 | 84.8 | 18.5 | 16.0 |
| C393 | f | 61 | 152 | 42.2 | 18.6 | 16.2 |
| C408 | f | 88 | 171 | 84.1 | 18.3 | 14.5 |
| C472 | f | 72 | 172 | 70.7 | 18.0 | 15.0 |
TABLE 2.
Testing configurations
| Specimen and test | Camera | Impact | Plane | Region | Helmet | |
|---|---|---|---|---|---|---|
| C288 | T1 | vr4 | aligned | median | occipital | y |
| T2 | offset | y | ||||
| T3 | offset | n | ||||
| T4 | aligned | n | ||||
|
| ||||||
| C241 | T1 | vr4 | aligned | median | occipital | y |
| T2 | aligned | y | ||||
| T3 | offset | y | ||||
| T4 | offset | y | ||||
| T5 | offset | n | ||||
| T6 | aligned | n | ||||
|
| ||||||
| C015 | T1 | vr4 | aligned | median | occipital | y |
| T2 | aligned | y | ||||
|
| ||||||
| C064 | T1 | vr4 | aligned | median | occipital | y |
| T2 | offset | y | ||||
| T3 | offset | n | ||||
| T4 | aligned | n | ||||
|
| ||||||
| C380 | T1 | vr9 | offset | coronal | temporal lt. | y |
| T2 | offset | horizontal | parietal lt. | y | ||
| T3 | aligned | coronal | temporal lt. | y | ||
| T4 | offset | n | ||||
| T5 | offset | horizontal | parietal lt. | n | ||
| T6 | aligned | coronal | temporal lt. | n | ||
|
| ||||||
| C393 | T1 | vr9 | aligned | coronal | temporal lt. | y |
| T2 | offset | y | ||||
| T3 | aligned | n | ||||
| T4 | offset | n | ||||
|
| ||||||
| C408 | T1 | vr9 | aligned | median | occipital | y |
| T2 | offset | y | ||||
| T3 | offset | y | ||||
| T4 | offset | n | ||||
| T5 | aligned | n | ||||
|
| ||||||
| C472 | T1 | vr9 | aligned | median | occipital | y |
| T2 | offset | y | ||||
| T3 | offset | n | ||||
| T4 | aligned | n | ||||
Effort was made to control the relative levels of linear and angular acceleration by varying the impact location with respect to the center of gravity (c.g.) of the head. For tests designed to result in relatively greater linear acceleration, the impact location was more closely aligned with the c.g. of the head. For tests designed to result in relatively greater angular acceleration, the impact location was offset from the c.g. of the head. These conditions are described as “aligned” or “offset” in Table 2.
The specimens were oriented in an attempt to limit the majority of translation and rotation to one plane. Most of the tests were performed in the median plane (25), with eight performed in the coronal plane and two performed in the horizontal plane. The specimens were positioned such that tests in the median plane involved impact to the occipital region. Tests in the coronal plane involved impact to the left-side temporal region, and tests in the horizontal plane involved impact to the left-side parietal region.
For approximately one-half of the tests, an American Football helmet (Riddell VSR4) was placed on the specimens. A typical test sequence for a given cadaver series involved use of the helmet for the first half of the tests. The helmet was removed for the later tests. Tests were conducted under both the aligned and offset conditions, with and without the helmet in place.
Specimen Preparation
After serological and radiological screening of a cadaver, the head was shaved and anthropometric measurements were taken. The head and neck complex was disarticulated between the third and fourth thoracic vertebrae. The ribs were reduced to 3-cm length from the costovertebral junctions bilaterally. The third thoracic vertebra was separated from the remaining column, while preserving the associated length of spinal dura. Approximately 2 cm of spinal cord was excised from the dural sheath, and a barbed fitting was attached to the sheath to facilitate perfusion of the brain.
The neck was then dissected to expose the common carotid arteries and jugular veins. Compression fittings were attached to each vessel to facilitate perfusion of the cerebral vasculature. Substantial tissue was removed from the spine, leaving only enough material to inhibit desiccation of the cervical ligaments. Any remaining compromised vasculature was ligated, with the exception of the vertebral arteries, which were left patent and assisted in bleeding gasses from the circulatory system.
The specimen was then attached to a rotational subassembly of the impact apparatus. The third thoracic vertebra was passed through an aperture in an aluminum cup, and pinned in place. The vertebral body was potted in place using Dynacast mold casting compound. Subsequent steps included attachment of the kinematics measurement array, implanting of pressure transducers, and target placement.
Generalized Kinematics Measurement
The generalized 3D kinematics of the head was measured using the Wayne State University (WSU) 3-2-2-2 array, or nine-accelerometer package. The tetrahedral version of this array used for these tests is that described by Hardy (2002). This CNC-machined array can be mounted on its base or by fastening to each end of the three axes such that the open face of the tetrahedron is proximal to the subject. This tetrahedral array is shown at the top of Figure 1. The array is loaded with Endevco 7264C-2kTZ accelerometers (2000-g range).
FIGURE 1.
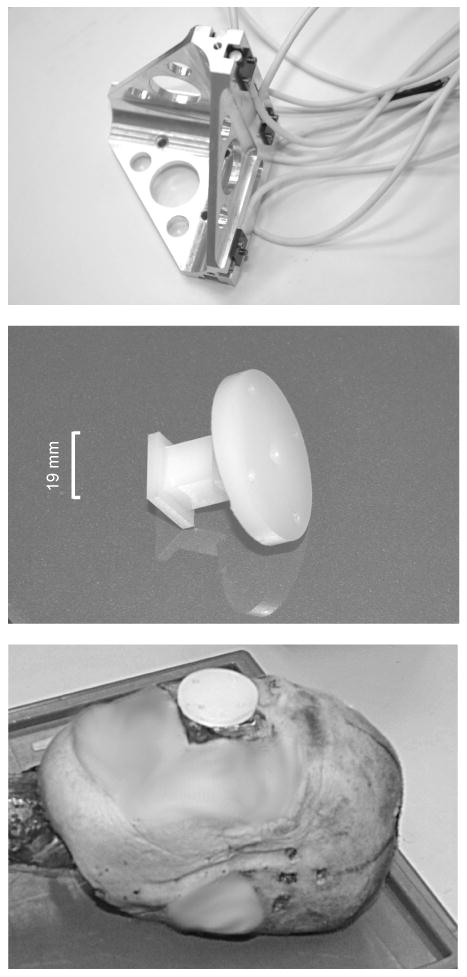
The tetrahedral nine-accelerometer array used to measure head kinematics and its associated attachment techniques. The tetrahedral array loaded with Endevco 7264C-2kTZ accelerometers (top), the Nylon® pedestal used to fix the accelerometer array to the skull (middle), the pedestal installed in the maxillary sinus of C393 using Dynacast as a potting compound (bottom).
Hardy et al. (2001) attached this array to the apex of the cadaver head using an interface mounting plate and stainless steel inserts threaded in to the skull for attachment. However, since for these tests the same specimen was used both with and without a helmet, the current 3-2-2-2 mount could not be attached to the apex of the head because of interference with the helmet. Therefore, the kinematics array was moved from the apex of the head to a region not encompassed by the helmet. This region was the face. A new Nylon® pedestal system was designed and fabricated to facilitate fixation of the array. This pedestal is shown in the middle of Figure 1. The nasal bone, frontal process and orbital surface of the maxilla, the lacrimal bone, and portions of the ethmoid bone were removed to provide space for the pedestal. The maxillary sinuses were evacuated and the uvula removed. The pedestal was fixed in the resulting cavity using polyester resin or Dynacast. The resin was allowed to flow into the oral cavity to provide additional anchoring of the pedestal. The pedestal is shown installed in the right maxillary sinus of C393 at the bottom of Figure 1.
Intracranial Pressure Measurement
Intracranial pressure was measured using two implanted cranial pressure transducers (CPTs). The CPTs were implanted in the brain tissue at sites predicted to approximate the coup and contrecoup locations. The CPTs used for these tests were Entran EPB-B02-500P hermetically sealed pressure transducers (3.5-MPa range, 50-kHz bandwidth). The diameter of the barrel-shaped transducers is 3.2 mm. A typical CPT is shown at the top of Figure 2.
FIGURE 2.

A cranial pressure transducer (CPT) and associated implanting techniques. An Entran EPB-B02-500P CPT (top), a representative trephine and connector sealing system (middle), and a trephine seal installed in specimen C064 with transducer cable attached and sealed with silicone (bottom). An installed seal prior to cable connection and silicone application (bottom inset).
Since the CPTs must interface with extracorporal electronics, trephines are drilled and fitted with stainless steel threaded inserts. These trephines must then be sealed. Trephine seals are an integral component of the CPT system. They provide electrical connectivity as well as sealing, and mate with the threaded inserts set in the skull. An assembly view of a typical trephine seal is shown in the middle of Figure 2. Miniature five-pin male Lemo connector inserts are used for wiring purposes. Miniature O-rings are installed on either side of the locating collar of the connector inserts. The inserts are captured within an internally-threaded plug by compressing the O-rings around the collars using a threaded sleeve. The transducer wire connections are potted in epoxy. A thin retaining nut and larger O-ring are used to secure and seal the assembly to the skull. The seals do not penetrate below the level of the inner table of the skull so as to not affect the motion of the brain. An installed trephine seal is shown at the bottom of Figure 2. The transducer cabling is sheathed in a long silicone tube and terminates to a female Lemo insert, which is adhered to the trephine seal using room-temperature-vulcanizing (RTV) silicone compound.
Neutral Density Targeting
The motion of the brain tissue is imaged using high-speed x-ray, so the implanted targets must be radiopaque. This generally requires rather dense metals such as lead, gold, or tantalum. Such heavy materials might cause deformation of, or damage to brain tissue during head impact. Therefore, neutral density targets were implemented for this purpose. The NDTs were designed to occupy a minimal volume, maintain their position with respect to surrounding brain tissue, and not distort or lacerate the brain during the impact.
Tin was selected as the basis for the NDTs, since it has about the same x-ray absorption characteristics as gold and lead (K edge, or energy level at which there is a sharp photon attenuation increase), but is much less dense than gold or lead. Tin granules 1.9 mm in diameter were inserted into the center of thin-walled polystyrene tubing and held in place with cyanoacrylate. The ends of the tubes were capped with thin sheets of styrene. This encapsulation reduced the overall target density. The finished targets were 5-mm long, 2.5-mm diameter cylinders, having density at or below 1.5 gm/ml. The collection of fourteen NDTs is shown at the top of Figure 3.
FIGURE 3.
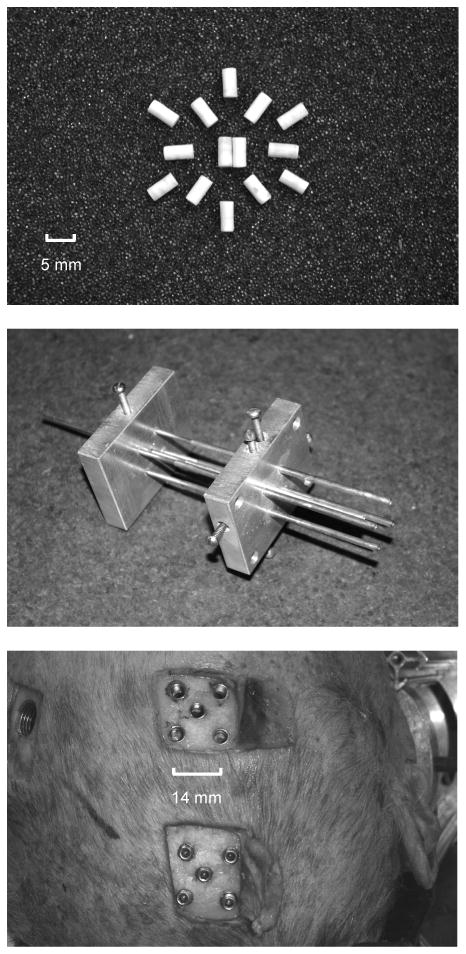
Neutral Density Targets (NDTs) and associated implanting techniques: The NDT collection (top), the NDT implant cannula fixture (middle), and representative sealed and unsealed trephine arrays (bottom) in the skull of C015 through which NDTs are implanted using the cannula fixture.
A typical cluster of seven NDTs was implanted in a 1-5-1 scheme with the center target being 10 mm from the other six targets. This encompasses roughly 4 ml of tissue, which facilitates approximation of local strain parameters. However, the targets cannot be placed too close to each other as there may be spatial interference in the biplane images.
To implant these NDT clusters, a cannula fixture was used. This fixture is shown in the middle of Figure 3. The cannula fixture consists of five brass tubes that are beveled at the insertion end, each having a brass rod stylet. The cannulae form a square pattern with one tube at the center of this square. Each corner cannula is 10 mm from the center. The cannulae are held in this pattern by an aluminum block and set screws. The insertion length of the cannulae can be adjusted depending upon implant location and cadaver anthropometry. The stylets are held in position by a second aluminum block. The center cannula and stylet are independently adjustable so that additional targets may be implanted deeper or more shallow than the main array of five, along the center line of the array. The fixture was designed to be inserted only once during the implanting procedure.
The cannulae were passed through the skull and in to the brain though a pattern of trephines. The trephine patterns were drilled using a special jig that matched the cannula fixture configuration. The trephines were lined with threaded inserts and were sealed using setscrews and RTV silicone after the NDTs were implanted. Representative sealed and unsealed trephine arrays placed in the skull of specimen C015 are shown at the bottom of Figure 3. First, the deepest center NDT was implanted. Next, the center cannula and stylet were adjusted to facilitate creation of a five-NDT pattern in a plane 10 mm closer to the cortex. Then, the five coplanar targets were deployed through the cannulae, ejected by passing the stylets through the cannulae. The center cannula and stylet were adjusted again, and the seventh NDT was deployed another 10 mm closer to the cortex. This procedure was performed with most of the air evacuated from the intracranial space, and under light perfusion. Otherwise, the brain would change shape when the orientation of the head was changed and when the head was perfused for testing. The implanting procedure was performed with the aid of fluoroscopy.
General Preparation and Targeting Schemes
Post instrumentation x-rays were taken to review the location and shape of the NDT clusters, to determine the position of the c.g. of the head with respect to the origin of the WSU 3-2-2-2, and to establish a known body-fixed basis for the skull. A phantom was positioned on the pedestal implanted in the maxillary sinus to mark the position and orientation of the nine-accelerometer array. The infraorbital ridge and auditory meatus were marked with 3-mm diameter lead spheres to define the Frankfort plane and facilitate measurement of the head c.g. location.
Several of these spheres were fixed to the left side of the skull to define the anatomical coordinate system of the head. For this system, the positive X direction was defined as forward from posterior to anterior, the positive Y direction was defined as lateral from right to left, and the positive Z direction was defined as upward from inferior to superior. Regardless of position and orientation, all target and accelerometer data were transformed to this system. Figure 4 shows the left-side sagittal and frontal perspective radiographs of a representative specimen (C288) prepared for an occipital impact in the median plane. The NDT clusters, CPT locations, skull markers, trephine seals, and the kinematics array phantom are shown.
Figure 4.

Representative instrumentation x-rays (lateral and AP) from specimen C288 prepared for an occipital impact in the median plane, showing the NDT clusters, CPT locations, skull markers, trephine seals, and the phantom defining the nine accelerometer array origin and orientation.
Table 3 shows the NDT target locations for the eight test series. The target configurations were varied depending upon the test conditions. For most occipital impacts in the median plane (C288, C241, C015, C064), one NDT cluster was placed in the frontal lobe and one was place in the parietal lobe, both on the right side. For temporal or parietal impacts in the coronal or horizontal planes (C380, C393), one NDT cluster was placed in the right hemisphere and one was placed in the left hemisphere, both being in the parietofrontal regions. The target positions given in Table 3 are represented graphically in Figure 5, which provides the general NDT cluster implanting schemes for tests involving impact in the median, coronal, and horizontal planes. The anatomical directions are indicated, with the c.g. of the head at the origin of this system. There are 7 targets in each of two NDT clusters, and multiple markers are attached to the skull to define the body-fixed basis. The data are presented and analyzed in terms of these perspectives.
TABLE 3.
Target implant configurations
| Cadaver | NDT cluster Locations | |
|---|---|---|
| C1 | C2 | |
| C288 | frontal rt. | parietal rt. |
| C241 | frontal rt. | parietal rt. |
| C015 | frontal rt. | parietal rt. |
| C064 | frontal rt. | parietal rt. |
| C380 | parietofrontal rt. | parietofrontal lt. |
| C393 | parietofrontal rt. | parietofrontal lt. |
| C408 | supra-cortex a. | supra-cortex p. |
| C472 | basal ganglia rt. | genu/frontal rt. |
FIGURE 5.
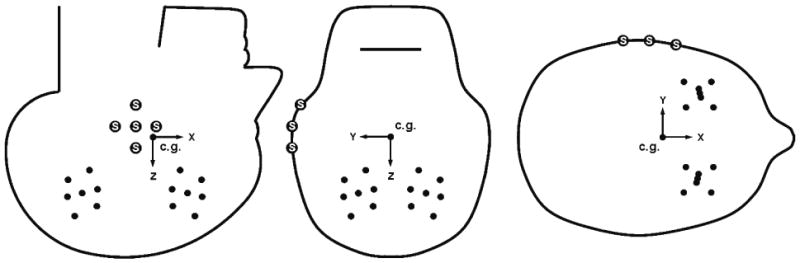
The general NDT cluster implanting schemes for tests involving impact in the median plane (left), coronal plane (center), and horizontal plane (right). There are 7 targets in each cluster. The large “S” markers are attached to the skull and define the body-fixed basis. The anatomical coordinate system is defined with its origin at the head c.g., with the positive X direction toward the face (anterior), the positive Y direction toward the left (lateral), and the positive Z direction toward the top of the head (superior).
Specimens C408 and C472 were both subjected to occipital impacts in the median plane, but each was prepared in a unique way. For specimen C408, NDTs were placed on the cortical surface, barely penetrating the meninges. One group of five targets was placed anteriorly, and one posteriorly. For specimen C472, one cluster of seven NDTs was positioned in the basal ganglia and thalamus, and one was positioned near the genu of the corpus callosum. Three additional targets were implanted less than 10 mm below the cortical surface in the right hemisphere. One was placed in the frontal lobe, one in the parietal lobe near the apex of the head, and one in the parietal lobe near the margin of the occipital lobe. Because the approaches to these regions placed the trephines and associated seals in locations that would interfere with imaging the targets, the trephines were sealed using Nylon® screws.
Testing and Instrumentation
Figure 6(a) shows a finished specimen preparation ready for testing at the Motion Analysis Laboratory of Henry Ford Hospital. The specimen is attached to the rotational subassembly fixture, and a helmet is installed. Aluminum tape is adhered to the helmet (and underlying scalp) for use in the measurement of contact with the impact block. The nine-accelerometer array is shrouded in rugged vinyl sheeting to protect the transducers from the aCSF perfusion fluid, and attached to the implanted pedestal. The compression fittings are mated to Tygon® tubing, ready for attachment to the perfusion system via quick-disconnect fittings. The preparation is ready for installation in the general impact apparatus.
FIGURE 6.
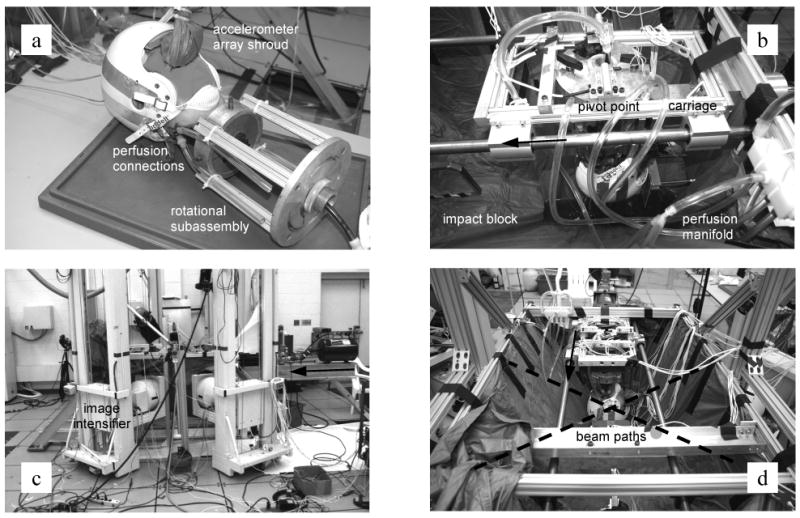
Test configuration aspects. A representative preparation (C393) with a helmet showing the specimen attached to the rotational subassembly, perfusion connections, and shrouded nine accelerometer array (a), a representative test configuration (C472) for impact in the median plane showing the carriage fixture, impact block, and perfusion system components (b), the high-speed biplane x-ray facility with the pneumatic impactor and specimen fixtures in place between the two image intensifiers (c), and a representative test configuration (C393) for impact in the coronal plane showing the aCSF containment tarpaulin and x-ray beam paths (d). The arrows indicate the direction of carriage travel.
Impact Apparatus
Figure 6(b) shows aspects of the impact apparatus. The test shown is configured for an occipital impact in the median plane. Specimen C393 and its associated rotational subassembly are shown attached to a translational carriage, which slides along the rails of a suspension fixture via linear ball bushings. This mechanism allowed the head and neck preparation to translate, as well as pivot about the subassembly attachment points. Its height and fore-aft positions were varied based upon specimen anthropometry, and specimen orientation was adjusted such that the Frankfort plane was parallel with horizontal. Sutures were strung between the head and carriage to aid in this positioning. Specimen position and orientation in the horizontal plane were adjusted depending upon the desired impact conditions. A pneumatic piston was used to bring the preparation to the desired impact speed. The piston rod was attached to an adjustable fixture that interfaced with both the carriage and the brow of the head, or helmet. Pushing the preparation in this way minimized flexure of the neck during acceleration, and helped maintain the initial conditions prior to contact with the impact block. During testing, motion of the pneumatic piston was arrested and the carriage and attached specimen preparation continued translation up to and through contact with the impact block. Motion of the carriage was arrested by contact with a padded crossbar attached to the main suspension fixture.
Perfusion System
The suspension fixture allows testing the specimens in an inverted position, which facilitates the evacuation of gasses from the intracranial space using the perfusion system. Figure 6(b) shows aspects of the perfusion system, including the manifold used to distribute aCSF to the various anatomical attachments. The aCSF originated from a vessel suspended above the preparation. Height of the vessel maintained the perfusion pressure at 10.3 kPa (75 mmHg), or approximately the average of mean arterial and venous return pressures. The aCSF passed through the head and was collected in a vinyl tarpaulin reservoir beneath the preparation. A pump was used to recirculate the aCSF up to the vessel overhead. A float valve maintained the level of aCSF in the vessel.
High-Speed Biplane X-Ray Imaging
The high-speed biplane x-ray facility is part of the Motion Analysis Laboratory of Henry Ford Hospital (Detroit, MI).
This facility, with the pneumatic piston, impact fixtures, and a specimen preparation in place are shown in Figure 6(c). Two x-ray generators and accompanying 30-cm image intensifiers are used. The x-ray generators (Shimadzu AI5765HVP) can provide continuous, non-gated beams. The image intensifiers (Shimadzu UD150B-10) have output phosphor capable of 3 kHz response. The system was operated in continuous radiographic mode using 630 mA and 90 kV during the tests. The angle between the image intensifiers was approximately 120 degrees.
Figure 6(d) shows a longitudinal perspective of the test fixtures, and specimen C393 configured for a temporal impact in the coronal plane. The x-ray beams pass through the impact zone. The generators are on the left side of the picture and the image intensifiers are on the right side of the picture.
As mentioned, two different high-speed video cameras were used to record the images from the output of the image intensifiers, both Vision Research Phantom systems. Phantom v4 cameras were used for the earlier tests. These cameras had 512×512 pixel resolution. The newer Phantom v9.1 cameras were available for more recent testing and were operated in the 1024×1024 pixel mode. Both camera systems were operated using 1000 fps with 300 microsecond exposure. Additional information regarding the nature and performance of this x-ray system using the v4 cameras is provided by Tashman and Anderst (2001).
Data Acquisition and Control
Transducer data were collected using a rate of 20,000 samples per second. Each channel was antialias filtered using a -3 dB point of 4300 Hz and an 8-pole Butterworth profile. The digital post-processing filter was a phaseless Fast-Fourier Transform (FFT) filter with pre- and post-mirroring. The filter profile was a 4th-order Butterworth low-pass filter corresponding to appropriate SAE J211channel filter classes (CFC).
Time of contact was recorded on both the transducer data acquisition system and a data collection system synchronized with the video camera image capture. A custom circuit was used to isolate the contact surfaces in the aCSF environment from the two data acquisition systems. In this way, the transducer data were time aligned with the x-ray data within 1 ms.
Data Reduction and Analyses
Head Kinematics
The head kinematics data were filtered using a CFC 180-Hz profile, as was done by Hardy et al. (2001). This reduced the influence of the resonance of the head, the kinematics array, and the kinematics array mount, and is addressed further in the Caveats section of this study. This also facilitates direct comparison with the results of Hardy et al. (2001), and elucidates the major trends of the data. Peak linear and angular acceleration and peak angular speed were calculated for each direction. Resultant linear acceleration at the head c.g. and 15-ms head injury criterion (HIC15) were evaluated also.
Intracranial Pressure
The intracranial pressure data were filtered using a CFC 1 kHz profile. The baseline was considered to be zero at contact, eliminating any effects experienced prior to contact and leaving only the pressure change due to impact. Various measures associated with pressure were calculated. Pressure pulse duration was taken as the time between the first and second points corresponding to 20 percent of the first major peak. The impulse was found by integrating pressure from contact up to the second point corresponding to 20 percent of the first major peak. Integration was performed using Simpson's rule. The peak rate of pressure was obtained by taking the time derivative of pressure up to the second point corresponding to 20 percent of the first major peak. Derivation was performed using a four-term central difference algorithm.
Target Tracking
NDT locations were determined in global three-dimensional space via an automated image enhancement and target-tracking algorithm that processed the digital video information of the two recorded oblique perspectives. Fixed pattern noise was subtracted from the images and distortion correction was applied. A multipoint cube was used to calibrate the space surrounding the impact zone. The three-dimensional coordinates were found from the intersection of rays projected from the planar perspectives. Some targets could be tracked for only a portion of each test. Short intervals of missing data were interpolated linearly or using a cubic spline.
Relative Displacement
The NDT and skull marker locations were measured with respect to an inertial frame. The NDT locations were then transformed to an arbitrary body fixed basis defined by the skull markers. Using the anatomical locations of the skull markers measured from the instrumentation radiographs, the NDT locations were transformed to the anatomical coordinate system. This procedure provided the motion of the NDTs with respect to the skull in anatomical coordinates. The NDT motion data were filtered using a CFC 60-Hz profile, as was done by Hardy et al. (2001).
Strain Parameters
Strain parameters were calculated for each NDT cluster using multiple triads of targets within each cluster. LS-DYNA (Livermore Software Technology Corporation) was used for this purpose. The number of triads was variable in time depending on the availability of tracked data for the targets that formed a given triad. Only the NDT locations for which tracking data were available starting at the time of contact were used for calculation. Figure 7 shows the NDT triad configurations used for these calculations. When the center target was available, up to twelve triads were formed within the cluster as shown on the left of Figure 7. When the center target data were missing, up to eight triads were formed on the surface of the cluster as shown on the right of Figure 7. Depending on the available target data, various combinations of the two methods were used.
FIGURE 7.
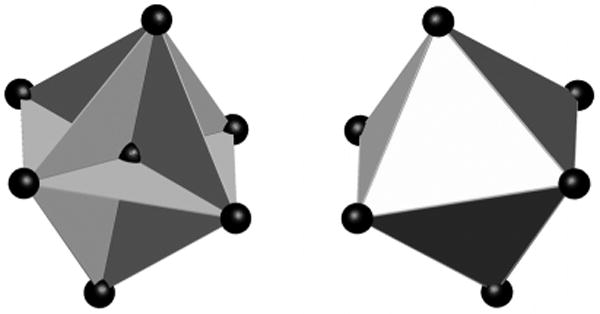
The NDT triad configurations used for maximum principal and shear strain calculation. When the center target is available, up to twelve triads are formed (left). When the center target data are missing, up to eight triads are formed (right).
Maximum principal strain and maximum shear strain were calculated using the triad data. The results from all available triads were averaged for each NDT cluster. This provides the general response within the region of each cluster, and avoids making judgment as to how to reconcile positive and negative values obtained for a given direction within a cluster. Average strain rate was obtained by taking the time derivative (four-term central difference) of the average strain responses. Strain and strain rate were calculated using unfiltered target motion data. The strain and strain rate responses were then filtered using CFC 60 Hz.
Linear Regression
Linear regression was performed to examine the relationships between many of the parameters measured or calculated as part of this study. The strength of each relationship was evaluated using the coefficient of determination, and the significance of the difference between the slope of the regression and zero was examined using one-way ANOVA to compare the sum of squares of the regression model to the sum of squares of the residuals.
Comparison of Means
The effect of the helmet on different response parameters was examined by comparison of means for experiments conducted with and without a helmet. Unpaired, two-tailed, Student's t tests were performed for this purpose. Tests were originally paired by similar impact conditions within a given cadaver series, but testing the assumption of effective pairing proved insignificant for all relationships examined. Therefore, unpaired tests were conducted to include all of the available data points. The assumption of Gaussian distribution was examined for all groups of data using the Kolmogorov-Smirnov method. All groups compared were found to be normally distributed.
Results
Thirty-five tests were conducted using eight inverted head and neck specimens prepared from human cadavers. Relative motion between the brain and skull was evaluated for the implanted NDT locations. The WSU 3-2-2-2 was used to evaluate the kinematics of the head, and intracranial pressure was measured at coup and contrecoup locations. Individual target displacements and deformations within the volumes occupied by the target clusters were examined as well.
Figure 8 and Table 4 provide the available NDT data for the first test of specimen C288 (test C288-T1), which was an aligned occipital impact. Figure 8 shows the planar brain motion patterns as described by the NDTs. The origin of the plot corresponds to the c.g. of the head. An icon at the origin indicates the head orientation. A similar head icon is present in each figure showing motion patterns in Appendix A, which catalogs the available response data from selected tests. These icons are scaled-down versions of those presented in Figure 5 for three different perspectives. As in Figure 5, each perspective is from a viewpoint looking against the third axis, in the negative direction. Therefore, the sagittal perspectives are from a viewpoint looking at the left side of the head, the coronal perspectives are looking at the face, and the horizontal perspectives are looking at the top of the head. The location (offset or aligned) and direction of impact is indicated by an arrow symbol
 adjacent the head icon at the origin. For those cases in which a helmet was used, the arrow is bounded by black lines, such as the arrow symbol
 shown in Figure 8.
FIGURE 8.

Brain motion patterns for two NDT clusters for helmeted test C288-T1 for an aligned occipital impact.
TABLE 4.
NDT tracking intervals, starting positions, and peak excursions for test C288-T1
| Cluster | C2 | C1 | |||||||||||||
|---|---|---|---|---|---|---|---|---|---|---|---|---|---|---|---|
| NDT # | 14 | 13 | 12 | 11 | 10 | 9 | 8 | 7 | 6 | 5 | 4 | 3 | 2 | 1 | |
| Interval
(ms) |
Start | 19 | 24 | 4 | 0 | 0 | 0 | 0 | 0 | 2 | 0 | 0 | 0 | 0 | 0 |
| Stop | 64 | 64 | 64 | 64 | 64 | 64 | 64 | 64 | 64 | 64 | 64 | 64 | 64 | 64 | |
|
| |||||||||||||||
| Start position
(mm) |
X | -31.30 | -33.81 | -19.81 | -26.89 | -33.99 | -20.50 | -24.84 | 7.21 | 15.02 | 5.83 | 13.41 | 21.15 | 19.51 | 12.00 |
| Y | -20.44 | -9.33 | -10.43 | -16.52 | -21.72 | -24.51 | -12.58 | -8.49 | -17.10 | -21.73 | -15.50 | -8.55 | -22.01 | -11.83 | |
| Z | 53.87 | 47.60 | 52.70 | 46.57 | 41.83 | 46.51 | 39.40 | 54.78 | 57.90 | 48.26 | 48.60 | 51.10 | 44.70 | 41.40 | |
|
| |||||||||||||||
| Peak excursion
(mm) |
X | 4.29 | 1.13 | 1.51 | 2.73 | 2.17 | 3.25 | 2.15 | 2.50 | 3.29 | 3.23 | 3.13 | 2.61 | 2.43 | 3.53 |
| 0.00 | -0.24 | -2.32 | -1.17 | -0.75 | -2.10 | -0.79 | -2.91 | -3.41 | -2.83 | -2.51 | -2.31 | -1.79 | -1.10 | ||
| Y | 1.65 | 2.77 | 1.63 | 1.17 | 1.13 | 1.14 | 1.15 | 1.47 | 1.35 | 1.17 | 1.52 | 1.77 | 1.35 | 3.26 | |
| -0.79 | -0.80 | -1.07 | -1.56 | -1.40 | -0.48 | -1.57 | -0.94 | -1.66 | -0.90 | -1.08 | -1.53 | -1.39 | -1.35 | ||
| Z | 3.08 | 1.36 | 0.73 | 1.50 | 2.18 | 1.82 | 1.45 | 1.05 | 1.26 | 1.65 | 1.68 | 1.80 | 2.66 | 1.88 | |
| -0.11 | -0.58 | -1.54 | -1.70 | -2.01 | -1.99 | -1.63 | -0.36 | -0.77 | -0.23 | -0.36 | -0.20 | -0.41 | -1.07 | ||
For each planar motion plot such as Figure 8, the NDT clusters and locations are numbered. The first cluster (C1) corresponds to the side of the head opposite to the impact, or the contrecoup side. The second cluster (C2) corresponds to the impact, or coup side of the head. For each figure, C1 appears on the right side of the plot, and C2 appears on the left side of the plot. Targets 1-7 comprise C1, and targets 8-14 comprise C2. Each odd-numbered target location is plotted in gray, and each even-numbered location is plotted in black. The target numbering is consistent within a series of tests for a given cadaver, but varies slightly between cadavers.
Not all targets are available for all tests. Further, not all targets could be tracked starting at contact, and tracking of various targets failed at different times during each test. This is partially the result of hardware attached to the head obscuring the targets from view in one or both of the video perspectives as the orientation of the head changed during impact. Overall, the local brain motions tend to follow loop or figure eight patterns. The motion patterns for impact in the median, coronal, and horizontal planes show similarities. The patterns exhibit some degree of anterior-posterior and right-left symmetry. Partial exemplar motion patterns are provided using enlarged dashed curves in Figure 8 and Appendix A for each cluster. Dots indicate the beginning portion of each curve, and arrows show direction.
Table 4 provides the NDT tracking intervals, starting positions, and peak excursions for test C288-T1. The tracking intervals are the times in milliseconds for which tracking and plotting of a given target location begins and ends. Time zero corresponds to the time of head contact with the impact block. The starting positions are the NDT locations at time zero. These positions can vary slightly from test to test because the head is moving prior to contact. If a target was not tracked starting from contact, the starting position is given as the first available location. The peak excursions along each axis represent the difference between the maximal positive and negative displacements and the starting locations. For each planar motion plot in Appendix A, the associated tracking information is presented in a table similar to Table 4. The average total peak excursions (sum of plus and minus motion) in the direction of impact ranged from 1.9 to 13.4 mm for these tests.
Figure 9 provides graphical presentation of the head kinematics and intracranial pressure responses for C288-T1. Linear acceleration and angular acceleration components, angular speed components, and intracranial pressure responses are plotted. Similar figures in Appendix A provide these responses for additional selected tests.
FIGURE 9.

The head responses from test C288-T1 (aligned occipital impact with a helmet): Linear accelerations (upper left), angular accelerations (upper right), angular speeds (lower left), and pressure response (lower right).
Figure 10 shows the brain displacement and deformation responses for test C288-T1. The relative displacement of the brain with respect to the skull is shown for the major plane of impact (e.g. in the X and Z directions for test C288-T1). Typically, motion is shown for the NDTs located at the center of each cluster, which generally corresponds to NDT 4 for C1 and NDT 11 for C2. If the center NDT is not available, a neighboring NDT location is plotted. The average maximum principal strain and the average maximum shear strain are given for each cluster also. In general, the maximum shear responses follow the maximum principal strain responses. Similar figures in Appendix A provide these responses for the remainder of the tests.
FIGURE 10.

The brain responses from test C288-T1 (aligned occipital impact with a helmet): Typical relative displacement time histories referred to starting positions (left), and average maximum principal and shear strain time histories (right).
Table 5 catalogs the peak head kinematics for all tests (CFC 180 Hz). There are no data for series C472. The average linear speed was 3.5 ± 0.3 m/s. The peak linear acceleration in the direction of impact ranged from 29 to 190 g. Resultant linear acceleration at the head c.g. ranged from 38 to 291 g. The corresponding HIC15 values ranged from 37 to 959. Angular acceleration in the impact plane spanned an order of magnitude, from 2,370 to 24,206 rad/s/s. However, angular speed varied less, averaging 20.3 ± 5.7 rad/s. The peak head kinematics processed using CFC 1 kHz are cataloged in Table B1, in Appendix B.
TABLE 5.
Peak head kinematics responses (CFC 180 Hz)
| Specimen and test | Speed
(m/s) |
Linear acceleration
(g) |
Res.
(g) |
HIC 15ms | Angular acceleration
(rad/s/s) |
Angular speed
(rad/s) |
|||||||
|---|---|---|---|---|---|---|---|---|---|---|---|---|---|
| X | Y | Z | X | Y | Z | X | Y | Z | |||||
| C288 | T1 | 3.3 | 83 | 8 | 20 | 86 | 181 | 1984 | 3655 | 3099 | 4 | 16 | 4 |
| -14 | -32 | -20 | -746 | -3096 | -3377 | -1 | -2 | -6 | |||||
| T2 | 3.0 | 34 | 16 | 20 | 38 | 51 | 825 | 3494 | 1343 | 2 | 17 | 4 | |
| -10 | -22 | -21 | -866 | -2614 | -3770 | -2 | -12 | -6 | |||||
| T3 | 3.5 | 91 | 53 | 158 | 236 | 580 | 5377 | 24206 | 2743 | 7 | 29 | 7 | |
| -33 | -28 | -110 | -7531 | -11798 | -10270 | -4 | -8 | -6 | |||||
| T4 | 3.0 | - | - | - | - | - | - | - | - | - | - | - | |
| - | - | - | - | - | - | - | - | - | |||||
|
| |||||||||||||
| C241 | T1 | 3.6 | 129 | 19 | 119 | 174 | 959 | 4291 | 17616 | 7188 | 5 | 22 | 5 |
| -13 | -54 | -118 | -4515 | -16562 | -4380 | -3 | -19 | -4 | |||||
| T2 | 3.2 | 104 | 21 | 64 | 140 | 430 | 2145 | 11552 | 4076 | 2 | 29 | 0 | |
| -16 | -30 | -102 | -3744 | -13249 | -4174 | -9 | -15 | -8 | |||||
| T3 | 3.5 | 53 | 10 | 21 | 80 | 97 | 624 | 2629 | 1221 | 0 | 17 | 0 | |
| -4 | -15 | -60 | -1218 | -3710 | -1621 | -8 | -7 | -4 | |||||
| T4 | 3.5 | 58 | 10 | 34 | 70 | 117 | 795 | 3162 | 1090 | 2 | 25 | 5 | |
| -4 | -4 | -46 | -1330 | -3128 | -1960 | -11 | -8 | -7 | |||||
| T5 | 3.7 | 172 | 27 | 49 | 194 | 450 | 2377 | 8688 | 3537 | 9 | 13 | 3 | |
| -47 | -30 | -39 | -3648 | -6068 | -5445 | -2 | -11 | -11 | |||||
| T6 | 3.3 | 106 | 7 | 57 | 127 | 232 | 2398 | 4385 | 2484 | 9 | 10 | 0 | |
| -7 | -35 | -21 | -2121 | -5792 | -2957 | -1 | -4 | -13 | |||||
|
| |||||||||||||
| C015 | T1 | 3.6 | 114 | 15 | 24 | 107 | 243 | 3181 | 7975 | 4702 | 9 | 14 | 9 |
| -8 | -36 | -62 | -2101 | -7925 | -1380 | 0 | -13 | 0 | |||||
| T2 | 3.8 | 151 | 9 | 12 | 169 | 385 | 3627 | 6911 | 2802 | 6 | 16 | 10 | |
| -10 | -24 | -79 | -2180 | -7956 | -1422 | -1 | -14 | -1 | |||||
|
| |||||||||||||
| C064 | T1 | 3.9 | 87 | 8 | 21 | 101 | 255 | 25 | 4954 | 3606 | 0 | 10 | 5 |
| -11 | -47 | -10 | -183 | -3459 | -2112 | -1 | -8 | -1 | |||||
| T2 | 3.9 | 52 | 19 | 46 | 64 | 120 | 131 | 4234 | 2151 | 0 | 23 | 5 | |
| -27 | -30 | -30 | -114 | -3283 | -1511 | -2 | -9 | 0 | |||||
| T3 | 3.9 | 83 | 76 | 105 | 162 | 491 | 1817 | 15384 | 4822 | 2 | 18 | 8 | |
| -13 | -67 | -72 | -2778 | -5727 | -6902 | -3 | -25 | -5 | |||||
| T4 | 3.9 | 106 | 19 | 37 | 122 | 245 | 1056 | 4456 | 2458 | 1 | 10 | 5 | |
| -24 | -19 | -35 | -651 | -3952 | -1518 | 0 | -16 | -6 | |||||
|
| |||||||||||||
| C380 | T1 | - | 13 | 8 | 10 | 87 | 158 | 5103 | 912 | 5015 | 30 | 3 | 13 |
| -10 | -84 | -20 | -2739 | -1990 | -3166 | -9 | -5 | -4 | |||||
| T2 | 3.7 | 35 | 12 | 8 | 66 | 71 | 3752 | 1249 | 5069 | 21 | 14 | 18 | |
| -6 | -56 | -16 | -1724 | -1000 | -1727 | -12 | 0 | 0 | |||||
| T3 | 3.2 | 15 | 4 | 7 | 78 | 129 | 4669 | 666 | 4619 | 22 | 2 | 14 | |
| -9 | -76 | -21 | -1947 | -1753 | -3203 | -5 | -2 | 0 | |||||
| T4 | 3.5 | 27 | 66 | 33 | 196 | 729 | 14962 | 3354 | 12710 | 28 | 6 | 26 | |
| -48 | -190 | -33 | -4651 | -3829 | -10036 | -7 | -5 | -1 | |||||
| T5 | 3.1 | 46 | 18 | 13 | 77 | 54 | 3183 | 1448 | 6358 | 14 | 14 | 20 | |
| -9 | -62 | -14 | -1789 | -1110 | -1446 | -13 | -6 | -8 | |||||
| T6 | 3.3 | 18 | 36 | 31 | 147 | 421 | 9547 | 3036 | 9797 | 23 | 8 | 24 | |
| -33 | -144 | -30 | -1867 | -3988 | -6578 | -5 | -6 | 0 | |||||
|
| |||||||||||||
| C393 | T1 | 3.6 | 15 | 5 | 13 | 91 | 203 | 4090 | 1081 | 5309 | 20 | 2 | 15 |
| -3 | -91 | -11 | -942 | -1196 | -3868 | -3 | -4 | -2 | |||||
| T2 | 3.6 | 8 | 4 | 16 | 43 | 37 | 3749 | 2196 | 2128 | 24 | 12 | 11 | |
| -5 | -39 | -18 | -2316 | -1925 | -1145 | -18 | -4 | -2 | |||||
| T3 | 3.7 | 24 | 72 | 25 | 159 | 437 | 11584 | 1925 | 10302 | 23 | 4 | 22 | |
| -8 | -140 | -38 | -4405 | -5012 | -10425 | -2 | -5 | -1 | |||||
| T4 | 3.6 | 31 | 32 | 44 | 180 | 221 | 9671 | 5033 | 8844 | 28 | 10 | 14 | |
| -11 | -113 | -80 | -2118 | -5361 | -7676 | -18 | -9 | 0 | |||||
|
| |||||||||||||
| C408 | T1 | 2.9 | 62 | 5 | 16 | 76 | 113 | 2132 | 2370 | 3668 | 6 | 12 | 6 |
| -5 | -42 | -37 | -912 | -2210 | -4400 | -8 | -3 | -9 | |||||
| T2 | 3.0 | 29 | 23 | 15 | 56 | 73 | 1649 | 5379 | 1631 | 2 | 20 | 0 | |
| -8 | -19 | -66 | -3404 | -4557 | -4297 | -5 | -10 | -8 | |||||
| T3 | 3.1 | 43 | 21 | 11 | 79 | 95 | 1689 | 5980 | 2584 | 5 | 22 | 3 | |
| 0 | -27 | -71 | -1105 | -3852 | -3643 | 0 | -4 | -7 | |||||
| T4 | 3.1 | 154 | 111 | 63 | 291 | 836 | 2252 | 7506 | 7158 | 4 | 21 | 8 | |
| -32 | -85 | -134 | -2800 | -6833 | -14800 | 0 | -4 | -13 | |||||
| T5 | 3.0 | 127 | 74 | 44 | 262 | 458 | 8161 | 7418 | 7010 | 11 | 16 | 11 | |
| -31 | -62 | -98 | -4669 | -9352 | -13881 | -4 | -11 | -13 | |||||
Not all kinematics are available for all tests. For example, the nine-accelerometer array was damaged after test C288-T3, so no kinematics data were collected for test C288-T4. The nine-accelerometer array separated from its mount during test C472-T1. Since the mount was damaged, there are no kinematics data for the entire C472 test series.
Table 6 catalogs the peak intracranial pressure responses for all tests (CFC 1 kHz). There are no data for series C472. The peak coup pressure ranged from 21 to 153 kPa, while the peak contrecoup pressure ranged from -163 to 54 kPa. Contrecoup pressure was often biphasic, with a positive region following an initial negative pulse. In other cases, the pressure transducer was not positioned in a true contrecoup location when the impact alignment was changed between tests (e.g. from aligned to offset, and from coronal to horizontal conditions). Primarily positive pressures were measured for these cases. The rate of change of coup and contrecoup pressure ranged from 6.4 to 179.4 kPa/ms and -629.2 to 65.0 kPa/ms, respectively. The coup and contrecoup pressure durations ranged from 2.0 to 73.7 ms and 1.0 to 76.9 ms, respectively. The coup pressure impulse ranged from 59.0 to 867.2 kPa*ms. The impulse ranged from -475.0 to 328.4 kPa*ms for contrecoup pressure.
Table 6.
Peak intracranial pressure responses (CFC 1 kHz)
| Specimen and test | Coup pressure | Contrecoup pressure | |||||||
|---|---|---|---|---|---|---|---|---|---|
| Amplitude
(kPa) |
Rate
(kPa/ms) |
Duration
(ms) |
Impulse
(kPa*ms) |
Amplitude
(kPa) |
Rate
(kPa/ms) |
Duration
(ms) |
Impulse
(kPa*ms) |
||
| C288 | T1 | 55.9 | 32.2 | 7.3 | 238.7 | - | - | - | - |
| T2 | 33.6 | 15.9 | 26.7 | 506.2 | - | - | - | - | |
| T3 | 21.4 | 9.4 | 45.4 | 590.1 | - | - | - | - | |
| T4 | 31.4 | 30.9 | 4.1 | 100.1 | - | - | - | - | |
|
| |||||||||
| C241 | T1 | 85.0 | 72.9 | 9.7 | 480.5 | -39.9 | -76.2 | 7.3 | -198.4 |
| T2 | 64.5 | 50.3 | 15.0 | 705.8 | -162.9 | -629.2 | 1.0 | -110.3 | |
| T3 | 80.6 | 39.0 | 73.7 | 275.0 | 53.8 | 32.3 | 76.9 | 217.0 | |
| T4 | 79.6 | 32.6 | 25.0 | 121.6 | 49.3 | 65.0 | 33.6 | 100.8 | |
| T5 | 153.4 | 179.4 | 3.9 | 296.0 | -32.9 | -47.0 | 3.9 | -50.5 | |
| T6 | 56.5 | 75.8 | 31.3 | 867.2 | -40.7 | -44.3 | 3.4 | -102.8 | |
|
| |||||||||
| C015 | T1 | 52.2 | 34.3 | 11.4 | 321.2 | -58.5 | -35.2 | 4.4 | -173.0 |
| T2 | 76.2 | 63.3 | 12.6 | 492.9 | -68.1 | -52.1 | 4.5 | -174.4 | |
|
| |||||||||
| C064 | T1 | - | - | - | - | -75.2 | -40.0 | 10.4 | -475.0 |
| T2 | - | - | - | - | -27.5 | -18.6 | 9.1 | -142.0 | |
| T3 | - | - | - | - | -52.4 | -59.5 | 5.1 | -178.4 | |
| T4 | - | - | - | - | -94.0 | -117.8 | 4.2 | -308.8 | |
|
| |||||||||
| C380 | T1 | - | - | - | - | 18.8 | 22.7 | 17.8 | 204.1 |
| T2 | - | - | - | - | 18.6 | 9.7 | 11.4 | 147.0 | |
| T3 | - | - | - | - | 24.7 | 18.5 | 24.4 | 328.4 | |
| T4 | - | - | - | - | 30.8 | 49.9 | 1.7 | 26.4 | |
| T5 | - | - | - | - | 12.0 | 13.8 | 2.2 | 18.2 | |
| T6 | - | - | - | - | 18.8 | 27.8 | 2.0 | 18.1 | |
|
| |||||||||
| C393 | T1 | 27.0 | 7.1 | 18.7 | 286.5 | - | - | - | - |
| T2 | 32.8 | 6.4 | 24.0 | 511.0 | - | - | - | - | |
| T3 | 60.2 | 91.6 | 2.0 | 59.0 | - | - | - | - | |
| T4 | 85.8 | 143.9 | 9.3 | 333.1 | - | - | - | - | |
|
| |||||||||
| C408 | T1 | - | - | - | - | -29.0 | -16.9 | 4.8 | -93.0 |
| T2 | - | - | - | - | -14.2 | -9.1 | 3.0 | -28.2 | |
| T3 | - | - | - | - | -22.6 | -11.3 | 3.6 | -55.3 | |
| T4 | - | - | - | - | -50.7 | -90.3 | 2.5 | -83.9 | |
| T5 | - | - | - | - | -61.1 | -107.1 | 3.0 | -101.9 | |
Table 7 catalogs the peak average maximum strain responses (CFC 60 Hz) for both NDT clusters for all tests. The greatest overall average maximum principal strain was 0.088 and the greatest average maximum shear strain was 0.089. The greatest overall average maximum principal strain rate was 93.4 s-1 and the greatest average maximum shear strain rate was 111.6 s-1. The greatest overall strain and strain rate products were 1.293 and 1.131 for average maximum principal and shear strain, respectively. Table C1 in Appendix C catalogs the peak average strain responses processed using CFC 180 Hz, which is the highest channel class filtering that can be imposed on these data (1 kfps).
Table 7.
Peak average maximum strain responses of the brain (CFC 60 Hz)
| Specimen and test | Strain | Strain rate (s-1) | Strain * rate (s-1) | ||||||||||
|---|---|---|---|---|---|---|---|---|---|---|---|---|---|
| Principal | Shear | Principal | Shear | Principal | Shear | ||||||||
| C2 | C1 | C2 | C1 | C2 | C1 | C2 | C1 | C2 | C1 | C2 | C1 | ||
| C288 | T1 | 0.033 | 0.032 | 0.038 | 0.029 | 54.9 | 20.1 | 111.6 | 67.1 | 0.480 | 0.129 | 1.086 | 0.542 |
| T2 | 0.062 | 0.044 | 0.057 | 0.044 | 13.3 | 9.9 | 14.0 | 10.9 | 0.563 | 0.299 | 0.477 | 0.296 | |
| T3 | 0.033 | 0.071 | 0.035 | 0.029 | 58.1 | 23.9 | 40.1 | 11.8 | 0.376 | 0.448 | 0.203 | 0.150 | |
| T4 | 0.078 | 0.027 | 0.039 | 0.041 | 32.5 | 13.2 | 78.8 | 27.2 | 0.930 | 0.111 | 0.714 | 0.254 | |
|
| |||||||||||||
| C241 | T1 | - | - | - | - | - | - | - | - | - | - | - | - |
| T2 | 0.067 | - | 0.055 | - | 14.4 | - | 9.6 | - | 0.729 | - | 0.414 | - | |
| T3 | 0.027 | - | 0.015 | - | 10.0 | - | 6.9 | - | 0.121 | - | 0.031 | - | |
| T4 | - | - | - | - | - | - | - | - | - | - | - | - | |
| T5 | 0.014 | 0.030 | 0.015 | 0.029 | 24.1 | 29.7 | 17.5 | 52.3 | 0.046 | 0.219 | 0.030 | 0.408 | |
| T6 | 0.018 | 0.019 | 0.032 | 0.018 | 19.0 | 3.7 | 15.2 | 25.4 | 0.080 | 0.039 | 0.077 | 0.121 | |
|
| |||||||||||||
| C015 | T1 | 0.065 | 0.033 | 0.034 | 0.027 | 14.1 | 7.1 | 15.5 | 10.3 | 0.697 | 0.083 | 0.113 | 0.554 |
| T2 | - | - | - | - | - | - | - | - | - | - | - | - | |
|
| |||||||||||||
| C064 | T1 | 0.066 | 0.033 | 0.055 | 0.027 | 21.6 | 36.7 | 50.3 | 28.7 | 0.532 | 0.248 | 0.620 | 0.173 |
| T2 | 0.083 | 0.019 | 0.077 | 0.015 | 22.8 | 6.2 | 28.3 | 5.3 | 1.293 | 0.047 | 1.131 | 0.028 | |
| T3 | - | - | - | - | - | - | - | - | - | - | - | - | |
| T4 | 0.013 | 0.021 | 0.010 | 0.019 | 5.8 | 21.3 | 3.9 | 22.7 | 0.027 | 0.102 | 0.012 | 0.097 | |
|
| |||||||||||||
| C380 | T1 | 0.034 | 0.025 | 0.029 | 0.041 | 68.4 | 36.8 | 52.9 | 34.8 | 0.291 | 0.201 | 0.192 | 0.156 |
| T2 | 0.027 | 0.030 | 0.025 | 0.024 | 27.5 | 5.1 | 15.4 | 4.9 | 0.172 | 0.103 | 0.110 | 0.068 | |
| T3 | 0.036 | 0.029 | 0.038 | 0.043 | 54.2 | 23.6 | 35.6 | 14.8 | 0.212 | 0.094 | 0.138 | 0.157 | |
| T4 | 0.024 | 0.019 | 0.022 | 0.015 | 9.2 | 17.3 | 16.6 | 17.1 | 0.101 | 0.059 | 0.069 | 0.051 | |
| T5 | 0.035 | 0.022 | 0.032 | 0.018 | 58.2 | 40.8 | 47.0 | 27.6 | 0.419 | 0.217 | 0.307 | 0.120 | |
| T6 | 0.028 | 0.020 | 0.023 | 0.018 | 52.0 | 33.4 | 46.6 | 26.5 | 0.262 | 0.145 | 0.209 | 0.100 | |
|
| |||||||||||||
| C393 | T1 | 0.088 | 0.030 | 0.089 | 0.036 | 93.4 | 26.7 | 60.3 | 42.4 | 0.567 | 0.229 | 0.452 | 0.311 |
| T2 | 0.088 | 0.029 | 0.077 | 0.026 | 18.2 | 56.1 | 25.0 | 44.4 | 1.124 | 0.391 | 0.836 | 0.292 | |
| T3 | 0.020 | 0.029 | 0.022 | 0.027 | 29.3 | 19.4 | 24.5 | 15.6 | 0.154 | 0.099 | 0.109 | 0.074 | |
| T4 | 0.026 | 0.025 | 0.021 | 0.021 | 38.1 | 24.8 | 19.9 | 24.3 | 0.145 | 0.083 | 0.072 | 0.065 | |
|
| |||||||||||||
| C408 | T1 | - | - | - | - | - | - | - | - | - | - | - | - |
| T2 | - | - | - | - | - | - | - | - | - | - | - | - | |
| T3 | - | 0.015 | - | 0.013 | - | 17.5 | - | 14.5 | - | 0.057 | - | 0.043 | |
| T4 | - | 0.020 | - | 0.015 | - | 21.5 | - | 2.4 | - | 0.436 | - | 0.026 | |
| T5 | - | 0.024 | - | 0.021 | - | 15.3 | - | 13.9 | - | 0.049 | - | 0.042 | |
|
| |||||||||||||
| C472 | T1 | 0.018 | 0.018 | 0.016 | 0.032 | 20.2 | 15.1 | 14.6 | 14.5 | 0.064 | 0.041 | 0.044 | 0.103 |
| T2 | 0.015 | 0.015 | 0.013 | 0.013 | 26.4 | 23.5 | 24.5 | 16.5 | 0.085 | 0.080 | 0.065 | 0.051 | |
| T3 | 0.011 | 0.011 | 0.010 | 0.009 | 6.9 | 18.3 | 14.3 | 11.8 | 0.018 | 0.048 | 0.032 | 0.027 | |
| T4 | 0.012 | 0.012 | 0.011 | 0.010 | 11.7 | 18.7 | 9.6 | 11.6 | 0.114 | 0.063 | 0.051 | 0.018 | |
Table 8 compares peak coup pressure responses to peak linear acceleration in the direction of impact and peak angular acceleration in the plane of impact. Linear regression was performed, and the significance of the difference of the slope from zero was evaluated. Peak coup pressure, rate, and duration were found to vary significantly with linear acceleration. Coup pressure impulse was not found to vary significantly with linear acceleration. No pressure parameters were found to vary significantly with angular acceleration.
TABLE 8.
Peak coup pressure responses compared to peak linear and angular acceleration
| Peak
(kPa) |
Rate
(kPa/ms) |
Duration
(ms) |
Impulse
(kPa*ms) |
||||||
|---|---|---|---|---|---|---|---|---|---|
| Acceleration | r2 | p | r2 | p | r2 | p | r2 | p | |
| Linear | (g) | 0.3459 | 0.0211 | 0.5299 | 0.0021 | 0.3393 | 0.0227 | 0.0024 | 0.8622 |
| Angular | (r/s/s) | 0.0009 | 0.9134 | 0.0171 | 0.6425 | 0.0027 | 0.8536 | 0.0758 | 0.3208 |
Bold typeface indicates significant relationship
Figure 11 shows graphically the linear regression analyses described in Table 8. Figure 11(a) shows that peak coup pressure increases with increasing linear acceleration in the direction of impact. Figure 11(c) shows that the peak rate of change of coup pressure increases with increasing linear acceleration also. Accordingly, Figure 11(e) shows that coup pressure duration decreases with increasing linear acceleration. No relationships with angular acceleration were found, as evidenced by the nearly zero slopes of the regressions.
FIGURE 11.

Linear regression analyses comparing: Peak coup pressure to peak linear acceleration (a) and peak angular acceleration (b), peak rate of change of coup pressure to linear acceleration (c) and peak angular acceleration (d), and coup pressure duration to peak linear acceleration (e) and peak angular acceleration (f).
Table 9 shows the linear regression results for peak NDT cluster C2 (coup side) strain responses compared to acceleration and pressure responses. Significant relationships were found between peak average maximum principal strain and linear acceleration in the direction of impact, coup pressure, and coup pressure rate. Accordingly, similar relationships were found for peak average maximum shear strain. No strain parameters were found to vary significantly with angular acceleration.
TABLE 9.
Peak average maximum C2 (coup side) strain responses compared to acceleration and pressure responses
| Strain | Rate (s-1) | ||||||||
|---|---|---|---|---|---|---|---|---|---|
| Principal | Shear | Principal | Shear | ||||||
| r2 | p | r2 | p | r2 | p | r2 | p | ||
| Linear acceleration | (g) | 0.2335 | 0.0265 | 0.2379 | 0.0249 | 0.0064 | 0.7306 | 0.0087 | 0.6792 |
| Angular acceleration | (r/s/s) | 0.0608 | 0.2814 | 0.0617 | 0.2776 | 0.0014 | 0.8740 | 0.0168 | 0.5751 |
| Coup pressure | (kPa) | 0.3771 | 0.0256 | 0.3893 | 0.0227 | 0.1008 | 0.2906 | 0.1063 | 0.2769 |
| Coup pressure rate | (kPa/s) | 0.4496 | 0.0121 | 0.4197 | 0.0183 | 0.0441 | 0.4910 | 0.0947 | 0.3063 |
Bold typeface indicates significant relationship
Figure 12 shows graphically the linear regression analyses described in Table 9. As shown, peak average maximum principal strain decreases with increasing linear acceleration, coup pressure, and coup pressure rate. No relationship to angular acceleration was found, as evidenced by the insignificant slope (approaching zero) as shown. The relationships for peak average maximum shear strain are not plotted as the results are nearly identical to those for average maximum principal strain.
FIGURE 12.

Linear regression analyses comparing peak average maximum principal and shear strain to: Linear acceleration (a), angular acceleration (b), peak coup pressure (c), and peak rate of coup pressure change (d).
Discussion
These responses are indicative of those described by Hardy et al. (2001), and are most easily interpreted visually with respect to angular speed. As the head begins to rotate, the local brain tissue tends to keep its position and shape with respect to the inertial frame, causing relative motion between the brain and skull. As the head rotation slows, reaches steady state, or changes direction, the brain motion will surpass that of the skull.
Brain Displacement and Deformation Considerations
As early as 1974, Shatsky et al. demonstrated 2 to 3 mm relative motion between the cerebral vasculature and the skull. Stretch between the anterior cerebral artery at the midline and the lateral aspect of the skull was estimated to be on the order of 0.086 ± 0.019. Nusholtz et al. (1984) demonstrated up to 6 mm relative motion between the brain and skull for a case involving skull fracture. Hardy et al. (1997) observed 3 to 5 mm resultant relative motion using triaxial NDAs, and provided the first estimates of stretch (5 to 7 percent) within a cluster of NDTs for low-speed impacts. Similarly, Al-Bsharat et al. (1999) recorded approximately 3-mm resultant relative displacement using columns of NDTs for low-speed impacts.
Hardy et al. (2001) used this column approach to investigate a series of head impacts. The resulting relative motion between the brain and skull was on the order of ± 5 mm. Ji et al. (2004) showed up to 4.3 degrees of rotation for the cerebellum under voluntary motion in human volunteers using MRI, and Bayly et al. (2005) found strain ranging from 0.02 to 0.05 for low-level head acceleration (2 to 3 g) in human volunteers using a similar technique.
The average total excursions in the direction of impact ranged from 1.9 to 13.4 mm for this current study. Average maximum principal strain and shear strain reached 0.09. The displacement and strain data from these higher-level impact tests are greater than those of tests using human volunteers, as expected. These values are in keeping with earlier cadaver and subhuman primate tests, however.
In addition to the use of NDT clusters instead of NDT columns, this study differs from that of Hardy et al. (2001) in three other important ways. First, the NDT locations in the 2001 study were deeper (more inferior or closer to the Frankfort plane) that those used for this study. Typically, the NDTs were implanted within 50 mm of the Frankfort plane, some of them being inferior to the plane. The NDT locations used in the current study were further from the c.g. of the head. The centers of the NDT clusters were usually no closer than 50 mm to the Frankfort plane. Some targets were implanted up to 75 mm from the c.g. of the head. This is important because the orientation and direction of the motion patterns begin to change between 40 and 50 mm from the c.g., as shown in the 2001 study. This complicates direct comparison of individual traces from the two studies. Second, this current study involved impact in the coronal and horizontal planes, which the 2001 study did not. Further, this study did not involve impact to the frontal region, which was a large part of the 2001 study. Lastly, many tests in this current study involved the use of a football helmet.
This current study is similar to that of Hardy et al. (2001) in terms of the level of energy input to the specimens. Identical impact apparatus were used for both efforts, under similar conditions. These tests represent low-speed impact (3.5 ± 0.3 m/s). The angular speeds from these tests are moderate as well (20.3 ± 5.7 rad/s). The angular speeds measured by Hardy et al. (2001) fall within the same range, measuring from 17 to 22 rad/s. This likely accounts for a number of the similarities between the two studies, as well as similarities between individual tests within either study.
Relationships between Brain and Skull Kinematics
Figure 13(a) shows the trends for select kinematics responses for test C064-T2, which was an occipital blow resulting in sagittal rotation. The relationships between linear head acceleration in the X direction, angular speed of the head about the Y axis, brain motion in the X direction, and average maximum shear strain for NDT cluster C2 are shown. The units are arbitrary for comparison of trends. Initially, the head experiences slight rearward rotation, and then near 6 ms begins the dominant motion, which was forward rotation. At the onset of this initial motion, relative brain displacement and deformation begin. Substantial shear is registered near the time of peak linear acceleration, which coincides with the time of the initial peak rearward rotation (5 ms). Little relative displacement has occurred by this time however, and the brain displacement lags the initial motion of the skull. As the speed and magnitude of forward head rotation increase during the interval from 6 to 17 ms, the relative brain displacement reverses direction to become negative (10 ms) and the shear strain exhibits a local maximum (15 ms). As the speed of forward rotation peaks (17 ms), the relative displacement continues to increase. The relative displacement peaks (20 ms) as the rotational speed decreases to a plateau. During this plateau (20-35 ms), the relative displacement decreases, as the brain returns to the neutral position. At the end of the speed plateau, the angular speed increases again to a local maximum (40 ms) and then decreases, changing direction near 53 ms. The displacement begins to deviate from neutral and becomes positive during the slowing of head rotation. The shear strain exhibits a local maximum as the displacement becomes increasingly positive and the angular speed crosses zero (53 ms). The relative displacement crests as the angular speed reaches a negative plateau (62 ms). During this plateau (62 ms onward) the brain returns to neutral (90 ms). In general, the shear response increased as the brain moved away from neutral (not toward neutral), and the relative displacement peaked as the angular speed reached steady state (local plateaus) for this test. After steady-state rotation for roughly 15 ms the brain returns to neutral. The influence of linear acceleration on rotational speed can be seen as well for this test, in which the impact point was offset from the c.g. of the head.
FIGURE 13.

Comparison of kinematics trends for tests C064-T2 (a) and C380-T1 (b). Parameters compared are linear acceleration, angular speed, C2 relative displacement, and average maximum strain parameters.
Figure 13(b) shows the trends for select kinematics responses for test C380-T1, which was a temporal blow resulting in coronal rotation. The relationships between linear head acceleration in the Y direction, angular speed of the head about the X axis, brain motion in the Y direction, and average maximum principal strain for NDT cluster C2 are shown. Again, the units are arbitrary. The linear acceleration pulse in the direction of impact peaks near 5 ms and ends near 11 ms. The angular speed of the head increases to its maximum near 20 ms, which is the start of a short (2 to 3 ms) plateau. The relative brain displacement follows the angular speed trend, and peaks near 20 ms. The average maximum principal strain exhibits a local maximum during this increase in angular speed and relative displacement (18 ms). The displacement then begins to decrease indicating a return toward neutral for the brain. As the angular speed decreases, the relative displacement passes through neutral (32 ms), and overshoots the motion of the skull. As the displacement crosses zero, a local maximum in the strain response occurs. Relative brain motion in the opposite direction peaks at the time angular speed changes direction (43 ms). As the angular speed becomes more negative, the brain again tends toward neutral. The brain reaches its neutral configuration as the angular speed reaches a negative plateau (62 ms). The brain then oscillates about its neutral position. In general, the strain response increased as the relative displacement increased or decreased. The relative displacement peaked as the angular speed peaked or crossed zero, and returned to neutral at the start of steady state rotation.
Falx Cerebri
In their early work with translucent calvaria, Pudenz and Sheldon (1946) noted lag between the brain and skull for cases involving sagittal rotation, but little lag for cases of coronal rotation. This qualitative observation was said to be related to constraint provided by the falx cerebri in coronal rotation. However, this observation was made from an inertial reference frame. In the inertial frame, motion of the cortex would appear to coincide more with the motion of the skull for coronal rotation, a phenomenon that would be interpreted as less lag between the brain and skull. Conversely, in the anatomical frame relative motion between the brain and skull would begin later in the impact event due to the greater initial coupling between the brain and skull afforded by the falx. This would appear as greater lag between the brain and skull. As shown in Figure 13, the relative brain motion begins immediately for impact in the median plane (a), but starts a few milliseconds later for impact in the coronal plane (b). For the current study, differences in the timing of other trends might be related more to the nature of the angular speed. For example, the angular speed from test C064-T2 in Figure 13(a) can be approximated as a positive-going step followed by a negative-going step some time later. The angular speed from test C380-T1 in Figure 13(b) can be described as having a half-sine shape.
The falx might play a role in some of the responses noted in this study, but its real influence is unknown. That noted, differences in the shape of the brain motion patterns on either side of the falx are evident. Figure A16 and the like show the motion patterns for test series C380, which involves coronal rotation. The coup side traces (C2) are characterized by larger, more open loop patterns in the sagittal perspective. Figure A34 shows the motion patterns for test C393-T4 from a series that also involves coronal rotation. However, for this test, traces on the contrecoup side (C1) are characterized by larger, more open loop patterns. Figure A19 shows the motion patterns for test C380-T2, which involves horizontal rotation. As for the coronal tests in the C380 test series, the coup side traces appear more open. This phenomenon seems to be related to proximity to the falx. For the C380 series, cluster C2 is positioned closer to the midline than cluster C1. Conversely, cluster C1 is positioned closer to the midline for series C393. In each case, the NDT cluster closer to the falx cerebri describes motion patterns having loops that are more rounded instead of elongated. The significance of this response is unknown.
Motion of the Cortex and Deep Brain
For a tightly coupled incompressible system, infinitesimal relative motion should be expected between the brain and skull for linear input to the head (in the absence of skull deformation). For rotational input, the relative motion can be characterized as having whole brain (rigid body) and local deformation (strain) components. Zou et al. (2007) showed that the relative motion observed by Hardy et al. (2001) was primarily rigid-body in nature for low speed tests. Roughly 4 to 5 mm of relative whole-brain displacement was associated with approximately ± 5 degrees of whole-brain rotation. As impact severity increased, the strain components increased, representing a larger proportion of the overall relative displacement. Whole-brain motion suggests relative motion between the dura and arachnoid. However, the targets tracked by Hardy et al. (2001) were implanted deep within the brain and typically don't describe what is happening at this interface.
Nusholtz et al. (1984) discussed the possibility of a “stick-slip” response to describe the difference between tests that seemed to show only deformation of the brain, and those that seemed to show motion between the brain and skull at the level of the meninges. Local skull accelerations, particularly those resulting in fracture, were said to be capable of initiating slip between the brain and skull.
Two tests series within this study were designed to examine relative motion at or near the cortex of the brain. Specimen C408 had NDTs implanted such that they followed the surface of the cortex. Specimen C472 had NDTs implanted approximately 10 mm below the cortex. Specimen C383 from the work of Hardy et al. (2001) had an NDT implanted near the tentorium (target “p1”). This test was an occipital blow in the median plane, and did not involve a helmet. Figure 14(a) compares the relative X-direction motion for an NDT location on the cortex from test C408-T4, to an NDT location just above the tentorium from test C383-T4, and an NDT location just below the cortex from test C472-T3. The data from the C408 and C383 tests indicate relative motion at the brain/skull interface to be on the order of 9 to 11 mm. However, subcortical response from the C472 series shows only 2 to 3 mm of relative displacement. It seems unlikely that there should be such a substantial difference between the response on the cortex and just below the cortex. This might be related to the fact that the targets in the C472 series were implanted relatively close to the midline, where the presence of the parasagittal bridging veins would tend to limit motion of the cortex. However, it is not known if this difference is related to differences in perfusion, or differences in specimen characteristics, or some other parameter of unknown influence. Any reduction in perfusion efficacy would result in the accumulation of intracranial gasses, which would decouple the brain from the skull (Stalnaker et al., 1977), permitting larger relative brain motion with respect to the skull. However, the level of perfusion has been found to be adequate for this type of preparation (Hardy et al., 2006), as evidenced by a difference between peak coup pressure and peak resultant linear acceleration of only 0.25 ms. Therefore, the relative motion phenomena at the cortex requires further investigation.
FIGURE 14.

Comparison of brain displacement trends for tests from series C408 and C472 to C383 from Hardy et al. (2001). Superficial target locations (a) and deeper brain target locations (b).
The test series using specimen C472 involved an NDT cluster implanted in the basal ganglia, as shown in Appendix D (Figure D1). This location is proximal to the c.g. of the head. As shown in Figure A40, the motion in this region is small (test C472-T3 shown). Similarly, the strain responses are small as illustrated in Figure A41. Figure 14(b) compares the relative motion of one of the basal ganglia targets from test C472-T4, to an NDT location near the same coordinates (but further from the c.g.) in the sagittal perspective from test C383-T4 from Hardy et al. (2001). The lateral position of these targets is different, with the target from C383-T4 being further from the midline. The shape and direction of the two curves is similar, but the magnitude of the displacements further from the c.g. is substantially larger. The linear displacement at the c.g. of a body undergoing mostly rotation is expected to be small. For these tests, the associated strain measures were small as well, typically 0.010 to 0.015.
Intracranial Pressure Considerations
Intracranial pressure has long been considered important to head injury. Numerous studies have examined the pressure response to head impact in dogs, subhuman primates, and human cadavers (Chason et al., 1958; Gurdjian et al., 1961; Masuzawa et al., 1976; Stalnaker et al., 1977; Nahum et al., 1977; Nusholtz et al., 1984; Trosseille et al., 1992). A review of the theories concerning potential positive and negative intracranial pressure injury mechanisms, including cavitation, is presented by Hardy et al. (1994).
Typically, the coup site pressures were positive, and the contrecoup site pressures were negative within this current study. Figure 15(a) compares typical coup and contrecoup pressure-time histories for tests C241-T5 and C241-T1. Both tests involved occipital blows roughly aligned with the c.g. of the head. However, test C241-T1 involved use of a football helmet. The helmet had the effect of reducing coup pressure and increasing the duration of both coup and contrecoup pressure. For test C241-T5 (without helmet), the duration of the initial coup and contrecoup pulses is approximately 6 ms. After 6 ms, the coup pressure remains positive and experiences another local maximum near 10 ms, and the contrecoup pressure becomes positive. For test C241-T1 (with helmet), the coup pressure remains positive throughout the test, and the contrecoup pressure becomes positive near 10 ms.
FIGURE 15.

Comparison of intracranial pressure responses: Test C241-T5 without a helmet to test C241-T1 with a helmet (a), test C241-T5 to Nahum #48 (b), test C241-T5 to Stalnaker 76A145 coup and Trosseille MS429-1 contrecoup (c), and test C241-T1 to Nahum #37 (d).
Nusholtz et al. (1984) suggested two pressure mechanisms or interactions might occur during head impact. The first was said to involve transfer of energy from the skull to the brain, which typically occurs within the first 15 ms of impact. During this phase, the coup pressure is expected to be positive, and the contrecoup pressure to be negative. The second interaction was said to involve transfer of energy stored in the brain back to the skull, resulting in positive pressure throughout the skull. It was suggested that this phase could last longer than 200 ms. Many of the contrecoup pressure responses observed in this current study can be described as an initial short negative pulse followed by a longer, positive pulse. However, the precise mechanism of this phenomenon remains unknown.
Comparison to Other Studies
The average peak coup pressure was found to be 62 ± 32 kPa for this study, with 153 kPa being the greatest coup pressure recorded. The average peak contrecoup pressure was found to be -26 ± 51 kPa, with -163 kPa being the most negative contrecoup pressure recorded. These results are in keeping with most of the pressure responses recorded in earlier research efforts, even though those studies used epidural pressure measurement instead of transducers implanted in the brain tissue. In a series of monkey tests, Masuzawa et al. (1976) measured coup pressure ranging from 18 to 130 kPa. In a series of impacts to the foreheads of whole cadavers, Nusholtz et al. (1984) measured coup pressure ranging from 3 to 161 kPa in the frontal region, and contrecoup pressure ranging from -4 to -62 kPa in the occipital region. Trosseille et al. (1992) reported coup pressure in the range of 8 to 88 kPa, and contrecoup pressure in the range of -6 to -30 kPa for a series of facial impacts to human cadavers.
One of the largest collections of human cadaver intracranial pressure is presented by Nahum et al., (1977). Seated cadavers were subjected to posteriorly directed impacts of the frontal bone. Coup pressures ranging for 23 to 505 kPa were reported. The relationships between peak epidural pressure and peak linear acceleration were demonstrated for pressure measured in various locations. The relationships were linear regardless of pressure duration. Figure 15(b) compares the pressure responses from test C241-T5 to those from test #48 from Nahum et al. (1977). Although test C241-T5 is an occipital impact and test #48 is a frontal impact, both the coup and contrecoup responses are similar in shape.
Figure 15(c) compares the pressure responses from test C241-T5, which was an occipital impact, to the coup pressure response reported by Stalnaker et al. (1977) for a lateral impact to the cadaver head (test 76A145), and to the occipital contrecoup pressure response reported by Trosseille et al. (1992) for test MS429-1, which was a frontal impact. Given the different impact conditions and directions used for these tests, the shapes of the pressure pulses are remarkably similar.
Figure 15(d) compares the pressure responses from test C241-T1 to those from test #37 from Nahum et al. (1977). Although test C241-T1 is an occipital blow involving a helmet and test #37 is a frontal blow without a helmet, the contrecoup pressure pulses are similar in shape. These comparisons reinforce confidence in the pressure responses recorded as part of the current study, and show that similar responses can be obtained for substantially different impact conditions.
Some of the pressure responses observed in this study appear less reliable, however. Keeping the electrical connections dry in the aCSF environment was a persistent problem. Often, a pressure transducer would simply fail to function. Sometimes, the pressure pulses exhibited unusual anomalies, such as spikes or odd transitions. Figure A38 shows such a trace for test C408-T4. The significance of the odd transitions that appear later in the trace to the validity of the data earlier in the trace is unknown. In other cases the transducer connectors were damaged at the trephine seal interface during testing.
Contrecoup Pressure Polarity
Figure A23 shows a contrecoup response that is primarily positive (test C380-T3). As mentioned, in some cases this was related to the position of the pressure transducer being away from the true contrecoup site. However, this might not be the only explanation in some cases. For example, the polarity of the contrecoup pressure response changes for different tests in the C241 series (Figures A10 through A12). For cases in which the impact was roughly aligned with the c.g. of the head, the contrecoup pressure is negative regardless of whether or not a helmet was used (tests C241-T1, T2, and T6). For cases in which the impact was offset from the c.g. of the head, the coup pressure was negative for the test without a helmet (C241-T5), but was positive for the tests using a helmet (C241-T3 and T4). This might be due to the helmet geometry changing the relationship between the impact point and contrecoup location for the offset tests. However, the contrecoup pressure is negative for the four tests in this series (C241-T1, T2, T5, T6) that have the greatest resultant linear acceleration (127 to 194 g as shown in Table 5), regardless of other conditions. The true mechanism behind these observations is unknown.
Intracranial Pressure and Injury
Gurdjian et al. (1961) stated that concussion in dogs was related to shear stress in the brainstem superior to the foramen magnum. The shear stress was said to result from pressure pulses, and was proportional to the magnitude and duration of pressure. Intracranial pressure pulses were described as having two sources: one being skull deformation during impact, and the other being head acceleration after the blow. The authors suggested that global head acceleration alone was not representative of concussion because it did not reflect the intracranial pressure response due to skull deformation. Thomas et al. (1967) went on to suggest that brain injury was related to the presence of large intracranial pressure gradients. Nusholtz et al. (1987) stated that the initial position of the head and neck was important to the pressure and injury responses, and that cavitation was not responsible for the contrecoup phenomenon because negative pressures below -100 kPa did not cause injury in subhuman primates. However, this group went on to further investigate the possibility of cavitation as an injury mechanism.
Ward et al. (1980) proposed 241 kPa as a threshold for severe brain injury. Analytical and experimental investigations of contusion and hemorrhage were simulated using FE brain models, from which relationships between intracranial pressure and injury were derived. Minor injury was said to occur between 83 and 248 kPa. In FE simulations of concussion events in players in the National Football League (NFL), Zhang et al. (2004) found peak coup pressure for MTBI cases to be 90 ± 24 kPa on average. This suggests that some of the tests conducted in this study might be representative of conditions that could result in MTBI.
Strain Response Considerations
Margulies et al. (1990) compared regions of strain found in a physical model of an animal head to regions of DAI in a living animal head model and extended the findings to a physical model of the human head. Anesthetized baboons were subjected to biphasic angular acceleration in the coronal plane. Physical models of the anterior segment of the baboon and human head were fabricated using silicone gel to represent the brain and thin polyurethane sheet to represent the falx. The same mechanical input that was applied to the baboons was applied to the models. Regions of DAI in the sectioned and stained baboon brains were compared to regions of shear strain in the models. Region 1 of the human head model (model A1) corresponded to a region of deep white matter similar to the region of basal ganglia targeted as part of the C472 series in these tests. The Margulies results suggest a level of 0.06 to 0.07 shear strain in this tissue region for angular acceleration on the order of 7,600 rad/s/s. The critical level of shear strain for the human in this region was mapped to be between 0.09 and 0.10. The corresponding angular acceleration limit for DAI in the human was then proposed to be 16,000 rad/s/s. It was noted that the corresponding shear limits were local thresholds. Ommaya (1984) had suggested a limit of 4,500 rad/s/s in sagittal rotation, for angular speed less than 30 rad/s. These levels of shear strain, angular acceleration, and angular speed are in the neighborhood of those measured in the current study, suggesting some of the tests described herein could represent an injurious condition for impact in the coronal plane.
Galbraith et al. (1993) investigated the response of the squid giant axon to strain. Ability to conduct action potentials was monitored with respect to stretch injury. The injury response became more pronounced and longer lasting with increased loading. Partial recovery of the axons occurred up to 0.20 elongation. For more than 0.20 elongation the axons never fully recovered. Strain of 0.25 resulted in structural failure of the axons. This suggests that some level of axonal damage occurs below 0.20 strain, and that 0.20 might be considered an axial strain threshold for substantial damage short of axonal destruction. Similarly, in tests of the guinea pig optic nerve, Bain and Meaney (2000) found an optimal axial strain threshold for electrophysiological impairment to be 0.18. These levels of axial strain are roughly twice the threshold of shear strain proposed by Margulies et al. (1990), and are more than twice the typical average maximum principal strains found in this current study.
In an in vitro study of rat hippocampal cells, Morrison et al. (2003) noted little cell death to occur at strain levels of 0.10 and below, regardless of the rate at which strain was applied. The authors suggested that 0.10 strain was therefore likely to be below injury threshold. In the neighborhood of 0.20 strain, intermediate levels of cell death were observed, which were dependent on strain rate. Strain of 0.20 was said to be an injury transition level for strain rate from 10 to 50 s-1. Subsequently, Cater et al. (2006) found that damage to rat hippocampal cells was not strain rate dependent. This current study did not find any relationship between strain rate parameters and head acceleration or pressure. For the current study, the greatest rate of maximum principal strain was 93 s-1, but the greatest average maximum principal strain was 0.09 for CFC 60 Hz data.
In general, the aforementioned studies suggest that some of the tests conducted herein might be approaching injurious conditions, particularly when considering shear strain. The HIC15 levels obtained from the CFC 180 Hz data were typically low, with no values exceeding 1000, and only four of the thirty-five tests exceeding 500. However, the CFC 1 kHz HIC15 levels in Appendix B range from 38 to 2540, with five values exceeding 1000 and ten tests exceeding 500. The data in Appendix B also show that a few of the coronal tests exceeded 16,000 rad/s/s in the coronal plane, and most sagittal tests exceeded 4,500 rad/s/s. Similarly, the CFC 180 Hz average maximum principal strain data in Appendix C range from 0.013 to 0.119 in general, with one distant point at 0.213. The CFC 180 Hz average maximum shear strain range from 0.010 to 0.092. This suggests that these tests might represent a range of injury, as indicated by angular acceleration, HIC15 levels, and strain measures.
The Effect of Helmet Use
Helmets are widely accepted as being protective against head injury. During impact, a helmet modulates the kinetic transfer to the head by dissipating energy and distributing load. The result is a reduction in transmitted forces, which reduces skull deformation and head acceleration. In a series of dummy experiments and FE simulations, Zhang et al. (2003) compared the response of the helmeted head to the unhelmeted head under similar impact conditions. It was observed that linear acceleration was reduced substantially by use of the helmet, but that angular acceleration changed little. Further, the results of Hardy et al. (2001) and this current study show that the relative brain motion and strain vary little across a wide range of angular acceleration. This suggests the helmet might be a useful tool for the study of its effect on parameters that might be related to head injury. For example, King et al., (2003) suggested that strain rate and the product of strain and strain rate in the midbrain region appear to be good predictors for concussion.
As mentioned, Zhang et al. (2004) examined cases of MTBI in the NFL. Game video of players' interactions that resulted in injury was analyzed and the impacts were reconstructed in the laboratory using dummy experiments. The parameters measured in the experiments were used as input to an FE model of the human head wearing a helmet. Intracranial pressure was one of the model responses examined. The mean values of coup pressure were 90 ± 24 kPa for injury cases, and 61 ± 17 kPa for non-injury cases.
In the current study, the mean coup pressure for impacts without a football helmet was 68.1 ± 47.6 kPa, and the mean coup pressure for impacts with a helmet was 58.7 ± 21.9 kPa. As mentioned, this suggests that some of the tests conducted in this study might be representative of conditions that could result in MTBI, particularly those conducted without a helmet. Although coup pressure was reduced on average by use of the helmet, this result is not significant for these tests, given the large variance in the pressures measured without a helmet. One factor that may influence this result is the substantial volume of aCSF absorbed by the scalp during testing. The helmet was removed in the later stages of each test series, by which time the scalp had retained enough fluid to afford some padding to the head. This would tend to reduce the linear acceleration and intracranial pressures measured during tests without a helmet.
Table 10 compares a number of response parameters for tests with and without a helmet. Figure 16 provides a graphical comparison of the means for selected significant results. Notably, both linear and angular acceleration are significantly reduced with use of the helmet, but the reduction in linear acceleration was found to be of greater significance (p = 0.0009). This makes physical sense because for a given offset from the c.g. of the head, reduction in linear acceleration will result in reduction of angular acceleration. Angular speed was not significantly reduced by use of the helmet, which may be important to the relative motion and strain responses within the brain due to rotational input. As mentioned, use of a helmet reduced coup pressure, but not significantly. Similarly, use of a helmet increased coup pressure duration on average, but not significantly. This might be influenced by the method used to estimate the pulse duration, which attempted to eliminate the portion of the curve after the initial impact. The method of estimating pulse duration suggested by Nusholtz et al. (1984) might be a better approach.
Table 10.
Comparison of peak response parameters for test conditions with and without a helmet
| Response parameters | Without helmet | With helmet | p | ||||
|---|---|---|---|---|---|---|---|
| Mean | Std. dev. | Mean | Std. dev. | ||||
| Head kinematics | Linear acceleration | (g) | 124 | 38 | 75 | 34 | 0.0009 |
| Angular acceleration | (r/s/s) | 10626 | 5424 | 5912 | 3835 | 0.0093 | |
| Angular speed | (r/s) | 21 | 6 | 20 | 5 | 0.5890 | |
|
| |||||||
| Intracranial pressure | Coup | (kPa) | 68.1 | 47.6 | 58.7 | 21.9 | 0.5952 |
| Coup duration | (ms) | 16.0 | 18.0 | 22.4 | 19.2 | 0.5204 | |
| Coup impulse | (kPa*ms) | 374.3 | 307.2 | 393.9 | 173.2 | 0.8708 | |
| Coup rate | (kPa/ms) | 88.5 | 64.9 | 35.4 | 22.3 | 0.0304 | |
|
| |||||||
| Brain displacement (avg.) | Total excursion | (mm) | 6.9 | 3.8 | 6.4 | 1.9 | 0.6669 |
|
| |||||||
| Brain strain (avg.) | Maximum principal | - | 0.025 | 0.016 | 0.039 | 0.023 | 0.0138 |
| Maximum shear | - | 0.022 | 0.009 | 0.037 | 0.021 | 0.0013 | |
| Maximum principal rate | (s-1) | 24.8 | 14.9 | 27.5 | 21.1 | 0.5950 | |
| Maximum shear rate | (s-1) | 24.0 | 16.9 | 28.7 | 24.1 | 0.4221 | |
| Maximum principal * rate | (s-1) | 0.184 | 0.201 | 0.331 | 0.328 | 0.0559 | |
| Maximum shear * rate | (s-1) | 0.132 | 0.153 | 0.314 | 0.312 | 0.0100 | |
Bold typeface indicates significant relationship
FIGURE 16.

Comparison of means with and without helmet use for some significant response parameters.
A reduction in pressure and an increase in pressure pulse duration should be expected for conditions involving helmet use, as illustrated in Figure 15(a). The relationship between pressure and linear acceleration is well documented experimentally (Nahum et al., 1977 and Hardy et al. 2006) and numerically. Intracranial pressure increases with increasing acceleration, and pressure duration decreases. This is demonstrated within the current study as well (Table 8 and Figure 11). Therefore, it is reasonable to suggest that because the use of a helmet reduces linear acceleration (Table 10 and Figure 16), intracranial pressure should reduce as well, as demonstrated by Zhang et al. (2004). Although coup pressure did not reduce significantly with helmet use, the rate of change of coup pressure did reduce significantly with helmet use, as shown in Table 10 and Figure 16. Coup pressure impulse did not change with helmet use.
Helmet use did not influence the extent of relative brain displacement, which was evaluated in terms of the average total excursion (the sum of peak positive and negative relative displacement magnitudes along the direction of impact) for all NDT locations. The average total excursions were between 6 and 7 mm. Helmet use did affect the level of average maximum principal strain and average maximum shear strain. Both parameters increased significantly for helmet use. This seems counterintuitive at first. However, as demonstrated in Table 9 and Figure 12, both strain and shear strain decrease as linear acceleration and pressure increase. This makes some physical sense, as little brain motion and deformation are expected for a largely rigid and incompressible system undergoing linear acceleration, and linear acceleration is increased for cases without a helmet in these tests, perhaps being the dominant factor in the overall response. However, it was not possible to independently control various impact parameters such as linear and angular acceleration in these tests and the actual cause of this phenomenon is unclear. The product of average maximum shear and shear rate also increases significantly for helmet use, but this result is dominated by the shear response.
Caveats
This study has four major limitations. First, the cadaver model does not provide an injury response. Although many parameters that might relate to injury were measured in this study, there are no injury data to which to compare them directly. Measures such as linear and angular acceleration, pressure, and strain can be used to indirectly estimate the level of injury that might be associated with a given test. This is valuable because it is important to examine the mechanical response of the brain for conditions that might be indicative of injury, or neighboring an injury threshold. Conducting tests in which the possible level of injury cannot be estimated at all is of limited value. This of course relies on the efficacy of a given parameter to predict injury, which is a subject of continuing debate for most measures.
The second major limitation is the scale on which the strain parameters can be estimated. Focal shear related to transient pressure waves cannot be estimated using these techniques. Similarly, strain in an NDT cluster cannot be related to the local neuronal orientation, so strain along axonal paths cannot be estimated. Although the NDTs are quite small, a cluster of these targets occupies a relatively large volume compared to the size of intracranial structures. In addition to strain not being measured at a point, the response of the brain at one target location may have nothing to do with the response at another location. This tends to produce noisy strain data, as one part of a cluster is acting somewhat independently of another part. Therefore, CFC 60 Hz filtering was used to disclose and examine the trends. Further, the strain response along a given axis or in a given plane may be in different directions for different regions within the NDT clusters. Therefore, average maximum principal strain and average maximum shear strain values were computed and analyzed. This eliminated the need to make any qualitative judgment as to how to handle data from individual target triads within each cluster. Too much emphasis should not be placed on the amplitude of these strain data, although comparison between CFC 60 and 180 Hz data show only nominal differences.
The third major limitation has two components: many of the factors examined in this study could not be controlled tightly or varied independently, and only a limited number of tests were conducted in a number of different conditions. It was difficult to vary angular acceleration while keeping linear acceleration constant. It was difficult to maintain the head and neck initial conditions between tests with and without a helmet. However, linear impact speed and angular speed of the head were maintained fairly consistently. This confounded the ability to make clear comparisons between the effects of different impact conditions in some cases.
The final major limitation of this study is missing data resulting from the inability to track some NDTs for some time intervals and from damage to the nine-accelerometer array. For circumstances in which an NDT could not be tracked starting from contact, the given NDT could not be used for strain calculation even if it could be tracked later in the impact. Intermittent target data made interpretation of the relative motion shapes and determination of the extent of motion difficult for some NDT locations in some tests. Damage to the mounting system of the nine-accelerometer array made measurement of the head kinematics for series C472 impossible, unfortunately. However, it is likely that the general level of response is similar to those for tests having similar conditions within this study, as the same methods and mechanisms were used for all tests.
An additional influence on the interpretation of these results is the nature of the filtering used to trend the data. Typically, CFC 1 kHz is used to examine head acceleration. However, oscillations related to the impact fixtures, nine-accelerometer array, and the head itself tended to contaminate the responses. The largest known source of these oscillations is the pedestal to which the nine-accelerometer array is fixed. This usually manifested in the form of exaggerated angular acceleration, which in turn influenced calculation of linear acceleration at the c.g. of the head. In Appendix E, Figure E1 compares CFC 180 Hz data to CFC 1 kHz data for a few of the most oscillatory responses. Also compared is the coup pressure. Linear acceleration in the direction of impact and coup pressure should have similar shape. The filtering is shown to provide better agreement between the linear acceleration and coup pressure shapes. Angular accelerations processed using the two channel classes are compared also. As shown, artifacts are reduced and reasonable trends of the data are provided, even for very oscillatory cases.
Of lesser influence is the density of the NDTs, which ranges as high as 1.5, whereas the brain has density of roughly 1.0. Since the brain is a nearly incompressible structure, an increase in local density will increase the local stresses, but it should not increase the local relative motion appreciably. Each NDT has mass of roughly 36 mg or less, which represents insignificant inertial loading. Further, the targets have been shown to maintain their position with respect to surrounding tissue. Therefore, any error associated with the density of the targets is assumed to be negligible. A rudimentary 3D FE model using the brain material properties from the “average” model of Kleiven and Hardy (2002) was generated to investigate this point. The increased density of the NDTs was shown to add 1.5 percent to the maximum relative excursion of the brain tissue.
A discussion of the other types of error that might be associated with this kind of testing is provided by Hardy et al. (2001). A discussion of the performance of the high-speed biplane x-ray system is provided by Tashman and Anderst (2003).
Future Considerations
A number of head impact responses remain to be examined using human cadavers and the methods described herein. The NDT clusters should be implanted in additional regions, and should focus on specific structures. For example, the clusters could be moved away from the center of the white matter, targeting the occipital lobe and the more anterior aspects of the frontal lobe, and the temporal lobe.
Distributed targeting could be employed as well. Individual targets could be placed throughout the brain, instead of in columns or targets. This might provide some indication of the overall response of the brain. Further, the cortex should be targeted in various places, including near the anterior middle fossa and the tentorium. This would help to better define the nature of the interface between the brain and skull during impact.
A few more tests should be conducted using a helmet, to provide additional data points. However, much of aforementioned future testing could be conducted without the added complexity of the helmet.
It should be noted however, that this type of testing is approaching a point of diminishing returns. Given the limitation of the scale on which strain parameters can be estimated, it is likely that future examination of strain in the brain during impact will be conducted largely using FE models that have been validated using data such as these.
Conclusions
Brain displacement and deformation during impact have been examined in repressurized human cadaver head and neck specimens using high-speed biplane x-ray and neutral density targets. The displacement response is indicative of that described by Hardy et al. (2001). Brain motion patterns can be interpreted visually with respect to angular speed. As the head begins to rotate, local brain tissue tends to keep its position and shape with respect to the inertial frame, creating relative brain displacement and deformation. As the head rotation slows, reaches steady state, or changes direction, the brain motion exceeds that of the skull. The results of this study show:
The local brain motions tend to follow looping patterns,
The average total brain excursion in the direction of impact was less than 7 mm,
The brain motion patterns for impact in the median, coronal, and horizontal planes show similarities,
The brain motion patterns exhibit some degree of posterior-anterior and right-left symmetry,
Proximity to the falx cerebri influences the brain motion patterns for impact in the coronal and horizontal planes,
Displacement and deformation in regions closer to the c.g. of the head are less than for regions of the brain farther from the c.g. during impact in the median plane,
The degree of displacement of the cortex near the brain-skull interface remains unknown,
A classic coup and contrecoup pressure response is observable for impacts in the median plane,
Peak coup pressure and pressure rate increase with increasing linear acceleration,
Coup pressure pulse duration decreases with increasing linear acceleration,
No pressure parameters were found to vary significantly with angular acceleration,
The greatest average maximum principal strain is 0.088, and the greatest average maximum shear strain is 0.089 for CFC 60 Hz processing within these low-speed tests,
Peak average maximum principal strain increases with increasing linear acceleration in the direction of impact, increasing coup pressure, and increasing coup pressure rate,
Peak average maximum shear strain increases with increasing linear acceleration in the direction of impact, increasing coup pressure, and increasing coup pressure rate,
No strain parameters were found to vary significantly with angular acceleration,
Linear and angular acceleration of the head are reduced with use of a helmet,
Angular speed is not reduced significantly with use of a helmet,
Helmet use did not influence the extent of relative brain displacement,
Peak average maximum principal strain and peak average maximum shear strain increase for helmet use.
These results aid in the understanding of the response of the cadaver brain to impact, but further work is needed. These results can be used for the validation of FE models of the human head.
Acknowledgments
This work was conducted under the auspices of the Bioengineering Center at Wayne State University and was supported in part by the Centers for Disease Control and Prevention, National Center for Injury Prevention and Control Grant No. R49/CCR503534-12, the National Institute of Neurological Disorders and Stroke Grant No. 5R01NS046389-02, and by a Ford Motor Company Biomedical Engineering Graduate Fellowship.
The efforts of the Bioengineering Center staff are deeply appreciated, as well as those of the staff of the Motion Analysis Laboratory at Henry Ford Hospital. Some equipment used in this study was obtained with support from the Alliance of Automobile Manufacturers and Honda R.&D., Inc.
APPENDIX A - Additional response data from representative tests
FIGURE A1.

Brain motion patterns for two NDT clusters for helmeted test C288-T2 for an offset occipital impact.
TABLE A1.
NDT tracking intervals, starting positions, and peak excursions for test C288-T2
| Cluster
NDT # |
C2 | C1 | |||||||||||||
|---|---|---|---|---|---|---|---|---|---|---|---|---|---|---|---|
| 14 | 13 | 12 | 11 | 10 | 9 | 8 | 7 | 6 | 5 | 4 | 3 | 2 | 1 | ||
| Interval
(ms) |
Start | 27 | - | - | 0 | 0 | - | 0 | - | 0 | 0 | 0 | 0 | 0 | - |
| Stop | 124 | - | - | 126 | 182 | - | 159 | - | 126 | 129 | 154 | 146 | 154 | - | |
|
| |||||||||||||||
| Start position
(mm) |
X | -28.77 | - | - | -26.12 | -33.73 | - | -24.42 | - | 15.34 | 5.69 | 13.73 | 21.57 | 19.29 | - |
| Y | -21.44 | - | - | -16.53 | -21.29 | - | -12.15 | - | -17.60 | -21.88 | -15.45 | -8.83 | -22.24 | - | |
| Z | 54.69 | - | - | 47.54 | 42.83 | - | 40.14 | - | 58.06 | 48.89 | 49.17 | 51.54 | 45.40 | - | |
|
| |||||||||||||||
| Peak excursion
(mm) |
X | 1.69 | - | - | 1.39 | 1.13 | - | 0.93 | - | 3.07 | 2.99 | 2.39 | 1.94 | 2.33 | - |
| -3.57 | - | - | -2.45 | -1.62 | - | -1.32 | - | -4.93 | -3.81 | -3.66 | -3.08 | -2.78 | - | ||
| Y | 2.89 | - | - | 1.54 | 1.21 | - | 1.08 | - | 1.97 | 1.84 | 2.37 | 2.69 | 1.64 | - | |
| -1.24 | - | - | -3.03 | -3.33 | - | -3.71 | - | -2.51 | -0.46 | -0.90 | -1.53 | -1.14 | - | ||
| Z | 2.98 | - | - | 1.57 | 1.51 | - | 1.49 | - | 2.68 | 3.15 | 3.20 | 3.35 | 4.69 | - | |
| -1.58 | - | - | -2.78 | -3.37 | - | -2.41 | - | -2.01 | -2.07 | -1.61 | -1.36 | -1.87 | - | ||
FIGURE A2.

The head responses from test C288-T2 (offset occipital impact with a helmet): Linear acceleration components (upper left), angular acceleration components (upper right), angular speed components (lower left), and pressure responses (lower right).
FIGURE A3.

The brain responses from test C288-T2 (offset occipital impact with a helmet): Typical relative displacement time histories referred to starting positions (left), and average maximum principal and shear strain time histories (right).
FIGURE A4.

Brain motion patterns for two NDT clusters for test C288-T3 for an offset occipital impact without a helmet.
TABLE A2.
NDT tracking intervals, starting positions, and peak excursions for test C288-T3
| Cluster
NDT # |
C2 | C1 | |||||||||||||
|---|---|---|---|---|---|---|---|---|---|---|---|---|---|---|---|
| 14 | 13 | 12 | 11 | 10 | 9 | 8 | 7 | 6 | 5 | 4 | 3 | 2 | 1 | ||
| Interval
(ms) |
Start | 0 | 0 | 0 | 0 | 0 | 0 | 0 | 0 | 0 | 0 | 0 | 0 | 0 | 0 |
| Stop | 44 | 44 | 167 | 167 | 167 | 167 | 39 | 167 | 167 | 127 | 103 | 104 | 167 | 167 | |
|
| |||||||||||||||
| Start position
(mm) |
X | -29.93 | -33.81 | -20.60 | -27.02 | -33.80 | -21.00 | -24.62 | 6.42 | 14.10 | 5.00 | 12.74 | 20.40 | 18.70 | 11.55 |
| Y | -20.45 | -8.33 | -10.38 | -17.39 | -21.98 | -24.72 | -13.15 | -8.63 | -17.81 | -22.30 | -15.91 | -8.98 | -22.49 | -12.29 | |
| Z | 54.69 | 47.24 | 51.98 | 46.45 | 41.13 | 45.71 | 38.64 | 54.69 | 57.40 | 48.06 | 48.53 | 51.17 | 44.90 | 41.49 | |
|
| |||||||||||||||
| Peak excursion
(mm) |
X | 2.88 | 0.89 | 2.24 | 2.57 | 1.34 | 3.46 | 3.41 | 3.08 | 3.82 | 3.31 | 3.26 | 3.06 | 2.52 | 2.19 |
| -3.01 | -0.82 | -1.98 | -1.59 | -1.25 | -2.30 | -46.57 | -2.71 | -3.46 | -3.07 | -2.67 | -2.30 | -0.86 | -0.79 | ||
| Y | 1.42 | 1.32 | 1.46 | 1.90 | 1.45 | 1.88 | 3.06 | 1.62 | 1.86 | 1.57 | 1.73 | 1.89 | 1.48 | 1.46 | |
| -0.82 | -1.45 | -1.06 | -1.05 | -1.40 | -0.65 | -40.54 | -1.04 | -1.05 | -0.22 | -0.84 | -0.97 | -0.16 | -0.13 | ||
| Z | 2.31 | 1.72 | 2.59 | 2.56 | 3.40 | 3.88 | 24.27 | 1.77 | 2.70 | 2.78 | 2.69 | 2.75 | 3.76 | 3.10 | |
| -1.35 | -1.21 | -1.43 | -1.99 | -1.74 | -1.79 | -1.71 | -1.16 | -1.30 | -1.44 | -1.25 | -1.06 | -1.83 | -1.71 | ||
FIGURE A5.

The head responses from test C288-T3 (offset occipital impact without a helmet): Linear acceleration components (upper left), angular acceleration components (upper right), angular speed components (lower left), and pressure responses (lower right).
FIGURE A6.

The brain responses from test C288-T3 (offset occipital impact without a helmet): Typical relative displacement time histories referred to starting positions (left), and average maximum principal and shear strain time histories (right).
FIGURE A7.

Brain motion patterns for two NDT clusters for test C288-T4 for an aligned occipital impact without a helmet.
TABLE A3.
NDT tracking intervals, starting positions, and peak excursions for test C288-T4
| Cluster
NDT # |
C2 | C1 | |||||||||||||
|---|---|---|---|---|---|---|---|---|---|---|---|---|---|---|---|
| 14 | 13 | 12 | 11 | 10 | 9 | 8 | 7 | 6 | 5 | 4 | 3 | 2 | 1 | ||
| Interval
(ms) |
Start | 0 | 15 | 0 | 0 | 0 | 18 | 0 | 0 | 0 | 0 | 0 | 0 | 0 | 75 |
| Stop | 149 | 144 | 136 | 149 | 94 | 139 | 130 | 148 | 133 | 104 | 21 | 33 | 146 | 149 | |
|
| |||||||||||||||
| Start position
(mm) |
X | -29.13 | -33.86 | -19.59 | -25.46 | -32.95 | -21.45 | -23.74 | 7.79 | 15.61 | 6.44 | 14.19 | 21.70 | 20.06 | 13.33 |
| Y | -20.30 | -7.90 | -10.08 | -16.59 | -21.71 | -24.11 | -12.63 | -8.39 | -17.34 | -21.76 | -15.43 | -8.76 | -22.18 | -11.42 | |
| Z | 55.00 | 47.22 | 52.26 | 46.55 | 41.68 | 45.93 | 39.18 | 54.80 | 57.41 | 48.35 | 48.58 | 51.01 | 44.81 | 41.15 | |
|
| |||||||||||||||
| Peak excursion
(mm) |
X | 3.08 | 1.80 | 1.92 | 1.75 | 1.61 | 4.31 | 1.17 | 2.47 | 2.79 | 2.02 | 0.00 | 0.00 | 1.29 | 0.81 |
| -2.11 | -0.33 | -1.79 | -1.72 | -1.38 | -0.20 | -1.05 | -2.39 | -3.02 | -2.59 | -3.09 | -2.04 | -1.90 | -1.23 | ||
| Y | 1.45 | 0.71 | 1.29 | 1.83 | 0.91 | 0.44 | 1.26 | 1.33 | 0.85 | 0.70 | 0.77 | 1.07 | 1.04 | 0.50 | |
| -0.65 | -1.50 | -1.37 | -1.38 | -1.07 | -1.04 | -1.29 | -1.00 | -1.18 | -0.91 | -0.25 | -0.18 | -0.39 | -0.84 | ||
| Z | 3.09 | 3.04 | 2.36 | 2.62 | 3.11 | 3.51 | 2.74 | 1.68 | 1.74 | 1.97 | 1.11 | 1.30 | 1.95 | 1.78 | |
| -1.21 | -0.59 | -0.99 | -1.23 | -0.95 | -0.92 | -0.99 | -1.30 | -1.35 | -1.04 | -0.33 | -0.33 | -1.68 | -1.16 | ||
FIGURE A8.

The intracranial pressure response from test C288-T4 (aligned occipital impact without a helmet).
FIGURE A9.

The brain responses from test C288-T4 (aligned occipital impact without a helmet): Typical relative displacement time histories referred to starting positions (left), and average maximum principal and shear strain time histories (right).
FIGURE A10.

The head responses from test C241-T1 (aligned occipital impact with a helmet) and test C241-T2 (aligned occipital impact with a helmet): Linear acceleration components (top), angular acceleration components (middle), and pressure responses (bottom).
FIGURE A11.

The head responses from test C241-T3 (offset occipital impact with a helmet) and test C241-T4 (offset occipital impact with a helmet): Linear acceleration components (top), angular acceleration components (middle), and pressure responses (bottom).
FIGURE A12.

The head responses from test C241-T5 (offest occipital impact without a helmet) and test C241-T6 (aligned occipital impact without a helmet): Linear acceleration components (top), angular acceleration components (middle), and pressure responses (bottom).
FIGURE A13.

Brain motion patterns for two NDT clusters for helmeted test C064-T2 for an offset occipital impact.
TABLE A4.
NDT tracking intervals, starting positions, and peak excursions for test C064-T2
| Cluster
NDT # |
C2 | C1 | |||||||||||||
|---|---|---|---|---|---|---|---|---|---|---|---|---|---|---|---|
| 14 | 13 | 12 | 11 | 10 | 9 | 8 | 7 | 6 | 5 | 4 | 3 | 2 | 1 | ||
| Interval
(ms) |
Start | 0 | - | 0 | 17 | - | - | 0 | 0 | - | 0 | - | - | - | 0 |
| Stop | 88 | - | 65 | 88 | - | - | 88 | 59 | - | 19 | - | - | - | 52 | |
|
| |||||||||||||||
| Start position
(mm) |
X | -31.45 | - | -37.76 | -25.87 | - | - | -32.00 | 38.77 | - | 46.20 | - | - | - | 51.24 |
| Y | -22.63 | - | -27.82 | -17.89 | - | - | -21.13 | -21.88 | - | -13.10 | - | - | - | -27.40 | |
| Z | 35.72 | - | 41.21 | 42.44 | - | - | 54.56 | 47.91 | - | 37.25 | - | - | - | 49.31 | |
|
| |||||||||||||||
| Peak excursion
(mm) |
X | 3.27 | - | 3.95 | 8.31 | - | - | 6.21 | 3.96 | - | 1.05 | - | - | - | 0.17 |
| -2.35 | - | -3.42 | -0.60 | - | - | -5.69 | -5.62 | - | -3.68 | - | - | - | -5.38 | ||
| Y | 1.23 | - | 4.67 | 1.42 | - | - | 1.85 | 0.13 | - | 0.02 | - | - | - | 0.19 | |
| -0.67 | - | -0.46 | -1.02 | - | - | -1.98 | -1.71 | - | -1.82 | - | - | - | -3.23 | ||
| Z | 3.95 | - | 4.36 | 3.46 | - | - | 3.28 | 2.49 | - | 3.19 | - | - | - | 2.00 | |
| -2.54 | - | -3.24 | -1.08 | - | - | -1.82 | -1.97 | - | -0.49 | - | - | - | -2.18 | ||
FIGURE A14.

The head responses from test C064-T2 (offset occipital impact with a helmet): Linear acceleration components (upper left), angular acceleration components (upper right), angular speed components (lower left), and pressure responses (lower right).
FIGURE A15.

The brain responses from test C064-T2 (offset occipital impact with a helmet): Typical relative displacement time histories referred to starting positions (left), and average maximum principal and shear strain time histories (right).
FIGURE A16.

Brain motion patterns for two NDT clusters for helmeted test C380-T1 for an offset left temporal impact.
TABLE A5.
NDT tracking intervals, starting positions, and peak excursions for test C380-T1
| Cluster
NDT # |
C2 | C1 | |||||||||||||
|---|---|---|---|---|---|---|---|---|---|---|---|---|---|---|---|
| 14 | 13 | 12 | 11 | 10 | 9 | 8 | 7 | 6 | 5 | 4 | 3 | 2 | 1 | ||
| Interval
(ms) |
Start | 0 | 0 | 0 | 0 | 0 | 0 | 0 | 0 | 0 | 0 | 0 | 0 | 0 | 0 |
| Stop | 116 | 116 | 116 | 116 | 116 | 116 | 116 | 67 | 82 | 76 | 73 | 69 | 64 | 79 | |
|
| |||||||||||||||
| Start position
(mm) |
X | 6.75 | 0.70 | 14.81 | 7.05 | 2.16 | 14.74 | 8.43 | 10.29 | 4.80 | 19.00 | 11.69 | 5.32 | 19.51 | 12.83 |
| Y | 15.92 | 20.98 | 21.86 | 16.28 | 6.18 | 5.65 | 14.55 | -31.01 | -22.86 | -23.78 | -31.06 | -38.33 | -36.57 | -28.86 | |
| Z | 54.38 | 48.27 | 47.34 | 47.84 | 46.66 | 45.27 | 38.02 | 54.20 | 46.10 | 46.89 | 44.22 | 43.68 | 45.64 | 36.09 | |
|
| |||||||||||||||
| Peak excursion
(mm) |
X | 1.96 | 1.44 | 2.50 | 2.05 | 2.32 | 1.58 | 1.74 | 1.56 | 1.20 | 1.34 | 1.59 | 2.38 | 2.27 | 1.54 |
| -2.70 | -2.95 | -2.78 | -2.44 | -1.95 | -2.09 | -2.10 | -2.00 | -1.89 | -1.77 | -2.55 | -2.18 | -3.23 | -2.16 | ||
| Y | 5.45 | 2.85 | 3.47 | 3.97 | 4.50 | 5.03 | 1.83 | 5.55 | 3.26 | 3.91 | 2.58 | 2.63 | 3.38 | 1.70 | |
| -6.05 | -3.74 | -4.20 | -4.17 | -3.93 | -4.38 | -1.56 | -6.57 | -4.09 | -5.36 | -3.10 | -2.56 | -3.39 | -1.42 | ||
| Z | 2.19 | 2.59 | 3.17 | 2.30 | 2.58 | 2.50 | 2.24 | 1.82 | 1.63 | 1.34 | 2.52 | 3.41 | 3.51 | 2.40 | |
| -2.13 | -3.04 | -3.33 | -1.93 | -3.01 | -2.45 | -1.64 | -1.83 | -0.59 | -0.83 | -1.93 | -3.33 | -3.97 | -1.39 | ||
FIGURE A17.

The head responses from test C380-T1 (offset temporal impact with a helmet): Linear acceleration components (upper left), angular acceleration components (upper right), angular speed components (lower left), and pressure responses (lower right).
FIGURE A18.

The brain responses from test C380-T1 (offset temporal impact with a helmet): Typical relative displacement time histories referred to starting positions (left), and average maximum principal and shear strain time histories (right).
FIGURE A19.

Brain motion patterns for two NDT clusters for helmeted test C380-T2 for an offset left parietal impact.
TABLE A6.
NDT tracking intervals, starting positions, and peak excursions for test C380-T2
| Cluster
NDT # |
C2 | C1 | |||||||||||||
|---|---|---|---|---|---|---|---|---|---|---|---|---|---|---|---|
| 14 | 13 | 12 | 11 | 10 | 9 | 8 | 7 | 6 | 5 | 4 | 3 | 2 | 1 | ||
| Interval
(ms) |
Start | 0 | 0 | 0 | 0 | 0 | 0 | 0 | 0 | 0 | 0 | 0 | 0 | 0 | 0 |
| Stop | 252 | 247 | 252 | 252 | 242 | 49 | 252 | 222 | 206 | 231 | 225 | 219 | 225 | 228 | |
|
| |||||||||||||||
| Start position
(mm) |
X | 5.07 | -1.19 | 12.92 | 5.40 | -0.19 | 19.29 | 6.15 | 6.28 | 1.23 | 15.56 | 7.29 | 1.19 | 15.13 | 8.79 |
| Y | 15.53 | 20.98 | 21.27 | 16.01 | 6.45 | 5.04 | 14.50 | -31.33 | -22.57 | -24.33 | -31.16 | -37.93 | -37.08 | -28.70 | |
| Z | 53.68 | 47.58 | 46.83 | 47.11 | 45.50 | 42.48 | 37.42 | 52.36 | 44.67 | 45.38 | 42.45 | 41.76 | 43.61 | 34.46 | |
|
| |||||||||||||||
| Peak excursion
(mm) |
X | 4.52 | 4.49 | 5.43 | 4.13 | 4.88 | 4.12 | 4.47 | 8.01 | 5.92 | 6.39 | 6.92 | 7.56 | 7.75 | 6.07 |
| -1.84 | -1.94 | -2.20 | -1.65 | -1.04 | 0.00 | -0.60 | 0.00 | 0.00 | 0.00 | 0.00 | 0.00 | -0.46 | 0.00 | ||
| Y | 5.96 | 4.01 | 4.24 | 4.62 | 5.27 | 5.32 | 2.19 | 6.14 | 5.36 | 4.83 | 3.72 | 2.91 | 3.98 | 2.19 | |
| -5.25 | -3.91 | -3.11 | -4.05 | -3.92 | -1.49 | -0.82 | -5.37 | -4.03 | -3.49 | -2.53 | -2.66 | -2.02 | -1.78 | ||
| Z | 2.79 | 3.24 | 3.41 | 2.98 | 2.67 | 2.66 | 2.94 | 5.44 | 5.21 | 4.55 | 5.43 | 6.09 | 5.15 | 5.37 | |
| -0.87 | -1.74 | -1.96 | -0.68 | -0.69 | 0.00 | -0.26 | 0.00 | 0.00 | 0.00 | 0.00 | -1.01 | -0.76 | 0.00 | ||
FIGURE A20.

The head responses from test C380-T2 (offset parietal impact with a helmet): Linear acceleration components (upper left), angular acceleration components (upper right), angular speed components (lower left), and pressure responses (lower right).
FIGURE A21.

The brain responses from test C380-T2 (offset parietal impact with a helmet): Typical relative displacement time histories referred to starting positions (left), and average maximum principal and shear strain time histories (right).
FIGURE A22.

Brain motion patterns for two NDT clusters for helmeted test C380-T3 for an aligned left temporal impact.
TABLE A7.
NDT tracking intervals, starting positions, and peak excursions for test C380-T3
| Cluster
NDT # |
C2 | C1 | |||||||||||||
|---|---|---|---|---|---|---|---|---|---|---|---|---|---|---|---|
| 14 | 13 | 12 | 11 | 10 | 9 | 8 | 7 | 6 | 5 | 4 | 3 | 2 | 1 | ||
| Interval
(ms) |
Start | 0 | 0 | 0 | 0 | 0 | 0 | 0 | 0 | 0 | 0 | 0 | 0 | 0 | 0 |
| Stop | 87 | 103 | 108 | 95 | 85 | 54 | 103 | 51 | 63 | 56 | 57 | 55 | 50 | 62 | |
|
| |||||||||||||||
| Start position
(mm) |
X | 6.61 | 0.13 | 14.76 | 7.05 | 1.72 | 24.13 | 7.78 | 10.20 | 4.13 | 18.77 | 10.73 | 4.72 | 18.81 | 12.07 |
| Y | 15.40 | 20.65 | 21.51 | 16.08 | 6.70 | 6.50 | 14.54 | -31.10 | -22.43 | -23.69 | -30.80 | -38.21 | -36.93 | -28.33 | |
| Z | 54.43 | 48.30 | 47.62 | 47.99 | 46.02 | 42.28 | 38.06 | 52.74 | 45.01 | 45.65 | 43.02 | 42.21 | 44.00 | 35.08 | |
|
| |||||||||||||||
| Peak excursion
(mm) |
X | 1.58 | 1.98 | 2.06 | 1.74 | 2.08 | 1.86 | 1.99 | 2.50 | 1.59 | 1.91 | 2.68 | 2.43 | 2.61 | 2.20 |
| -2.56 | -2.02 | -2.44 | -2.30 | -1.79 | -1.10 | -1.20 | -0.55 | -0.60 | -0.56 | -0.67 | -0.99 | -1.38 | -0.52 | ||
| Y | 6.01 | 3.83 | 4.22 | 4.42 | 4.42 | 4.75 | 1.85 | 6.40 | 3.89 | 4.31 | 3.06 | 2.34 | 3.74 | 2.03 | |
| -4.24 | -2.72 | -2.90 | -3.15 | -3.05 | -1.46 | -0.37 | -4.81 | -2.85 | -3.54 | -1.65 | -1.53 | -1.81 | -1.08 | ||
| Z | 3.16 | 3.61 | 3.47 | 3.12 | 2.78 | 3.03 | 2.95 | 3.36 | 3.84 | 3.10 | 3.53 | 4.45 | 4.98 | 3.07 | |
| -1.42 | -2.33 | -2.82 | -1.47 | -0.39 | 0.00 | -0.70 | 0.00 | -0.02 | 0.00 | 0.00 | -0.53 | -0.89 | 0.00 | ||
FIGURE A23.

The head responses from test C380-T3 (aligned temporal impact with a helmet): Linear acceleration components (upper left), angular acceleration components (upper right), angular speed components (lower left), and pressure responses (lower right).
FIGURE A24.

The brain responses from test C380-T3 (aligned temporal impact with a helmet): Typical relative displacement time histories referred to starting positions (left), and average maximum principal and shear strain time histories (right).
FIGURE A25.

Brain motion patterns for two NDT clusters for test C380-T4 for an offset left temporal impact without a helmet.
TABLE A8.
NDT tracking intervals, starting positions, and peak excursions for test C380-T4
| Cluster
NDT # |
C2 | C1 | |||||||||||||
|---|---|---|---|---|---|---|---|---|---|---|---|---|---|---|---|
| 14 | 13 | 12 | 11 | 10 | 9 | 8 | 7 | 6 | 5 | 4 | 3 | 2 | 1 | ||
| Interval
(ms) |
Start | 0 | 0 | 0 | 0 | 0 | 0 | 0 | 0 | 0 | 0 | 0 | 0 | 0 | 0 |
| Stop | 163 | 163 | 163 | 163 | 163 | 163 | 163 | 163 | 163 | 163 | 163 | 163 | 163 | 163 | |
|
| |||||||||||||||
| Start position
(mm) |
X | 7.09 | 0.34 | 15.05 | 7.61 | 2.12 | 23.39 | 8.66 | 12.24 | 5.38 | 20.39 | 12.65 | 6.73 | 20.86 | 13.82 |
| Y | 16.49 | 21.05 | 22.43 | 16.65 | 7.10 | -0.17 | 14.90 | -29.59 | -21.38 | -22.26 | -29.78 | -37.45 | -35.56 | -27.45 | |
| Z | 54.19 | 48.12 | 47.08 | 47.77 | 46.04 | 37.91 | 37.98 | 53.62 | 45.48 | 46.23 | 44.03 | 43.23 | 44.96 | 35.95 | |
|
| |||||||||||||||
| Peak excursion
(mm) |
X | 1.74 | 2.30 | 2.43 | 1.66 | 1.21 | 1.09 | 1.08 | 1.74 | 0.34 | 1.00 | 1.21 | 1.16 | 1.42 | 1.01 |
| -2.68 | -2.30 | -2.78 | -2.63 | -2.12 | -8.73 | -2.36 | -2.89 | -1.61 | -1.77 | -2.15 | -2.92 | -3.19 | -2.29 | ||
| Y | 5.20 | 3.51 | 2.99 | 4.03 | 4.63 | 4.73 | 1.46 | 5.59 | 3.60 | 2.74 | 2.22 | 1.58 | 2.04 | 1.34 | |
| -6.79 | -4.45 | -4.65 | -5.03 | -5.13 | -2.77 | -0.82 | -8.13 | -5.62 | -5.85 | -3.82 | -2.91 | -3.50 | -2.87 | ||
| Z | 2.01 | 2.46 | 2.96 | 2.00 | 2.24 | 4.54 | 1.70 | 1.81 | 2.28 | 1.26 | 1.68 | 2.30 | 2.62 | 1.78 | |
| -2.67 | -3.64 | -4.04 | -2.64 | -1.96 | -4.42 | -2.04 | -1.62 | -2.62 | -1.83 | -1.86 | -3.22 | -3.19 | -1.02 | ||
FIGURE A26.

The head responses from test C380-T4 (offset temporal impact without a helmet): Linear acceleration components (upper left), angular acceleration components (upper right), angular speed components (lower left), and pressure responses (lower right).
FIGURE A27.

The brain responses from test C380-T4 (offset temporal impact without a helmet): Typical relative displacement time histories referred to starting positions (left), and average maximum principal and shear strain time histories (right).
FIGURE A28.

Brain motion patterns for two NDT clusters for test C380-T5 for an offset left parietal impact without a helmet.
TABLE A9.
NDT tracking intervals, starting positions, and peak excursions for test C380-T5
| Cluster
NDT # |
C2 | C1 | |||||||||||||
|---|---|---|---|---|---|---|---|---|---|---|---|---|---|---|---|
| 14 | 13 | 12 | 11 | 10 | 9 | 8 | 7 | 6 | 5 | 4 | 3 | 2 | 1 | ||
| Interval
(ms) |
Start | 0 | 0 | 0 | 0 | 0 | 0 | 0 | 0 | 0 | 0 | 0 | 0 | 0 | 0 |
| Stop | 17 | 17 | 17 | 17 | 17 | 17 | 17 | 17 | 17 | 17 | 17 | 17 | 17 | 17 | |
|
| |||||||||||||||
| Start position
(mm) |
X | 7.03 | 0.38 | 14.81 | 7.39 | 2.21 | 17.81 | 8.42 | 11.59 | 4.99 | 19.89 | 12.02 | 6.40 | 20.28 | 13.06 |
| Y | 15.89 | 20.83 | 22.04 | 16.39 | 6.74 | 1.44 | 14.69 | -30.32 | -21.86 | -22.68 | -30.70 | -37.67 | -36.18 | -27.67 | |
| Z | 53.08 | 47.09 | 45.93 | 46.54 | 44.48 | 38.17 | 36.85 | 51.55 | 43.52 | 44.10 | 41.89 | 40.98 | 42.83 | 33.95 | |
|
| |||||||||||||||
| Peak excursion
(mm) |
X | 2.35 | 3.28 | 4.16 | 2.95 | 0.82 | 0.43 | 2.92 | 0.04 | 0.34 | 0.20 | 0.03 | 0.00 | 0.01 | 0.06 |
| 0.00 | 0.00 | 0.00 | 0.00 | -1.04 | -0.18 | 0.00 | -3.00 | -1.55 | -1.96 | -2.91 | -3.81 | -4.26 | -2.16 | ||
| Y | 4.41 | 3.49 | 1.58 | 3.39 | 4.73 | 0.72 | 0.96 | 4.45 | 4.65 | 0.96 | 2.02 | 1.79 | 0.62 | 0.07 | |
| 0.00 | 0.00 | 0.00 | 0.00 | 0.00 | -0.16 | -0.08 | 0.00 | 0.00 | -0.41 | 0.00 | 0.00 | -0.46 | -0.77 | ||
| Z | 0.54 | 0.48 | 0.58 | 0.63 | 0.92 | 1.12 | 0.63 | 2.86 | 1.94 | 2.33 | 2.91 | 3.45 | 3.80 | 2.38 | |
| -0.70 | -1.45 | -1.15 | -0.56 | 0.00 | 0.00 | -0.06 | 0.00 | 0.00 | 0.00 | 0.00 | 0.00 | 0.00 | 0.00 | ||
FIGURE A29.

The head responses from test C380-T5 (offset parietal impact without a helmet): Linear acceleration components (upper left), angular acceleration components (upper right), angular speed components (lower left), and pressure responses (lower right).
FIGURE A30.

The brain responses from test C380-T5 (offset parietal impact without a helmet): Typical relative displacement time histories referred to starting positions (left), and average maximum principal and shear strain time histories (right).
FIGURE A31.

Brain motion patterns for two NDT clusters for test C380-T6 for an aligned left temporal impact without a helmet.
TABLE A10.
NDT tracking intervals, starting positions, and peak excursions for test C380-T6
| Cluster
NDT # |
C2 | C1 | |||||||||||||
|---|---|---|---|---|---|---|---|---|---|---|---|---|---|---|---|
| 14 | 13 | 12 | 11 | 10 | 9 | 8 | 7 | 6 | 5 | 4 | 3 | 2 | 1 | ||
| Interval
(ms) |
Start | 0 | 0 | 0 | 0 | 0 | 0 | 0 | 0 | 0 | 0 | 0 | 0 | 0 | 0 |
| Stop | 184 | 184 | 184 | 184 | 184 | 184 | 184 | 154 | 154 | 154 | 154 | 154 | 154 | 154 | |
|
| |||||||||||||||
| Start position
(mm) |
X | 6.43 | -1.48 | 14.43 | 8.01 | 1.48 | 14.12 | 7.67 | 9.56 | 3.76 | 18.42 | 10.33 | 4.48 | 18.30 | 11.64 |
| Y | 16.41 | 20.19 | 22.20 | 17.88 | 7.10 | 5.90 | 15.02 | -30.40 | -21.78 | -23.17 | -30.75 | -37.70 | -36.47 | -27.92 | |
| Z | 54.12 | 47.63 | 46.78 | 47.78 | 45.99 | 44.37 | 37.75 | 53.78 | 45.47 | 46.06 | 43.93 | 43.10 | 44.88 | 35.90 | |
|
| |||||||||||||||
| Peak excursion
(mm) |
X | 3.13 | 3.81 | 3.85 | 2.92 | 3.64 | 2.99 | 2.54 | 5.87 | 4.41 | 5.22 | 5.72 | 6.04 | 6.49 | 5.23 |
| -3.09 | -1.05 | -2.19 | -3.55 | -2.07 | -8.23 | -0.93 | -1.04 | -0.31 | -0.10 | -0.73 | -1.17 | -1.47 | -0.59 | ||
| Y | 5.45 | 4.65 | 3.41 | 2.88 | 4.71 | 5.04 | 1.59 | 6.09 | 4.06 | 3.57 | 2.80 | 2.03 | 2.90 | 0.85 | |
| -7.21 | -3.77 | -4.64 | -6.71 | -5.27 | -7.79 | -0.81 | -8.11 | -5.75 | -5.56 | -3.55 | -2.75 | -3.33 | -1.85 | ||
| Z | 2.72 | 3.70 | 4.10 | 2.57 | 2.91 | 2.14 | 2.44 | 3.86 | 4.14 | 3.56 | 3.93 | 4.45 | 4.46 | 3.87 | |
| -2.31 | -2.92 | -3.65 | -2.32 | -1.91 | -5.19 | -1.54 | -2.19 | -1.35 | -0.99 | -1.98 | -3.30 | -2.98 | -0.96 | ||
FIGURE A32.

The head responses from test C380-T6 (aligned temporal impact without a helmet): Linear acceleration components (upper left), angular acceleration components (upper right), angular speed components (lower left), and pressure responses (lower right).
FIGURE A33.

The brain responses from test C380-T6 (aligned temporal impact without a helmet): Typical relative displacement time histories referred to starting positions (left), and average maximum principal and shear strain time histories (right).
FIGURE A34.

Brain motion patterns for two NDT clusters for test C393-T4 for an offset left temporal impact without a helmet.
TABLE A11.
NDT tracking intervals, starting positions, and peak excursions for test C393-T4
| Cluster
NDT # |
C2 | C1 | |||||||||||||
|---|---|---|---|---|---|---|---|---|---|---|---|---|---|---|---|
| 14 | 13 | 12 | 11 | 10 | 9 | 8 | 7 | 6 | 5 | 4 | 3 | 2 | 1 | ||
| Interval
(ms) |
Start | 0 | - | 0 | 0 | 0 | 0 | 0 | 0 | 0 | 0 | 0 | 0 | 0 | 0 |
| Stop | 280 | - | 280 | 280 | 280 | 280 | 280 | 240 | 240 | 240 | 240 | 240 | 240 | 35 | |
|
| |||||||||||||||
| Start position
(mm) |
X | 9.82 | - | 2.89 | 7.61 | 1.45 | 14.52 | 7.23 | 8.90 | 0.50 | 14.34 | 8.46 | -0.08 | 14.08 | 6.90 |
| Y | 20.64 | - | 27.89 | 22.12 | 16.26 | 17.08 | 22.36 | -14.29 | -8.48 | -8.46 | -13.93 | -21.89 | -22.55 | -13.26 | |
| Z | 74.33 | - | 62.69 | 63.59 | 61.14 | 61.88 | 52.40 | 68.10 | 59.23 | 57.18 | 56.84 | 56.98 | 55.50 | 51.19 | |
|
| |||||||||||||||
| Peak excursion
(mm) |
X | 3.04 | - | 3.15 | 3.26 | 2.96 | 3.21 | 3.70 | 4.76 | 4.66 | 4.29 | 4.83 | 5.61 | 5.70 | 5.10 |
| -1.02 | - | -2.63 | -2.77 | -2.63 | -2.26 | -1.76 | -0.85 | -0.86 | -0.83 | -1.11 | -0.51 | -0.44 | -0.51 | ||
| Y | 5.54 | - | 5.46 | 5.85 | 6.01 | 5.96 | 4.73 | 6.79 | 6.32 | 5.22 | 5.39 | 5.39 | 4.74 | 4.17 | |
| -4.16 | - | -5.83 | -6.01 | -5.73 | -5.57 | -3.92 | -5.65 | -5.50 | -5.31 | -5.04 | -4.71 | -4.10 | -2.88 | ||
| Z | 1.02 | - | 1.17 | 0.96 | 0.86 | 1.09 | 0.85 | 1.45 | 1.21 | 1.54 | 1.51 | 2.60 | 2.49 | 1.42 | |
| -1.19 | - | -2.84 | -1.70 | -1.41 | -0.89 | -1.86 | -3.62 | -4.08 | -2.88 | -3.96 | -3.51 | -2.98 | -3.88 | ||
FIGURE A35.

The head responses from test C393-T4 (offset temporal impact without a helmet): Linear acceleration components (upper left), angular acceleration components (upper right), angular speed components (lower left), and pressure responses (lower right).
FIGURE A36.

The brain responses from test C393-T4 (offset temporal impact without a helmet): Typical relative displacement time histories referred to starting positions (left), and average maximum principal and shear strain time histories (right).
FIGURE A37.

Brain motion patterns for two NDT clusters for test C408-T4 for an offset occipital impact without a helmet.
TABLE A12.
NDT tracking intervals, starting positions, and peak excursions for test C408-T4
| Cluster
NDT # |
C2 | C1 | |||||||||||||
|---|---|---|---|---|---|---|---|---|---|---|---|---|---|---|---|
| 14 | 13 | 12 | 11 | 10 | 9 | 8 | 7 | 6 | 5 | 4 | 3 | 2 | 1 | ||
| Interval
(ms) |
Start | - | - | - | 0 | 0 | - | - | - | 0 | - | - | 0 | 0 | 0 |
| Stop | - | - | - | 84 | 264 | - | - | - | 206 | - | - | 264 | 264 | 264 | |
|
| |||||||||||||||
| Start position
(mm) |
X | - | - | - | -47.45 | -38.27 | - | - | - | 41.55 | - | - | 64.75 | 67.82 | 61.24 |
| Y | - | - | - | -24.41 | -18.36 | - | - | - | -35.61 | - | - | -10.06 | -2.89 | -9.13 | |
| Z | - | - | - | 66.12 | 60.72 | - | - | - | 61.81 | - | - | 48.54 | 40.46 | 32.90 | |
|
| |||||||||||||||
| Peak excursion
(mm) |
X | - | - | - | 5.36 | 7.18 | - | - | - | 6.72 | - | - | 3.47 | 1.05 | 0.00 |
| - | - | - | -10.98 | -11.05 | - | - | - | -10.48 | - | - | -11.32 | -8.48 | -4.28 | ||
| Y | - | - | - | 2.79 | 1.81 | - | - | - | 0.60 | - | - | 1.63 | 0.86 | 1.01 | |
| - | - | - | -0.62 | -0.85 | - | - | - | -4.35 | - | - | -3.99 | -3.21 | -3.21 | ||
| Z | - | - | - | 4.37 | 4.64 | - | - | - | 4.70 | - | - | 8.94 | 10.21 | 8.22 | |
| - | - | - | -10.43 | -6.27 | - | - | - | -5.67 | - | - | -9.51 | -7.61 | -6.14 | ||
FIGURE A38.

The head responses from test C408-T4 (offset occipital impact without a helmet): Linear acceleration components (upper left), angular acceleration components (upper right), angular speed components (lower left), and pressure responses (lower right).
FIGURE A39.

The brain responses from test C408-T4 (offset occipital impact without a helmet): Typical relative displacement time histories referred to starting positions (left), and average maximum principal and shear strain time histories (right).
FIGURE A40.

Brain motion patterns for two NDT clusters for test C472-T3 for an offset occipital impact without a helmet.
TABLE A13.
NDT tracking intervals, starting positions, and peak excursions for test C472-T3
| Cluster
NDT # |
C2 | C1 | |||||||||||||
|---|---|---|---|---|---|---|---|---|---|---|---|---|---|---|---|
| 14 | 13 | 12 | 11 | 10 | 9 | 8 | 7 | 6 | 5 | 4 | 3 | 2 | 1 | ||
| Interval
(ms) |
Start | 1 | 24 | 4 | 0 | 0 | 0 | 0 | 0 | 0 | 0 | 0 | 0 | 0 | 0 |
| Stop | 307 | 307 | 307 | 307 | 307 | 307 | 307 | 307 | 307 | 307 | 307 | 307 | 307 | 307 | |
|
| |||||||||||||||
| Start position
(mm) |
X | -2.36 | 12.24 | 5.87 | 5.34 | 4.07 | -0.43 | 13.72 | 39.49 | 51.10 | 48.26 | 47.05 | 43.23 | 55.64 | 42.13 |
| Y | -18.70 | -17.10 | -27.23 | -18.97 | -9.25 | -19.80 | -18.24 | -6.76 | -11.38 | 3.19 | -6.73 | -14.27 | -6.36 | 0.25 | |
| Z | 23.98 | 26.01 | 17.05 | 16.74 | 17.83 | 10.05 | 11.86 | 47.33 | 44.73 | 44.72 | 39.81 | 33.66 | 34.88 | 32.98 | |
|
| |||||||||||||||
| Peak excursion
(mm) |
X | 0.24 | 0.17 | 0.24 | 0.34 | 0.46 | 1.04 | 0.88 | 2.74 | 2.39 | 1.44 | 2.09 | 1.23 | 1.06 | 1.49 |
| -0.74 | -0.92 | -1.54 | -1.54 | -0.98 | -2.21 | -2.48 | -1.87 | -1.79 | -0.99 | -1.71 | -1.25 | -1.15 | -1.63 | ||
| Y | 0.00 | 0.00 | 0.28 | 0.37 | 0.31 | 0.65 | 0.59 | 0.00 | 0.00 | 0.00 | 0.00 | 0.00 | 0.00 | 0.03 | |
| -0.88 | -0.77 | -0.82 | -0.85 | -0.94 | -0.85 | -1.02 | -1.19 | -1.02 | -1.05 | -1.02 | -0.85 | -0.85 | -0.91 | ||
| Z | 0.51 | 0.16 | 0.36 | 0.06 | 0.02 | 0.06 | 0.26 | 0.45 | 0.86 | 0.15 | 0.90 | 1.15 | 1.15 | 0.91 | |
| -0.94 | -0.93 | -1.05 | -0.98 | -0.93 | -0.99 | -1.08 | -1.21 | -2.13 | -1.42 | -1.86 | -2.28 | -2.51 | -1.73 | ||
FIGURE A41.

The brain responses from test C472-T3 (offset occipital impact without a helmet): Typical relative displacement time histories referred to starting positions (left), and average maximum principal and shear strain time histories (right).
APPENDIX B - The peak head kinematics processed using CFC 1 kHz
TABLE B1.
Peak head kinematics responses (CFC 1 kHz)
| Specimen and test | Speed
(m/s) |
Linear acceleration
(g) |
Res.
(g) |
HIC
15ms |
Angular acceleration
(rad/s/s) |
Angular speed
(rad/s) |
|||||||
|---|---|---|---|---|---|---|---|---|---|---|---|---|---|
| X | Y | Z | X | Y | Z | X | Y | Z | |||||
| C288 | T1 | 3.3 | 85 | 55 | 51 | 87 | 202 | 5777 | 5161 | 3458 | 4 | 16 | 4 |
| -30 | -39 | -46 | -3085 | -5525 | -6019 | -1 | -2 | -6 | |||||
| T2 | 3.0 | 34 | 43 | 21 | 40 | 56 | 2932 | 3486 | 1355 | 2 | 17 | 4 | |
| -12 | -24 | -23 | -3665 | -2670 | -5843 | -2 | -12 | -7 | |||||
| T3 | 3.5 | 140 | 124 | 316 | 337 | 1578 | 11556 | 39203 | 5331 | 8 | 29 | 7 | |
| -39 | -53 | -287 | -15997 | -14896 | -13578 | -6 | -10 | -7 | |||||
| T4 | 3.0 | - | - | - | - | - | - | - | - | - | - | - | |
| - | - | - | - | - | - | - | - | - | |||||
|
| |||||||||||||
| C241 | T1 | 3.6 | 171 | 30 | 160 | 219 | 1407 | 7771 | 19964 | 9803 | 5 | 22 | 6 |
| -14 | -70 | -140 | -5407 | -20045 | -5582 | -3 | -21 | -5 | |||||
|
| |||||||||||||
| T2 | 3.2 | 143 | 41 | 93 | 172 | 633 | 4326 | 13658 | 8064 | 2 | 29 | 1 | |
| -17 | -56 | -163 | -7037 | -18587 | -6131 | -9 | -16 | -8 | |||||
| T3 | 3.5 | 61 | 17 | 30 | 86 | 112 | 906 | 3678 | 2731 | 0 | 17 | 0 | |
| -4 | -26 | -68 | -1653 | -4904 | -2676 | -8 | -7 | -4 | |||||
| T4 | 3.5 | 61 | 17 | 36 | 71 | 119 | 1004 | 3425 | 1321 | 2 | 25 | 5 | |
| -4 | -6 | -52 | -1554 | -3740 | -2565 | -11 | -8 | -7 | |||||
| T5 | 3.7 | 291 | 51 | 125 | 311 | 938 | 5075 | 20966 | 6016 | 9 | 14 | 3 | |
| -54 | -75 | -146 | -10414 | -7299 | -11945 | -2 | -11 | -11 | |||||
| T6 | 3.3 | 165 | 26 | 118 | 199 | 406 | 6152 | 7623 | 4261 | 9 | 10 | 0 | |
| -25 | -51 | -93 | -7003 | -9200 | -7089 | -1 | -6 | -13 | |||||
|
| |||||||||||||
| C015 | T1 | 3.6 | 129 | 32 | 51 | 124 | 312 | 6283 | 9671 | 7562 | 9 | 15 | 9 |
| -9 | -74 | -77 | -3872 | -9463 | -2902 | 0 | -14 | 0 | |||||
| T2 | 3.8 | 217 | 88 | 77 | 233 | 595 | 6899 | 7349 | 7964 | 6 | 16 | 10 | |
| -10 | -87 | -108 | -3243 | -10592 | -10227 | -2 | -15 | -3 | |||||
|
| |||||||||||||
| C064 | T1 | 3.9 | 91 | 13 | 32 | 112 | 277 | 68 | 5931 | 5525 | 0 | 10 | 5 |
| -12 | -67 | -21 | -202 | -5428 | -2181 | -1 | -8 | -1 | |||||
| T2 | 3.9 | 59 | 22 | 51 | 68 | 129 | 139 | 6091 | 2715 | 0 | 23 | 5 | |
| -34 | -37 | -35 | -141 | -4001 | -1753 | -2 | -9 | 0 | |||||
| T3 | 3.9 | 114 | 113 | 145 | 193 | 782 | 3556 | 18171 | 5520 | 3 | 17 | 8 | |
| -18 | -82 | -137 | -5515 | -7757 | -7763 | -3 | -25 | -5 | |||||
| T4 | 3.9 | 146 | 72 | 77 | 153 | 372 | 2479 | 7208 | 5612 | 1 | 10 | 6 | |
| -37 | -64 | -57 | -3035 | -5157 | -4348 | -1 | -16 | -6 | |||||
|
| |||||||||||||
| C380 | T1 | - | 16 | 13 | 11 | 91 | 168 | 5497 | 1152 | 5389 | 30 | 3 | 13 |
| -15 | -91 | -25 | -2793 | -2629 | -4082 | -9 | -5 | -4 | |||||
| T2 | 3.7 | 43 | 15 | 9 | 74 | 78 | 4160 | 1726 | 6338 | 21 | 14 | 18 | |
| -6 | -62 | -22 | -1752 | -1452 | -1769 | -12 | 0 | 0 | |||||
| T3 | 3.2 | 19 | 4 | 7 | 83 | 138 | 4986 | 770 | 5005 | 22 | 2 | 14 | |
| -10 | -82 | -21 | -1984 | -2062 | -3774 | -5 | -2 | 0 | |||||
| T4 | 3.5 | 40 | 82 | 52 | 218 | 1002 | 20622 | 5944 | 15156 | 28 | 6 | 27 | |
| -82 | -216 | -62 | -6907 | -4805 | -11969 | -7 | -5 | -1 | |||||
| T5 | 3.1 | 60 | 27 | 16 | 111 | 86 | 4252 | 1857 | 9449 | 14 | 14 | 20 | |
| -10 | -93 | -19 | -1906 | -1203 | -2691 | -13 | -6 | -8 | |||||
| T6 | 3.3 | 27 | 44 | 40 | 179 | 486 | 12283 | 4359 | 12377 | 23 | 8 | 24 | |
| -51 | -176 | -35 | -2024 | -4591 | -7291 | -5 | -6 | 0 | |||||
|
| |||||||||||||
| C393 | T1 | 3.6 | 18 | 7 | 14 | 94 | 210 | 4317 | 1141 | 5456 | 20 | 2 | 15 |
| -4 | -95 | -18 | -987 | -1793 | -4091 | -3 | -4 | -2 | |||||
| T2 | 3.6 | 9 | 8 | 16 | 44 | 38 | 4273 | 2343 | 2226 | 24 | 12 | 11 | |
| -5 | -41 | -19 | -2376 | -2022 | -1371 | -18 | -4 | -2 | |||||
| T3 | 3.7 | 66 | 152 | 121 | 250 | 835 | 14446 | 10135 | 13004 | 23 | 5 | 24 | |
| -26 | -246 | -80 | -5019 | -7090 | -16258 | -2 | -5 | -1 | |||||
| T4 | 3.6 | 74 | 130 | 105 | 311 | 757 | 16928 | 10762 | 22683 | 28 | 10 | 18 | |
| -46 | -293 | -125 | -7478 | -8060 | -12115 | -18 | -10 | 0 | |||||
|
| |||||||||||||
| C408 | T1 | 2.9 | 71 | 11 | 22 | 94 | 118 | 3361 | 2664 | 4854 | 6 | 12 | 7 |
| -6 | -60 | -43 | -1459 | -2659 | -5184 | -8 | -3 | -9 | |||||
| T2 | 3.0 | 31 | 27 | 17 | 66 | 90 | 2610 | 6617 | 2023 | 2 | 20 | 0 | |
| -28 | -26 | -71 | -7600 | -6805 | -4632 | -5 | -10 | -8 | |||||
| T3 | 3.1 | 47 | 31 | 12 | 90 | 99 | 1919 | 6502 | 2829 | 5 | 22 | 3 | |
| 0 | -31 | -80 | -3092 | -4779 | -4686 | 0 | -4 | -7 | |||||
| T4 | 3.1 | 321 | 259 | 163 | 408 | 2540 | 17182 | 25630 | 13340 | 7 | 22 | 10 | |
| -45 | -221 | -329 | -19239 | -25159 | -22222 | -4 | -4 | -16 | |||||
| T5 | 3.0 | 279 | 231 | 126 | 357 | 2004 | 26491 | 16822 | 23880 | 15 | 16 | 12 | |
| -71 | -231 | -316 | -22533 | -29390 | -23113 | -5 | -11 | -17 | |||||
APPENDIX C - The peak average strain responses processed using CFC 180 Hz
TABLE C1.
Peak average maximum strain responses of the brain (CFC 180 Hz)
| Specimen and test | Strain | Strain rate (s-1) | Strain * rate (s-1) | ||||||||||
|---|---|---|---|---|---|---|---|---|---|---|---|---|---|
| Principal | Shear | Principal | Shear | Principal | Shear | ||||||||
| C2 | C1 | C2 | C1 | C2 | C1 | C2 | C1 | C2 | C1 | C2 | C1 | ||
| C288 | T1 | 0.045 | 0.053 | 0.057 | 0.044 | 54.9 | 26.1 | 111.6 | 67.1 | 0.679 | 1.193 | 1.093 | 0.883 |
| T2 | 0.076 | 0.056 | 0.074 | 0.051 | 39.3 | 29.6 | 29.9 | 25.8 | 1.544 | 1.448 | 1.548 | 0.090 | |
| T3 | 0.045 | 0.079 | 0.060 | 0.059 | 58.1 | 34.4 | 40.1 | 36.2 | 0.508 | 0.983 | 0.920 | 0.895 | |
| T4 | 0.087 | 0.043 | 0.042 | 0.060 | 32.5 | 22.4 | 78.8 | 28.1 | 1.791 | 0.434 | 0.463 | 0.809 | |
|
| |||||||||||||
| C241 | T1 | - | - | - | - | - | - | - | - | - | - | - | - |
| T2 | 0.119 | - | 0.078 | - | 66.2 | - | 33.6 | - | 3.647 | - | 2.347 | - | |
| T3 | 0.059 | - | 0.026 | - | 32.0 | - | 11.8 | - | 0.766 | - | 0.151 | - | |
| T4 | - | - | - | - | - | - | - | - | - | - | - | - | |
| T5 | 0.016 | 0.047 | 0.019 | 0.036 | 24.1 | 29.7 | 17.5 | 52.3 | 0.044 | 0.711 | 0.059 | 0.261 | |
| T6 | 0.028 | 0.027 | 0.038 | 0.020 | 19.0 | 8.4 | 15.2 | 25.4 | 0.221 | 0.131 | 0.264 | 0.134 | |
|
| |||||||||||||
| C015 | T1 | 0.100 | 0.041 | 0.053 | 0.041 | 58.9 | 12.6 | 26.1 | 10.5 | 3.017 | 0.386 | 0.760 | 0.371 |
| T2 | |||||||||||||
|
| |||||||||||||
| C064 | T1 | 0.087 | 0.050 | 0.071 | 0.035 | 26.0 | 36.7 | 50.3 | 28.7 | 1.526 | 0.726 | 0.914 | 0.332 |
| T2 | 0.213 | 0.026 | 0.091 | 0.019 | 146.5 | 14.2 | 45.2 | 5.9 | 11.737 | 0.232 | 2.613 | 0.091 | |
| T3 | - | - | - | - | - | - | - | - | - | - | - | - | |
| T4 | 0.020 | 0.022 | 0.013 | 0.021 | 10.3 | 21.3 | 4.5 | 22.7 | 0.125 | 0.082 | 0.042 | 0.112 | |
|
| |||||||||||||
| C380 | T1 | 0.046 | 0.028 | 0.036 | 0.042 | 68.4 | 36.8 | 53.0 | 34.8 | 0.396 | 0.230 | 0.218 | 0.219 |
| T2 | 0.036 | 0.040 | 0.030 | 0.035 | 27.5 | 12.3 | 15.4 | 11.4 | 0.319 | 0.331 | 0.185 | 0.276 | |
| T3 | 0.038 | 0.034 | 0.038 | 0.042 | 54.2 | 23.6 | 35.6 | 14.8 | 0.404 | 0.298 | 0.243 | 0.207 | |
| T4 | 0.027 | 0.023 | 0.026 | 0.020 | 9.6 | 17.3 | 16.6 | 17.1 | 0.214 | 0.123 | 0.123 | 0.082 | |
| T5 | 0.050 | 0.030 | 0.046 | 0.021 | 58.2 | 40.8 | 47.0 | 27.6 | 0.448 | 0.243 | 0.492 | 0.164 | |
| T6 | 0.040 | 0.027 | 0.035 | 0.023 | 52.0 | 33.4 | 46.6 | 26.5 | 0.546 | 0.203 | 0.335 | 0.143 | |
|
| |||||||||||||
| C393 | T1 | 0.090 | 0.044 | 0.089 | 0.037 | 93.4 | 26.6 | 60.3 | 42.4 | 1.908 | 0.600 | 1.419 | 0.403 |
| T2 | 0.116 | 0.042 | 0.092 | 0.033 | 33.6 | 56.1 | 32.6 | 44.4 | 2.485 | 0.515 | 2.251 | 0.420 | |
| T3 | 0.026 | 0.046 | 0.024 | 0.040 | 29.3 | 22.1 | 24.5 | 18.4 | 0.170 | 0.553 | 0.126 | 0.424 | |
| T4 | 0.035 | 0.042 | 0.027 | 0.036 | 38.1 | 24.8 | 19.9 | 24.3 | 0.468 | 0.504 | 0.171 | 0.378 | |
|
| |||||||||||||
| C408 | T1 | - | - | - | - | - | - | - | - | - | - | - | - |
| T2 | - | - | - | - | - | - | - | - | - | - | - | - | |
| T3 | - | 0.021 | - | 0.014 | - | 17.5 | - | 14.5 | - | 0.109 | - | 0.047 | |
| T4 | - | 0.021 | - | 0.020 | - | 21.5 | - | 5.5 | - | 0.091 | - | 0.083 | |
| T5 | - | 0.028 | - | 0.026 | - | 15.3 | - | 13.9 | - | 0.240 | - | 0.127 | |
|
| |||||||||||||
| C472 | T1 | 0.023 | 0.022 | 0.019 | 0.031 | 20.2 | 15.1 | 14.6 | 14.5 | 0.123 | 0.132 | 0.082 | 0.204 |
| T2 | 0.020 | 0.019 | 0.016 | 0.016 | 26.4 | 23.5 | 24.5 | 16.5 | 0.094 | 0.092 | 0.072 | 0.060 | |
| T3 | 0.013 | 0.011 | 0.012 | 0.010 | 6.9 | 18.3 | 14.3 | 11.8 | 0.043 | 0.042 | 0.028 | 0.029 | |
| T4 | 0.016 | 0.019 | 0.014 | 0.015 | 11.7 | 18.7 | 9.6 | 11.6 | 0.070 | 0.083 | 0.055 | 0.056 | |
APPENDIX D - The NDT implanting scheme for specimen C472
FIGURE D1.

Inferior view of axial brain slices from the right hemisphere of C472 showing the NDT locations (white arrows).
APPENDIX E - Comparison of oscillatory data processed using different channel filter classes
FIGURE E1.

Comparison of CFC 180 Hz and 1 kHz linear acceleration data in the direction of impact and CFC 1 kHz intracranial coup pressure for example oscillatory responses from the C241 test series (left), and comparison of CFC 180 Hz and 1 kHz angular acceleration data in the plane of impact for the same tests (right).
Footnotes
This work was carried out in accordance with the practices outlined by the Willed Body Program of the Wayne State University School of Medicine, Department of Anatomy.
References
- Al-Bsharat AS, Hardy WN, Yang KH, Khalil TB, King AI, Tashman S. Proc. 43rd Stapp Car Crash Conference. Society of Automotive Engineers; Warrendale PA: 1999. Brain/skull relative displacement magnitude due to blunt head impact: New experimental data and model; pp. 321–332. [Google Scholar]
- Bain AC, Meaney DF. Tissue-level thresholds for axonal damage in an experimental model of central nervous system white matter injury. Journal of Biomechanical Engineering. 2000;122:615–622. doi: 10.1115/1.1324667. [DOI] [PubMed] [Google Scholar]
- Bayly PV, Cohen TS, Leister EP, Ajo D, Leuthardt EC, Genin GM. Deformation of the human brain induced by mild acceleration. Journal of Neurotrauma. 2005;22(8):845–856. doi: 10.1089/neu.2005.22.845. [DOI] [PMC free article] [PubMed] [Google Scholar]
- Cater HL, Sundstrom LE, Morrison B. Temporal development of hippocampal cell death is dependent on tissue strain but not strain rate. Journal of Biomechanics. 2006;39(15):2810–2818. doi: 10.1016/j.jbiomech.2005.09.023. [DOI] [PubMed] [Google Scholar]
- Centers for Disease Control and Prevention. Surveillance for traumatic brain injury deaths --- United States, 1989-1998. Morbidity and Mortality Weekly Report. 2002;51(SS10):1–16. [PubMed] [Google Scholar]
- Chason JL, Hardy WG, Webster JE, Gurdjian ES. Alterations in cell structure of the brain associated with experimental concussion. Journal of Neurosurgery. 1958;15:135–139. doi: 10.3171/jns.1958.15.2.0135. [DOI] [PubMed] [Google Scholar]
- Galbraith JA, Thibault LE, Matteson DR. Mechanical and electrical responses of the squid giant axon to simple elongation. Journal of Biomechanical Engineering. 1993;115:13–22. doi: 10.1115/1.2895464. [DOI] [PubMed] [Google Scholar]
- Gosch HH, Gooding E, Schneider RC. Distortion and displacement of the brain in experimental head injuries. Surgical Forum. 1969;20:425–426. [PubMed] [Google Scholar]
- Gurdjian ES, Lissner HR, Evans FG, Patrick LM, Hardy WG. Intracranial pressure and acceleration accompanying head impacts in human cadavers. Surgery, Gynecology and Obstetrics. 1961;113:185–190. [PubMed] [Google Scholar]
- Hardy WN. Current Techniques for Measurement in Biomechanics. In: Nahum AM, Melvin JW, editors. Accidental Injury: Biomechanics and Prevention. Second. Springer-Verlag; New York, NY: 2002. [Google Scholar]
- Hardy WN, Foster CD, King AI, Tashman S. Investigation of brain injury kinematics: Introduction of a new technique. Crashworthiness, Occupant Protection and Biomechanics in Transportation Systems AMD. 1997;225:241–254. [Google Scholar]
- Hardy WN, Foster CD, Mason MJ, Yang KH, King AI, Tashman S. Investigation of Head Injury Mechanisms Using Neutral Density Technology and High-Speed Biplanar X-ray. Stapp Car Crash Journal. 2001;45:337–368. doi: 10.4271/2001-22-0016. [DOI] [PubMed] [Google Scholar]
- Hardy WN, Khalil TB, King AI. Literature Review of Head Injury Biomechanics. International Journal of Impact Engineering. 1994;15(4):561–586. [Google Scholar]
- Hardy WN, Mason MJ, Foster CD, Yang KH, King AI. Comparison of intracranial pressure response to cadaver head kinematics. Journal of Biomechanics. 2006;49(S1):S155. [Google Scholar]
- Hodgson VR, Gurdjian ES, Thomas LM. Experimental skull deformation and brain displacement demonstrated by flash x ray technique. Journal of Neurosurgery. 1966;25:49–52. doi: 10.3171/jns.1966.25.5.0549. [DOI] [PubMed] [Google Scholar]
- Horgan TJ, Gilchrist MD. Influence of FE model variability in predicting brain motion and intracranial pressure changes in head impact simulations. Int J of Crashworthiness. 2004;9(4):401–418. [Google Scholar]
- Ji S, Zhu Q, Dougherty L, Margulies SS. In vivo measurements of human brain displacement. Stapp Car Crash Journal. 2004;48:227–237. doi: 10.4271/2004-22-0010. [DOI] [PubMed] [Google Scholar]
- Kallieris D, Rizzetti A, Mattern R. Proc. AGARD Conference 597. Advisory Group for Aerospace Research and Development; Neuilly-Sur-Seine, FR: 1997. Some observations to the skull-brain trauma; pp. 1–4. [Google Scholar]
- King AI, Hardy WN, Mason MJ, Tashman S. Comparison of Relative Motion Between the Brain and Skull of the Human Cadaver for Rotation in the Coronal and Sagittal Planes. 4th World Congress of Biomechanics; Calgary, Alberta, Canada. 2002. [Google Scholar]
- King AI, Ruan JS, Zhou C, Hardy WN, Khalil TB. Recent Advances in Biomechanics of Brain Injury Research. Journal of Neurotrauma. 1994;12(4):651–658. doi: 10.1089/neu.1995.12.651. [DOI] [PubMed] [Google Scholar]
- King AI, Yang KH, Zhang L, Hardy WN. Is Angular Acceleration More Injurious to the Brain than Linear Acceleration?. Frontiers in Biomedical Engineering; Proc. World Congress of Chinese Biomedical Engineers; Taipei, Taiwan. NY, New York: Kluwer/Plenum Academic Publishers; 2003. [Google Scholar]
- Kleiven S, Hardy WN. Correlation of an FE Model of the Human Head with Local Brain Motion – Consequences for Injury Prediction. Stapp Car Crash Journal. 2002;46:123–143. doi: 10.4271/2002-22-0007. [DOI] [PubMed] [Google Scholar]
- Margulies SS, Thibault LE, Gennarelli TA. Physical model simulations of brain injury in the primate. Journal of Biomechanics. 1990;23:823–836. doi: 10.1016/0021-9290(90)90029-3. [DOI] [PubMed] [Google Scholar]
- Masuzawa H, Nadamura N, Hirakawa K, Sano K, Matsuno M. Experimental head injury & concussion in monkey using pure linear acceleration impact. Neurologia medico-chirurgica (Tokyo) 1976;16(PT1):77–90. doi: 10.2176/nmc.16pt1.77. [DOI] [PubMed] [Google Scholar]
- McGowan JC, McCormack TM, Grossman RI, Mendonca R, Chen XH, Berlin JA, Meaney DF, Xu BN, Cecil KM, McIntosh TK, Smith DH. Diffuse axonal pathology detected with magnetization transfer imaging following brain injury in the pig. Magnetic Resonance in Medicine. 1999;41(4):727–733. doi: 10.1002/(sici)1522-2594(199904)41:4<727::aid-mrm11>3.0.co;2-6. [DOI] [PubMed] [Google Scholar]
- Morrison B, Cater HL, Wang CCB, Thomas FC, Hung CT, Ateshian GA, Sundstrom LE. A tissue level tolerance criterion for living brain developed with an in vitro model of traumatic mechanical loading. Stapp Car Crash Journal. 2003;47:93–105. doi: 10.4271/2003-22-0006. [DOI] [PubMed] [Google Scholar]
- Nahum A, Smith R, Ward C. Proc. 21st Stapp Car Crash Conference. Society of Automotive Engineers; Warrendale, PA: 1977. Intracranial pressure dynamics during head impact; pp. 337–366. [Google Scholar]
- National Center for Injury Prevention and Control. Report to congress on mild traumatic brain injury in the United States: Steps to prevent a serious public health problem 2003 [Google Scholar]
- Nusholtz GS, Kaiker PS, Gould WS. Two factors critical in the pressure response of the impacted head. Aviation, Space, and Environmental Medicine. 1987;58:1157–1164. [PubMed] [Google Scholar]
- Nusholtz GS, Lux P, Kaiker PS, Janicki MA. Proc. 28th Stapp Car Crash Conference. Society of Automotive Engineers; Warrendale, PA: 1984. Head impact response - Skull deformation and angular accelerations; pp. 41–74. [Google Scholar]
- Ommaya AK. Biomechanics of Head Injuries: Experimental Aspects. In: Nahum A, Melvin JW, editors. Biomechanics of Trauma. Appleton-Century-Crofts; East Norwalk, Conn: 1984. [Google Scholar]
- Pudenz RH, Shelden CH. The Lucite calvarium a method for direct observation of the brain. II. Cranial trauma and brain movement. Journal of Neurosurgery. 1946;3:87–505. doi: 10.3171/jns.1946.3.6.0487. [DOI] [PubMed] [Google Scholar]
- Shatsky SA. Proc. 17th Stapp Car Crash Conference. Society of Automotive Engineers; Warrendale, PA: 1973. Flash x ray cinematography during impact injury; pp. 361–376. [Google Scholar]
- Shatsky SA, Alter WA, III, Evans DE, Armbruster V, Clark G. Proc. 18th Stapp Car Crash Conference. Society of Automotive Engineers; Warrendale, PA: 1974. Traumatic distortions of the primate head and chest: Correlation of biomechanical, radiological and pathological data; pp. 351–381. [Google Scholar]
- Shatsky SA, Evans DE, Miller F, Martins A. High speed angiography of experimental head injury. Journal of Neurosurgery. 1974;41:523–530. doi: 10.3171/jns.1974.41.5.0523. [DOI] [PubMed] [Google Scholar]
- Shelden CH, Pudenz RH, Restarski JS, Craig WM. The Lucite calvarium a method for direct observation of the brain. I: The surgical and Lucite processing techniques. Journal of Neurosurgery. 1944;1:67–75. doi: 10.3171/jns.1946.3.6.0487. [DOI] [PubMed] [Google Scholar]
- Stalnaker RL, Melvin JW, Nusholtz GS, Alem NM, Benson JB. Proc. 21st Stapp Car Crash Conference. Society of Automotive Engineers; Warrendale PA: 1977. Head impact response; pp. 303–335. [Google Scholar]
- Takhounts EG, Eppinger RH, Campbell JQ, Tannous RE, Power ED, Shook LS. On the development of the SIMon finite element head model. Stapp Car Crash Journal. 2003;47:107–133. doi: 10.4271/2003-22-0007. [DOI] [PubMed] [Google Scholar]
- Tashman S, Anderst W. In-vivo measurement of dynamic joint motion using high speed biplane radiography and CT: Application to canine ACL deficiency. Journal of Biomechanical Engineering. 2003;125(2):238–245. doi: 10.1115/1.1559896. [DOI] [PubMed] [Google Scholar]
- Thomas LM, Roberts VL, Gurdjian ES. Impact induced pressure gradients along three orthogonal axes in the human skull. Journal of Neurosurgery. 1967;26:316–349. doi: 10.3171/jns.1967.26.3.0316. [DOI] [PubMed] [Google Scholar]
- Trosseille X, Tarriere C, Lavaste F, Guillon F, Domont A. Proc. 36th Stapp Car Crash Conference. Society of Automotive Engineers; Warrendale, PA: 1992. Development of a F.E.M. of the human head according to a specific test protocol; pp. 235–253. [Google Scholar]
- Ward C, Chan M, Nahum A. Proc. 24th Stapp Car Crash Conference. Society of Automotive Engineers; Warrendale, PA: 1980. Intracranial Pressure- A Brain Injury Criterion; pp. 163–185. [Google Scholar]
- Zhang L, Dwarampudi R, Yang KH, King AI. Effectiveness of the Football Helmet Assessed by Finite Element Modeling and Impact Testing. Proc. 2003 IRCOBI conference.2003. [Google Scholar]
- Zhang L, Yang KH, Dwarampudi R, Omori K, Li T, Chang K, Hardy WN, Khalil TB, King AI. Recent Advances in Brain Injury Research: A New Human Head Model Development and Validation. Stapp Car Crash Journal. 2001;45:369–393. doi: 10.4271/2001-22-0017. [DOI] [PubMed] [Google Scholar]
- Zhang L, Yang KH, King AI. A Proposed Injury Threshold for Minor Traumatic Brain Injury. Journal of Biomechanical Engineering. 2004;126:226–236. doi: 10.1115/1.1691446. [DOI] [PubMed] [Google Scholar]
- Zou H, Schmiedeler JP, Hardy WN. Separating Brain Motion into Rigid Body Displacement and Deformation under Low-Severity Impacts. Journal of Biomechanics. 2007;40:1183–1191. doi: 10.1016/j.jbiomech.2006.06.018. [DOI] [PubMed] [Google Scholar]