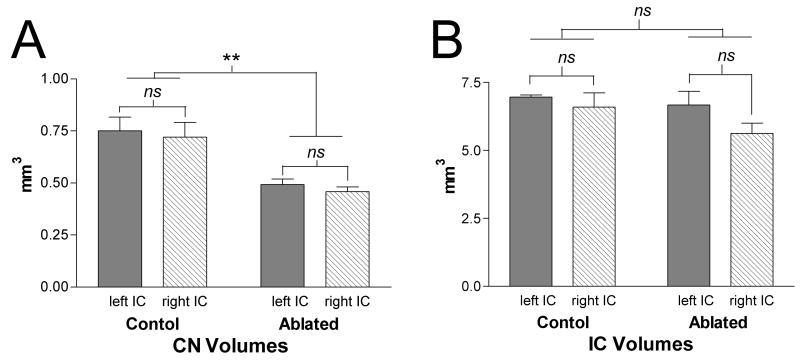
Figure 3.
Bar graphs illustrating the mean percent difference in volumes for CN (A) and IC (B) in the P9 cochlear ablation group compared to controls. Whiskers indicate standard error of the mean (N=8). There is significant reduction in volume of about 35% for both the left and right CN compared to controls. IC volumes in the ablated group were unchanged from the control condition. No differences were observed in these cases between reduction of the left and right CN volumes consistent with symmetrical cochlear ablation on each side.

