1 Introduction
While protons in living tissue achieve sufficient thermal polarization for standard magnetic resonance imaging (MRI) procedures, gaseous samples have three orders of magnitude lower density making diagnostic imaging impractical. Similarly, the low body tissue density and susceptibility mismatched interfaces inside the lungs present a challenge to proton MRI of the lungs. Hyperpolarized gases are polarized by alternative methods, such as spin-exchange optical pumping (SEOP) [1] or metastability exchange optical pumping (MEOP) [2], to extremely high values to compensate for the density difference, and they offer great potential as imaging agents. They can be introduced into the body non-invasively by breathing and imaged with no background. Two noble gases, 3He and 129Xe, have nuclear spin one-half and gyromagnetic ratios relative to that of the proton of 0.76 and 0.28, respectively. They present the advantage of having zero quadrupole moment and, as a consequence, long T1 relaxation times after being polarized. Although the first MRI application of hyperpolarized noble gases involved 129Xe [3], thereafter the research community focused mainly on 3He because of the well-established polarizing methods [4,5]. Relatively large quantities of hyperpolarized 3He are produced with 50–80% polarization using metastability-exchange optical pumping. 3He in the gas state has a T1 relaxation time that can reach days and even weeks [6,7]. As a beneficial consequence, 3He can be distributed from a central polarizing site to MRI centers [8]. Practical limitations of MRI studies involving 3He include its confinement to the lung gas space only, since its solubility in blood and tissue is extremely low [12]. Also, its unnatural source on Earth, mainly coming from tritium radioactive decay, makes its future widespread clinical applicability questionable. In contrast, xenon is extracted from the atmosphere by partial distillation with the desired 129Xe isotope having significant 26.4% natural abundance. Commercial enrichment can raise that abundance by a factor of three or more. Xenon is soluble in blood with a large partition coefficient of ~0.1 [13] and readily diffuses throughout tissues. 129Xe displays an NMR spectrum with chemical shifts in resonance frequency that characterize its microscopic/molecular environment [14,15]. It offers longitudinal magnetization that survives several seconds to several tens of seconds in vivo [16,17]. The time and spatial dependence of its distribution in the body can reveal functional attributes [18,19]. Xenon biological effects of anesthesia are well characterized and well tolerated [20].
Spin-exchange optical pumping [21,22] relies on the unpaired electron of the alkali atoms, such as Rb, which is polarized through resonant interaction with circularly polarized light provided by a continuous laser source. Subsequently, the polarization is transferred through a Fermi-contact dipole-dipole interaction to the noble gas nucleus. The presence of nitrogen is required in the gas mixture for quenching the fluorescence of the excited alkali vapor atoms [4]. Natural helium (4He) is also commonly used as a buffer gas to increase the overall pressure inside the cell in order to take advantage of the pressure broadening effects on the Rb D1 absorption line [23].
Polarization transfer from the polarized Rb electron to the 129Xe nucleus can occur during two types of atomic collisions: two-body binary scattering (very short time scale) and van der Waals molecules (longer lifetime). The former is less efficient and dominates at high pressures. The latter is more efficient and dominates at low pressures. With few exceptions [24], all previous polarizer designs have chosen the high-pressure limit in order to increase the laser absorption and optical pumping rate at the expense of the spin-exchange rate.
Optical pumping of Rb must exceed depolarization processes. Collisions with the container walls fully depolarize Rb atoms. Buffer gases contribute as well to the total Rb spin-destruction rate. However, the dominant term is given by the interactions with the Xe atoms through spin-rotation (loss of the Rb electron spin into the Rb-Xe colliding pair total angular momentum after the break-up). The Rb-Xe spin-destruction rate is four orders of magnitude larger than Rb-He and is proportional to the Xe concentration in the gas mixture. Therefore, powerful and continuous lasers are needed in order to sustain Rb polarization at close to unity values when in in the presence of appreciable concentrations of xenon.
In its simplified form the equation for Xe polarization during the SEOP process can be written as [21]:
| (1) |
where PA is the alkali vapor polarization, Γ is the noble gas nuclear spin-destruction rate, and γSE is the spin-exchange rate between the alkali atoms and gas nuclei. Similar to the alkali, the noble gas nuclei can lose their polarization interacting with the container walls or with the other atoms in the composition. Xenon polarization can never exceed the rubidium polarization. Moreover, in order to approach the Rb polarization the noble gas has to be in contact with the alkali vapor for several spin-up e-folding times. The spin-up time is defined as (γSE + Γ)−1 and for Rb-Xe pairs under our operating conditions is on the order of seconds. This implies that high polarizations of xenon can be achieved only if low concentrations of xenon are in contact with highly polarized rubidium for characteristically long times: the challenge of producing large quantities of highly polarized xenon.
2 Materials and Methods
The UNH prototype counter-flow xenon polarizer is a large scale system, vertically oriented, with major components arranged as presented in Fig. 1a.
Fig. 1.
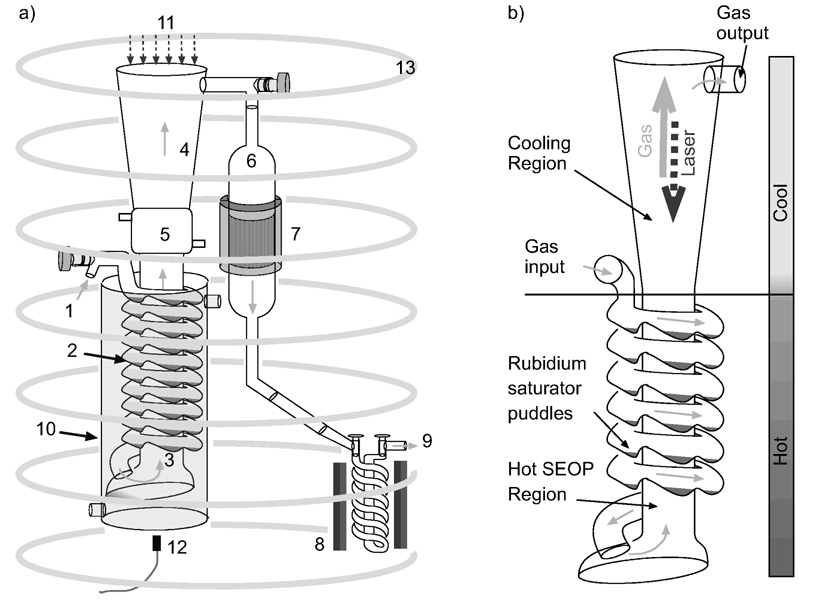
a) UNH polarizer schematic: 1) xenon/nitrogen/helium gas mixture input; 2) Rb metal puddles vapor sources; 3) SEOP hot region; 4) Rb condensing cold region; 5) liquid cooled jacket; 6) gas transport down-tube; 7) polarization measurement NMR system; 8) Xe freeze-out helix located inside the 0.3 T magnet-box; 9) gas exhaust; 10) oil heated oven/bath; 11) laser entrance; 12) laser spectrum absorption monitor (spectrometer); 13) B0 field coils. The solid arrows show the gas trajectory in the system. b) Polarizing column with its main components.
Polarizing Column
The novelty of our system derives mainly from the design of the polarizing cell. The prototype cell can be described in terms of three different operational regions, as shown in Fig. 1: rubidium saturation region, laser absorption and polarizing region, and rubidium condensing region. The lower part of the column, ~1 m long, includes a helical glass tube enclosing a 4.0 cm diameter polarizing chamber, connected to each other at the bottom. These two elements are positioned inside of the heating oven. The helix is made from a glass tube 2.5 cm in diameter and over 600 cm long. Special bumps blown into the helix (Fig. 1) hold the Rb metal pools. The helical shape offers a long path for the entering gas mixture of xenon, nitrogen, and helium to reach the operating temperature and to saturate the gas with Rb vapor. It is typically loaded with 25 g of Rb metal (Alfa Aesar, Ward Hill, MA) before the polarizing column is inserted into the system. The saturated gas mixture exits the helix and enters the vertical optical pumping tube, beginning its flow upwards against the laser beam. The polarization process starts at the bottom of the column with the mixture being illuminated with attenuated laser light, and progresses as the gas moves towards the more highly illuminated region of the cell. The top half of the column is for cooling the gas mixture, allowing rubidium condensation to occur while illuminated by the laser. For a better match of the laser beam shape this part has a conical shape, starting from the 4.0 cm diameter of the SEOP region and ending on top with a 7.5 cm window for the laser entrance. Cooling of the gas mixture is improved by implementing a 10 cm long water cooling jacket above the oven. Visual observations confirm that most of the Rb condenses on the walls at this spot. After the Rb vapor is extracted, the remaining gas mixture including the now hyperpolarized xenon exits the column through the top stopcock valve into the down-tube. The down-tube is a 1.2 meter long region which makes the transition from the uniform magnetic field of the polarizing column to the base of the polarizer where the freeze-out, with its high strength magnetic field, is located. We also use the down-tube to measure xenon polarization by implementing an NMR coil system around a short expanded 5 cm diameter region, as seen in Fig. 1.
B0 Field
The uniform magnetic field required for SEOP and for NMR signal measurements is generated by seven coils placed in a vertical tower configuration. Positions and number of windings of the coils was done by numerically optimizing the field on the central axis. The magnetic field was chosen just below the field for decoupling the spins in molecular spin-exchange. Coils have a diameter of 1.1 m and span a distance of 1.9 m from top to bottom. For the typical operating field of 28.8 G the corresponding 129Xe NMR frequency is 33.7 kHz. The current running through the coils connected in series generates ~6 G/A and is monitored across a shunt resistor on a 6.5 digit multimeter.
Gas Flow System
A schematic of the flow system is shown in Fig. 2. The flows are separately controlled for xenon, nitrogen and helium with mass flow controllers (MKS, Wilmington, MA). Maximum flow rate capabilities implemented in this prototype system are 150 standard cm3 per minute (sccm) for xenon, 500 sccm for nitrogen, and 5000 sccm for helium, and calibrated using a known measured volume. A NuPure 200 XL series purifier (NuPure Corp., Ottawa, ON) is used to trap the oxygen and moisture impurities of the input gases. Total pressure in the system is monitored and controlled using an MKS 640 series pressure controller, placed on the output gas panel before the final vacuum pump, and capable of controlling up to 1000 torr maximum pressure. The transition from the metal hoses of the flow panel to the glass of the polarizer is done with spherical ball connectors (Ace Glass, Vineland, NJ), hence the system is required to stay below or close to atmospheric pressure. A second pressure gauge is mounted on the input panel for calibration, vacuum, and input pressure readings. A four channel MKS 247D controller driven by a Keithley 213 Quad power supply (Keithley Corp., Cleveland, Ohio) controls the MFCs and the pressure controller. A LabView (NI, Austin, TX) program interfaces the electronics and records the gas flows, pressures, and temperatures.
Fig. 2.

Gas flow system schematic: 1-connection to calibration volume; 2-purifier; 3-purifier bypass loop; 4-pressure gauge; 5-secondary vacuum pump; 6-thermal cell filling port; 7-down-tube; 8-freeze-out; 9-pressure gauge; 10-ballast gas input; 11-exhaust port to main vacuum pump. A ⊗ refers to a valve, MFC to mass flow controller, and PC to pressure controller.
Laser and Optics
The novel design of the optical setup was essential to the successful demonstration of this large scale prototype polarizer. Achieving highest polarization of the gas combined with high flow requires the highest possible optical pumping power. The progress of diode laser technology offers an excellent source of high power light for Rb optical pumping applications. The laser diodes employed for this case were coupled to a transport optical fiber, therefore the optical setup must also include polarizing components. A polarizing optical setup widely used with fiber-coupled diode lasers is shown in Fig. 3a. A polarizing beam splitter cube linearly polarizes the laser light with minimum power loss. Subsequently, the linearly polarized beams transmitted and reflected from the cube are transformed into circularly polarized light of the same helicity using oppositely rotated quarter-wave plates. This setup comes with the inconvenience that the beam is separated into two components which need to be recombined. If the pumping cell is short, the use of a design as shown in Fig. 3a would bring no compromises other than small skew-angle effects [25]. However, meter-long pumping cells, such as ours, required development of a new optical setup in order to obtain a circular beam uniformly filling the column over its entire length. A solution was found. Starting with a half-circle shape of the fiber output, the optical arrangement recombines the two components into a full circle at the focusing point (Fig. 3b). A 7-to-1 fiber optic with a circular output configuration was fed by five lasers in order to approach the half-circle shape as shown in Fig. 4a. The output beam starts with a diameter less than 7.5 cm at the top of the column, and follows the conical shape arriving at a 4 cm waist throughout much of the straight tube. The optical arrangement and the beam shape at one meter away are shown in Fig. 4b. Laser power was provided by five Coherent FAP lasers at 795 nm (Coherent, Santa Clara, CA). Maximum power was obtained for 30 A in each laser, with 25 W per diode for 125 W total. Only ~90 W was measured at the entrance of the polarizing column due to losses in the optical components. The laser spectrum and Rb absorption are monitored continuously with an HR2000 spectrometer (Ocean Optics, Dunedin, FL). The spectrum peak has a full width at half-max (FWHM) under 2 nm. By small changes of the cooling water temperature and/or current we are able to shift the central wavelength to maximize absorbed light.
Fig. 3.

a) Schematic of the classical optical setup for circular polarizing laser light: a linear polarizing beam splitter cube followed by quarter wave plates on each component. b) Schematic of the UNH optical setup: starting with a half-circle fiber output, the transmitted and the reflected beams meet at the imaging point ”O” to create a final circular beam.
Fig. 4.
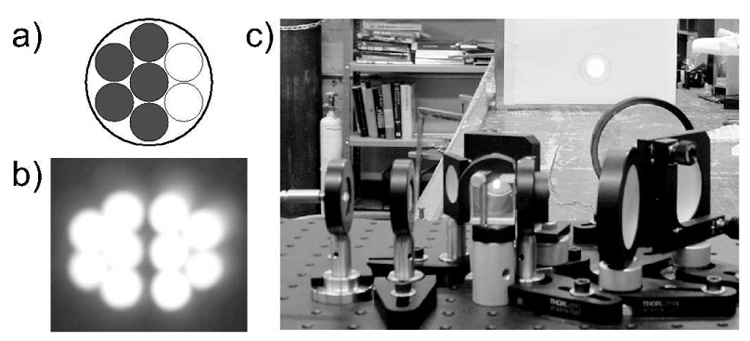
a) By using only five inputs of the seven available, the fiber output approaches the half-circle shape; b) High magnification projected image of the combined beams; c) Final optical setup and the output beam shape at one meter away: the beam fills the 4 cm diameter target.
Heating Oven
The heating system initially consisted of an heated air oven. This inefficient single-pass system exhausted considerable heat into the room. In addition, thermocouple measurements indicated large temperature gradients as high as 20°C for our 160°C nominal working temperature. To reduce heat dissipation, homogenize temperature, and to also allow local removal of heat from the region where most of the laser power is absorbed, we implemented a new oven to function with silicone oil as the thermal agent. This oven/bath is a Pyrex cylinder surrounding the lower half of the polarizer. The oil temperature is maintained constant by using a large volume Neslab EX-252HT heating bath recirculator. The temperature gradient is less than 5°C.
Xenon Accumulation System
The xenon freezing point of ~ 161°K is well above the ~ 77°K temperature of liquid nitrogen. With the system running below atmospheric pressure, the only gas trapped from the pumping mixture at liquid nitrogen temperature is the polarized xenon. The relaxation time of polarized xenon in the frozen state at 77°K is T1 ~2.5 hours [26]. This lifetime drops to minutes or seconds near the phase transition temperature, depending on the magnetic field [26]. The thick insulating layer of xenon built up on the walls of the freeze-out container results in temperature gradients between the glass surface and the inside frozen layers, which could cause losses in polarization. Of even greater importance, this thick layer can become thermally decoupled from the walls during thawing, experiencing additional time at and near the liquid phase transition temperature. The lesson is that polarization losses are most dependent on the time spent around the phase transition. To overcome the thick localized accumulations associated with the traditional coaxial condenser design (Fig. 5a), we developed a unique approach that offers a large contact surface and allows us to control the thickness of the xenon layer. By using a helical shape design, as shown in Fig. 5b, the cold surface available for xenon deposition is much larger, and, more importantly, can be controlled. The coil for the freeze-out is made from a 1.5 cm diameter tube wound on a 3 cm mandrel. The height of the coil is 15 cm and includes ~5 turns. The gas mixture is directed to flow downward through the turns of the helix where it comes in contact with cold surface just below the level of the liquid nitrogen. Raising the liquid nitrogen dewar during accumulation allows the frozen xenon to be deposited uniformly over the entire length of the helix (Fig. 5c), and sequesters the xenon already frozen well below this point. The ”U” shaped liquid nitrogen dewar offers a significant buffer quantity of liquid nitrogen and avoids pouring liquid nitrogen over the top of the freeze-out. The thin uniform layer of frozen polarized xenon thaws in seconds.
Fig. 5.

a) Classic cold-finger style freeze-out. Gas comes down through the middle tube and accumulates on the outside tube surface. b) Novel helix design freeze-out: gas comes down through the helix and exits upwards through the middle tube. c) Schematic of the freeze-out system: the xenon is accumulated uniformly inside the helix by raising the liquid nitrogen level in a controlled manner.
Polarization Measurement
Xenon polarization is measured using the standard NMR FID technique. A commercial Surrey Medical Imaging Systems MRI console is modified with a frequency mix-down stage for the transmit signal and a mix-up for the receive signal in order to function in the kHz frequency range. Separate drive and receive coils are used for a better match of their impedances with the electronics. Both coils have a cosine-theta winding configuration and are enclosed inside a cylindrical Faraday cage. Coils were tuned to the NMR resonant frequency of 33.7 kHz.
The down-tube (Fig. 1a) has an outside diameter of 5 cm in the region where gas NMR signal is measured. A glass cell with matching geometry was filled with water for the proton calibration signal. The ratio of the two NMR signals can be written as:
| (2) |
where S is the FID amplitude (or the integral of the FFT of the signal), N is the number of nuclei in the measured volume, β129 is the isotopic abundance of the 129Xe, α is the excitation flip angle, and γ is the nuclear gyromagnetic ratio. The last correction factor in Eq. 2 is to account for losses during the delay time before the start of acquisition, necessary because of coil coupling. It extrapolates the signal value back to time taq = 0 and it is significant because of different values between proton and xenon. For protons the polarization is given by the Boltzmann equilibrium of the spins inside the low magnetic field needed to observe a 33.7 kHz NMR frequency of 7.92 gauss (P = 2.6 × 10⁻⁹ at room temperature). To obtain a good SNR for the proton signal, long acquisition times are required (usually 1024 averages with 15 s repetition time between the shots). The number of xenon atoms was calculated based on the ideal gas law. Xenon files are acquired using 4 averages with 90° flip angle. The repetition time is chosen such that the gas inside the down-tube NMR region, depleted of its magnetization by the measurement, is completely replaced by polarized gas mixture (typically 20 s).
Transportation System
We developed two different systems for delivery of the hyperpolarized xenon for off-site MRI applications (from University of New Hampshire, Durham, NH to Brigham and Women’s Hospital, Boston, MA). A biological cryogenic dewar was initially used in combination with a permanent magnet box which provided a holding field of ~0.1 T. This setup is shown in Fig. 6a. Although proven successful, this method was abandoned once we demonstrated delivery in the gas phase with relatively the same efficiency. For the gas phase delivery a large solenoid coil with 40 cm diameter and 25 cm height enclosed in a steel box provided the holding magnetic field. The whole setup was finally secured inside of a large wheeled carrying case, as shown in Fig. 6b. To power the coil for short periods of time (10–20 min.) an internal rechargeable battery was implemented. When possible the power is supplied from the wall outlet or from the car battery without interruption. No coatings were applied to the one-liter delivery cell, however a thorough cleaning with Piranha solution (3:7 volumetric mixing ratio of H2O2 and H2SO4) was administered. The gas deliveries were performed consistently for several months to demonstrate the capability of the delivery method and for MRI experiments before moving the system to the scanner.
Fig. 6.
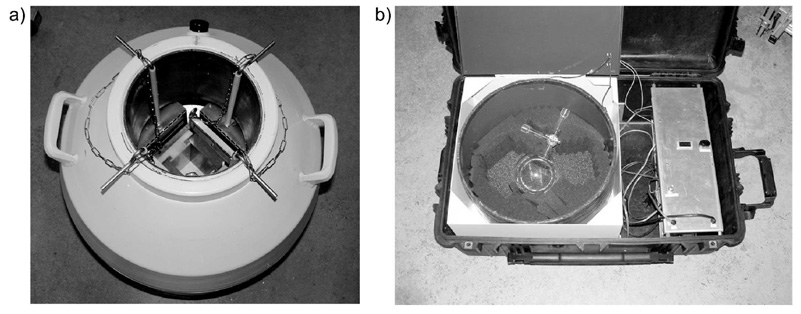
a) Frozen xenon delivery system: large cryo-biological storage system with a permanent magnet box to assure a 0.1 T holding field during delivery. b) Gas phase transport system: large case enclosing the solenoid coil with the delivery cell of one liter in the center. The coil can be powered from the wall, car (cigarette lighter socket), or by an internal rechargeable battery.
3 Results
The maximum 129Xe polarization achieved with our system was 64% for a xenon flow rate of 0.3 standard liters per hour (slh) or 5 sccm [27]. At higher flow rates, polarization remained remarkably high with output of 50% observed at 1.2 slh and 22% polarization at 6 slh. Xenon magnetization (flow×polarization) at this latter flow rate is one order of magnitude higher than any result reported previously in the literature. A polarization map at close to optimum running conditions is shown in Fig. 7.
Fig. 7.
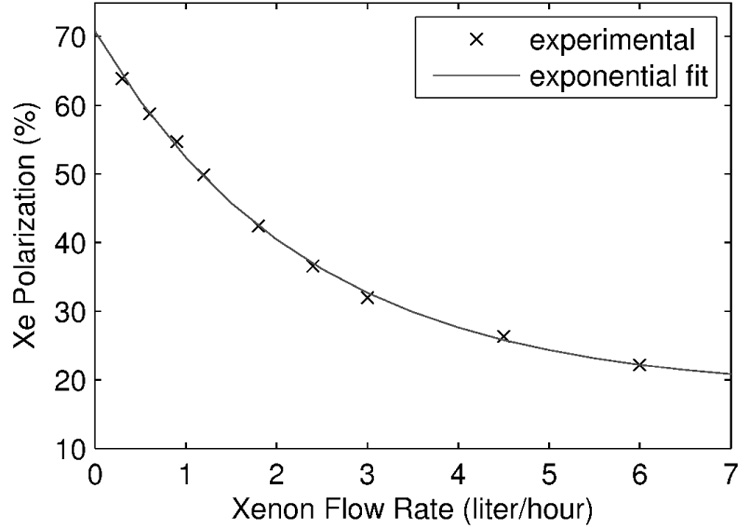
Largest 129Xe polarization numbers achieved during preliminary tests at optimum found operating parameters of 160°C temperature, 500 torr total pressure, 1350 sccm total flow, and ~125 torr nitrogen partial pressure. Polarization numbers are fitted with an empirical exponential curve.
Xenon Polarization
Studies of polarization dependence as a function of the operating parameters of the polarizer were performed in order to find the optimum running conditions and highest achievable polarization. We found the optimum temperature to be 160°C over a wide range of xenon flow rates. A partial pressure of at least 125 torr of nitrogen was required to saturate the xenon polarization. The xenon polarization process was observed to depend on the gas velocity as well. We used helium in order to control the flow velocity of the gas mixture and tested three different flow velocities of 0.7, 1.35, and 1.9 standard liter/minute (slm) at constant total pressure of 500 torr. The middle value of 1.35 slm gave the highest polarization map. Because different choices of buffer gas flow rates modify the time allowed for polarization transfer as well as the pressure-broadened absorption of laser light, these parameters should be not be considered universal to the process. They depend on the polarizing column geometry, laser characteristics, and the other parameters. A theoretical simulation was developed to assist in finding optimal conditions.
Freeze-Thaw Polarization Recovery
An important outcome of our experimental results was the full recovery of polarization after a freeze-thaw cycle using the helical shaped freeze-out and the adjustable liquid nitrogen level dewar. Previous studies had observed polarization losses of 20% to 60% for significant accumulations [28]. We measured 99.8%, 99.6%, 91.9%, and 88.5% polarization recovery for 10 minute accumulations at xenon flow rates of 10, 50, 75, and 100 sccm, respectively. The recovered polarization numbers were corrected for longitudinal relaxation during the time spent by xenon in the frozen state. Higher flow rates showed increasing losses of polarization, although still relatively small, caused by the higher amount of frozen xenon and, therefore, thicker layer deposited on the surface. This is the first observation of nearly lossless recovery of 0.5 liter and high (88.5%) recovery of one liter.
Gas Phase Relaxation Measurements
After the accumulation and separation of polarized xenon by freezing it, xenon was thawed back into the down-tube and its polarization as a function of time was measured. Relaxation times in the down-tube were measured using small flip angles of ~5° and taking multiple repetitive shots at intervals of 5 minutes. Relaxation times between 1.0 and 2.7 hours were determined. Other than a careful cleaning with Piranha solution, no special treatment was applied to the Pyrex glass surface. These observations of long lifetimes in the Pyrex down-tube led us to implement gas phase delivery technologies (discussed above).
Production Rates
For a continuous-flow polarizer which produces hyperpolarized xenon at a flow rate Φ with initial polarization P0, it can be shown that polarization of the frozen xenon at the end of accumulation process is equal to:
| (3) |
where T1 is the longitudinal relaxation time in frozen state and tacc is the accumulation time. If the output gas polarization can be estimated as a function of its flow rate, P0 = P0(Φ), then one can calculate the optimum xenon flow rate and the required time to be produced. We fitted the experimental data shown in Fig. 7 with an exponential function resulting in:
| (4) |
Figure 8 shows the xenon production map generated by implementing Eq. 4 into Eq. 3. The displayed polarization numbers do not include any losses due to the freeze-thaw cycle and they are characteristic for 2.5 h xenon relaxation time in frozen state. The map shows that our system can produce a half-liter of xenon with polarization ~50% or one liter of xenon with polarization ~44%.
Fig. 8.
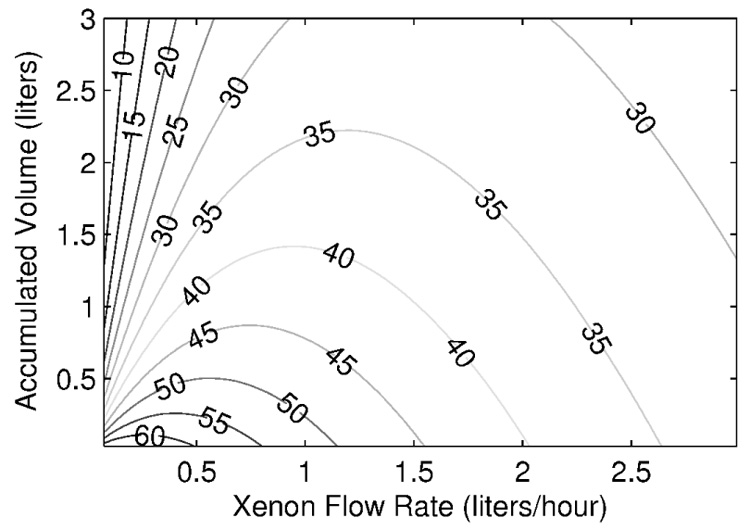
Polarized xenon production map considering a relaxation time in frozen state of 2.5 hours and no polarization loss during the freeze-thaw cycle. Numbers shown on the contour lines represent final polarization expressed in percent.
Polarizer relocation
After preliminary tests were finished the polarizer was successfully relocated to the Brigham and Women’s Hospital (Boston, MA) to be used for human lung MRI studies. We were able to fit the polarizer in a ~7 m2 closet adjacent to the 0.2 T MRI scanner. This increased the hyperpolarized xenon signal in the subsequent experiments because the delivery time from polarizer to the scanner decreased from 1.5 h to less than 5 minutes. Recently, delivered polarization numbers corresponding to different xenon flow rates were measured inside the MRI scanner. The signal calibration was done by comparing with xenon thermal polarization. The highest polarizations obtained at BWH were above the ones measured during our preliminary tests at UNH and reported in Fig. 7 by 12 to 21% (relative) at low through intermediate xenon flow rates. The polarizer presently produces 3–4 batches of xenon daily with 0.5–2.0 liters/batch for routine human lung imaging studies. Hyperpolarized xenon gas is separated in the freeze-out, thawed into Tedlar bags, and delivered to the experiment. The first reported human lung studies are currently in press [29]. The maintenance for the system is acceptably low, requiring column cleaning and refilling with fresh Rb approximatively once a year. Incidents that allowed air into the system did not always degrade performance.
Compact Prototype System
Xemed LLC (Durham, NH), a spin-off company of the University of New Hampshire, undertook the task of redesigning the large scale polarizing system into a compact system for widespread deployment to interested research groups, FDA approval, and eventually commercialization. Three major research projects were pursued, including development of a compact magnetic field tower and permanent magnet NMR system, externally-narrowed high power lasers, and high volume cryogenic accumulation. All the components of the polarizer fit inside of a structural rack of 64(w)x102(l)x203(h) cm3. User supplied components, such as buffer gases and liquid nitrogen tanks, are attached outside the rack. The gas panel is reduced in size by using a Swagelok Miniature Modular System. The polarizing magnetic field is provided by 16 small coils 30 cm in diameter arranged in a tower configuration. Mu-metal plates are placed at the top and the bottom of the tower to improve field uniformity. Also, low carbon steel side cage panels are used for the field flux return and magnetic isolation. The module containing the polarizing column (Fig. 9a,b) can be easily disconnected from the other sub-systems and moved into a 90° side tilted position for service (column replacement/cleaning). The hyperpolarized xenon travels to the freeze-out through the down-tube located inside regions of increasing field, and freezes in the 0.4 T field of a custom permanent magnet. The freeze-out system accommodates a higher capacity of accumulated xenon. The freezing and thawing processes are fully automated and computer controlled. The level of automation for the whole system is being refined to a higher level, where the user’s interaction with the system is reduced to a few commands. The polarizer can be monitored and diagnosed remotely. Laser power output is scaled-up and uses an externally-locked narrowed spectrum setup [30]. A complete safety review and failure analysis has been performed and is being continuously updated. The system is presently in commercial production (Fig. 9c). Its performance is specified at the same level as the UNH prototype polarizer.
Fig. 9.
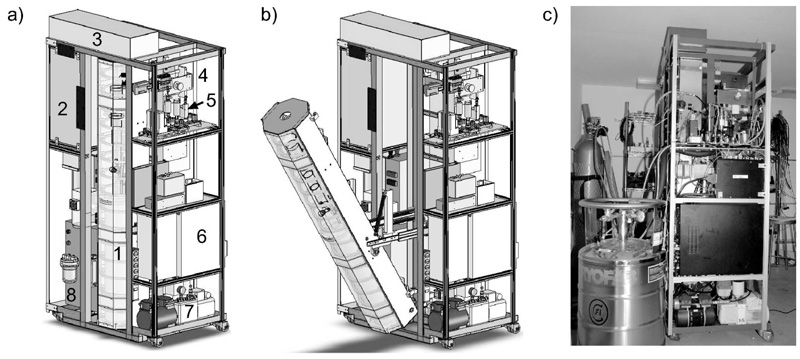
Prototype of compact xenon polarizer: a) CAD drawing of the system components. Labeled components are: 1-coil tower surrounding the oven and the column, 2-laser and optics box, 3-double mirror box for laser beam deviation into the polarizing column, 4-NMR permanent magnet setup, 5-gas flow panel, 6-dedicated controlling and monitoring computer, 7-vacuum pump, 8-laser chiller; b) same as previous, only that column is shown in servicing mode; c) real system presently under testing and refinement.
4 Discussion
We described a novel design for a xenon polarizer capable of producing large quantities of highly polarized 129Xe through Rb spin-exchange optical pumping. The advantage of working at low pressure results in a large spin-exchange rate between Rb and 129Xe allowing for rapid continuous flow of the gas mixture. The concept of three functional regions for the main cell: Rb vapor saturator, SEOP hot region, and Rb condensing region was implemented into a large scale polarizer. A novel design for the optics was developed for a better match to a long cylindrical cell. Xenon polarization dependence on different operating parameters were studied showing an optimum temperature of 160°C and a minimum of 125 torr nitrogen partial pressure required in the gas mix. Polarization output of 64% for 0.3 slh of xenon flow rate, 50% for 1.2 slh, and 22% for 6.0 slh were produced by our system. Higher polarization measurements, but within the error limits, were reported after the polarizer was successfully relocated to the MRI scanner at Brigham and Women’s Hospital. With a novel design of the freeze-out system, which assures the accumulation of frozen polarized xenon in a thin layer, we measured close to full recovery of liter quantities of polarized gas after thawing. Delivery systems for frozen and gaseous hyperpolarized xenon were demonstrated. Commercial availability of a compact version of this system was announced in 2007, and is currently in production at Xemed LLC.
Acknowledgements
The UNH/BWH collaboration acknowledge support from NIH under grants RR14297, R15HL67784, R01HL073632, EB002553, and from the University of New Hampshire. Xemed acknowledge support from NIH under grants RR20200, HL78295, and ES14005.
Footnotes
Publisher's Disclaimer: This is a PDF file of an unedited manuscript that has been accepted for publication. As a service to our customers we are providing this early version of the manuscript. The manuscript will undergo copyediting, typesetting, and review of the resulting proof before it is published in its final citable form. Please note that during the production process errors may be discovered which could affect the content, and all legal disclaimers that apply to the journal pertain.
Contributor Information
F. William Hersman, Department of Physics, University of New Hampshire and Xemed LLC, 131 Main Street, Nesmith Hall, Durham, NH 03824, Phone: 603-862-3512, Email: herman@unh.edu
Iulian C. Ruset, Xemed LLC and Department of Physics, University of New Hampshire, 16 Strafford Avenue, Durham, NH 03824, Phone: 603-868-1888 ext. 113, Email: icruset@unh.edu
Stephen Ketel, Department of Physics, University of New Hampshire, 131 Main Street, Nesmith Hall, Durham, NH 03824, Phone: 603-868-1888 ext. 107, Email: stephen.ketel@unh.edu
Iga Muradian, Department of Radiology, Brigham and Women's Hospital, 221 Longwood Avenue, Boston, MA 02115, Phone: 617-732-8698, Email: imuradian@gmail.com
Silviu D. Covrig, Department of Physics, University of New Hampshire, 131 Main Street, Nesmith Hall, Durham, NH 03824, Phone: 603-862-1691, Email: sdc@physics.unh.edu
Jan Distelbrink, Xemed LLC, 16 Strafford Avenue, Durham, NH 03824, Phone: 603-868-1888 ext. 105, Email: jand@physics.unh.edu
Walter Porter, Xemed LLC, 16 Strafford Avenue, Durham, NH 03824, Phone: 603-868-1888 ext. 103, Email: wporter@xemed.com
David Watt, Xemed LLC, 16 Strafford Avenue, Durham, NH 03824, Phone: 603-868-1888 ext. 108, Email: dwatt@xemed.com
Jeffrey Ketel, Xemed LLC, 16 Strafford Avenue, Durham, NH 03824, Phone: 603-868-1888 ext. 104, Email: jketel@physics.unh.edu
John Brackett, Xemed, LLC, 16 Strafford Avenue, Durham, NH 03824, Phone: 603-868-1888 ext. 129, Email: john.brackett@xemed.com
Aaron Hope, Xemed, LLC, 16 Strafford Avenue, Durham, NH 03824, Phone: 603-868-1888 ext. 128, Email: aaron.hope@xemed.com.
Samuel Patz, Department of Radiology, Brigham and Women's Hospital, 221 Longwood Avenue, Boston, MA 02115, Phone: 617-278-0610, Email: patz@bwh.harvard.edu
References
- 1.Bouchiat MR, Carver TR, Varnum CM. Phys. Rev. Lett. 1960;5:373–375. [Google Scholar]
- 2.Colegrove FD, Schearer LD, Walters GK. Phys. Rev. 1963;132:2561–2572. [Google Scholar]
- 3.Albert MS, Cates GD, Driehuys B, et al. Nature (London) 1994;370:199–201. doi: 10.1038/370199a0. [DOI] [PubMed] [Google Scholar]
- 4.Wagshul ME, Chupp TE. Phys. Rev. A. 1994;49:3854–3869. doi: 10.1103/physreva.49.3854. [DOI] [PubMed] [Google Scholar]
- 5.Eckert G, Heil W, Meyerhoff M, et al. Nucl. Instrum. Methods Phys. Res. A. 1992;320:53–65. [Google Scholar]
- 6.Rich DR, Gentile TR, Smith TB, et al. Appl. Phys. Lett. 2002;80:2210–2212. [Google Scholar]
- 7.Deninger A, Heil W, Wolf M, et al. Eur. Phys. J. D. 2006;38:439–443. [Google Scholar]
- 8.van Beek E, Schmiedeskamp J, Wild J, et al. Eur. Radiology. 2003;13:2583–2586. doi: 10.1007/s00330-003-2094-2. [DOI] [PubMed] [Google Scholar]
- 9.Gast KK, Eberle E, Schmiedeskamp J, Kauczor HU. Acad. Radiol. 2003;10:1119–1131. doi: 10.1016/s1076-6332(03)00335-0. [DOI] [PubMed] [Google Scholar]
- 10.Fischer MC, Kadlecek S, Yu J, et al. Acad. Radiol. 2005;12:1430–1439. doi: 10.1016/j.acra.2005.07.007. [DOI] [PubMed] [Google Scholar]
- 11.Conradi MS, Yablonskiy DA, Woods JC, et al. Acad. Radiol. 2005;12:1406–1413. doi: 10.1016/j.acra.2005.07.006. [DOI] [PMC free article] [PubMed] [Google Scholar]
- 12.Albert MS, Balamore D. Nucl. Instrum. Methods. Phys. Res. A. 1998;402:441–453. doi: 10.1016/s0168-9002(97)00888-7. [DOI] [PubMed] [Google Scholar]
- 13.Goto T, Suwa K, Uezono S, et al. Br. J. Anaesth. 1998;80:255–256. doi: 10.1093/bja/80.2.255. [DOI] [PubMed] [Google Scholar]
- 14.Raftery D, Long H, Meersmann T, et al. Phys. Rev. Lett. 1991;66:584–587. doi: 10.1103/PhysRevLett.66.584. [DOI] [PubMed] [Google Scholar]
- 15.Pietraiss T, Gaede HC. Adv. Mat. 1995;7:826–838. [Google Scholar]
- 16.Wagshul T, Buton ME, Haifang FL, et al. Magn. Reson. Med. 1996;36:183–191. doi: 10.1002/mrm.1910360203. [DOI] [PubMed] [Google Scholar]
- 17.Bifone A, Song YQ, Seydoux R, et al. Proc. Natl. Acad. Sci. 1996;93:12932–12936. doi: 10.1073/pnas.93.23.12932. [DOI] [PMC free article] [PubMed] [Google Scholar]
- 18.Butler JP, Mair RW, Hoffmann D, et al. J. Phys.: Condens. Matter. 2002;14:L297–L304. doi: 10.1088/0953-8984/14/13/103. [DOI] [PMC free article] [PubMed] [Google Scholar]
- 19.Ruppert K, Mata JF, Brookeman JR, et al. Magn. Reson. Med. 2004;51:676–687. doi: 10.1002/mrm.10736. [DOI] [PubMed] [Google Scholar]
- 20.Sanders RD, Ma D, Maze M. Br. Med. Bull. 2004;71:115–135. doi: 10.1093/bmb/ldh034. [DOI] [PubMed] [Google Scholar]
- 21.Happer W. Rev. Mod. Phys. 1972;44:169–250. [Google Scholar]
- 22.Walker TG, Happer W. Rev. Mod. Phys. 1997;69:629–642. [Google Scholar]
- 23.Romalis MV, Miron E, Cates GD. Phys. Rev. A. 1997;56:4569–4578. [Google Scholar]
- 24.Ruth U, Hof T, Schmidth J, et al. Appl. Phys. B. 1999;68:93–97. [Google Scholar]
- 25.Chann B, Babcock E, Anderson LW, Walker TG. Phys. Rev. A. 2002;66:033406:1–3. [Google Scholar]
- 26.Kuzma NN, Patton N, Raman K, Happer W. Phys. Rev. Lett. 2002;88:147602:1–4. [Google Scholar]
- 27.Ruset IC, Ketel S, Hersman FW. Phys. Rev. Lett. 2006;96:053002:1–4. doi: 10.1103/PhysRevLett.96.053002. [DOI] [PubMed] [Google Scholar]
- 28.Patton B, Kuzma NN, Happer W. Proc. of the 35th APS DAMOP. 2004 C4.011. [Google Scholar]
- 29.Muradian I, Butler J, Hrovat M, et al. Magn. Reson. Med. 2007 in press. [Google Scholar]
- 30.Zhu H, Ruset IC, Hersman FW. Opt. Lett. 2005;30:1342–1344. doi: 10.1364/ol.30.001342. [DOI] [PMC free article] [PubMed] [Google Scholar]


