

Abstract
The large size of the multinucleated muscle fibers of skeletal muscle makes their examination for structural and pathological defects a challenge. Sections and single fibers are accessible to antibodies and other markers but imaging of such samples does not provide a three-dimensional view of the muscle. Regrettably, bundles of fibers cannot be stained or imaged easily. Two-photon microscopy techniques overcome these obstacles. Second harmonic generation (SHG) by myosin filaments and two-photon excited fluorescence (2PEF) of mitochondrial and lysosomal components provide detailed structural information on unstained tissue. Furthermore, the infrared exciting light can penetrate several layers of muscle fibers and the minimal processing is particularly valuable for fragile biopsies. Here we demonstrate the usefulness of SHG, combined with 2PEF, to reveal enlarged lysosomes and accumulations of non-contractile material in muscles from the mouse model for the lysosomal storage disorder Pompe Disease (PD), and in biopsies from adult and infant PD patients. SHG and 2PEF also detect sarcomeric defects that may presage the loss of myofibrils in atrophying muscle and signify loss of elasticity. The combination of SHG and 2PEF should be useful in the analysis and diagnosis of a wide range of skeletal muscle pathologies.
Keywords: muscle, Pompe disease, autophagy, acid α-glucosidase, two-photon microscopy, second harmonic generation, two-photon excited fluorescence
Introduction
Muscle pathologies are traditionally investigated and diagnosed by light microscopy of frozen or embedded tissue sections, stained with histochemical markers or antibodies (Engel and Franzini-Armstrong, 2004). For high resolution, electron microscopy produces unparalleled detail quality (ibidem). However, these methods produce an image of a thin slice of tissue and the reconstruction of a three-dimensional view requires painstaking serial sectioning and/or good knowledge of stereometrics. Single whole muscle fibers, stained for immunofluorescence, can be scanned in the confocal microscope to provide a complete three-dimensional view of the individual fiber (Ralston and Ploug, 1996; Ploug et al., 1998). However, the context of the larger muscle organization is lost once the fibers are teased from one another. Furthermore, it is difficult to ensure that all fiber types and conditions are represented when the pathology affects some of them more than others. The ideal technique would allow high-resolution imaging of fiber bundles with minimal need for processing. Two-photon (2P) microscopy techniques such as SHG bring us close to this goal. SHG is a non-linear technique in which two photons recombine in a non-resonant process to produce one photon of half the energy when non-centro-symmetric molecular arrays are present (Campagnola and Loew, 2003). Collagen, in the basal lamina which surrounds muscle fibers, and myosin thick filaments, in the core of the fibers, are emitters of SHG (Both et al., 2004; Plotnikov et al., 2006a,b; Greenhalgh et al., 2007). The absence of energy absorption in this process permits deep penetration with minimal tissue damage and little signal loss (Mohler et al., 2003); relatively large bundles of unstained muscle fibers can be examined throughout. In addition, the intensity of the SHG signal is exquisitely sensitive to the orientation of the emitting molecules (Vanzi et al., 2006) and to the semicrystalline order of the myofibrils (Greenhalgh et al., 2007). Skeletal muscle is also rich in intrinsically fluorescent components (Zipfel et al., 2003; Rothstein et al., 2005) such as flavins (FMN and FAD) and NAD(P)H) in mitochondria as well as the intralysosomal pigment lipofuscin. Lipofuscin, an indigestible material which is formed by cross-linking of protein residues accumulates due to age and oxidative damage (Brunk and Terman, 2002; Hutter et al., 2007).
Proof-of-principle papers have given detailed information on intrinsically fluorescent and SHG-emitting molecules in various tissues and have shown that the two techniques can be usefully combined in vitro (Zoumi et al., 2002; Zipfel et al., 2003) and in vivo (Rothstein et al., 2006). SHG, alone or with 2PEF, has also been used to image collagen in the cornea (Yeh et al., 2002; Han et al., 2004), cartilage (Yeh et al., 2005), skin (Chen et al., 2006; Lin et al., 2006), and dentin (Elbaum et al., 2007), as well as in mouse tumors in vivo (Brown et al., 2003) and in a mouse model of osteogenesis imperfecta (Nadiarnykh et al., 2007). These studies have amply demonstrated that SHG should be useful to study conditions that affect connective tissue. Muscle applications, however, have lagged behind, perhaps because myosin is a weaker SHG emitter than collagen.
We are interested in Pompe Disease (PD), an inherited lysosomal storage disorder resulting from mutations in acid 〈-glucosidase (GAA; also called acid maltase) (Hirschhorn and Reuser, 2001; Futerman and van Meer, 2004). Although the defect is present in all tissues, the pathology is most detrimental to skeletal and cardiac muscle. The telltale sign of the disease is the accumulation of glycogen in enlarged lysosomes, but when we stained single muscle fibers of GAA KO mice, the mouse model of PD (Raben et al., 1998), we also noticed large inclusions of autophagic debris in every type II (fast-twitch) fiber (Fukuda et al., 2006). These inclusions interrupt the myofibrils and could interfere with muscle contraction (Drost et al., 2005). The autophagic component is also present in muscle fibers from Pompe patients (Engel, 1970; Raben et al., 2007). However, large variability between patients and between fibers within a single biopsy makes the quantitation of these areas difficult. In addition, the recent approval of enzyme replacement therapy for PD and the emergence of newborn screening programs call for tools allowing complete scanning of valuable biopsies and high sensitivity in the detection of muscle defects.
We now demonstrate that the combination of the 2P imaging techniques SHG, detected in the forward direction (transmitted), and excited fluorescence (2PEF), recorded in backscattered mode, detects the whole range of muscle defects in PD, some of which were previously inaccessible. An additional benefit of this approach is the considerable simplification of sample preparation.
Materials and Methods
Reagents
Mouse anti-cytochrome C and rat anti-Lamp1 were purchased from BD PharMingen (BD Biosciences); rabbit anti-LC3 and Hoechst 33342 (bis-benzimide) from Sigma (St Louis, MO).
Treatment of muscle samples
GAA KO mice, the mouse model of Pompe disease, were killed by CO2 inhalation according to NIH guidelines. Hindlimb muscles were fixed with 2% paraformaldehyde (Electron Microscopy Science, Hatfield, PA) in 0.1M phosphate buffer for 2 h, then cut longitudinally into bundles of fibers of 200-300 μm thickness. They were transferred to 12.5, then 25 and 50% glycerol in phosphate-buffered saline (PBS) and stored at -20° C or immediately mounted in a chamber made of two stacked 0.1 mm-thick spacers (Secure Seal Spacers, Electron Microscopy Sciences) attached to a glass slide. The chamber was filled with a drop of 50% glycerol and sealed with a no. 1 ½ glass coverslip. The same procedure was followed for the human muscle samples (Raben et al., 2007). Biopsies were fixed starting as soon as possible after collection, and transferred to PBS for rinsing and shipment. Aldehyde fixation, which is known to cause unspecific autofluorescence, does not mask the intrinsic fluorescence pattern of muscle fibers (Fig. 1).
Figure 1. Fixation of muscle preserves the intrinsic fluorescence pattern of mitochondria.
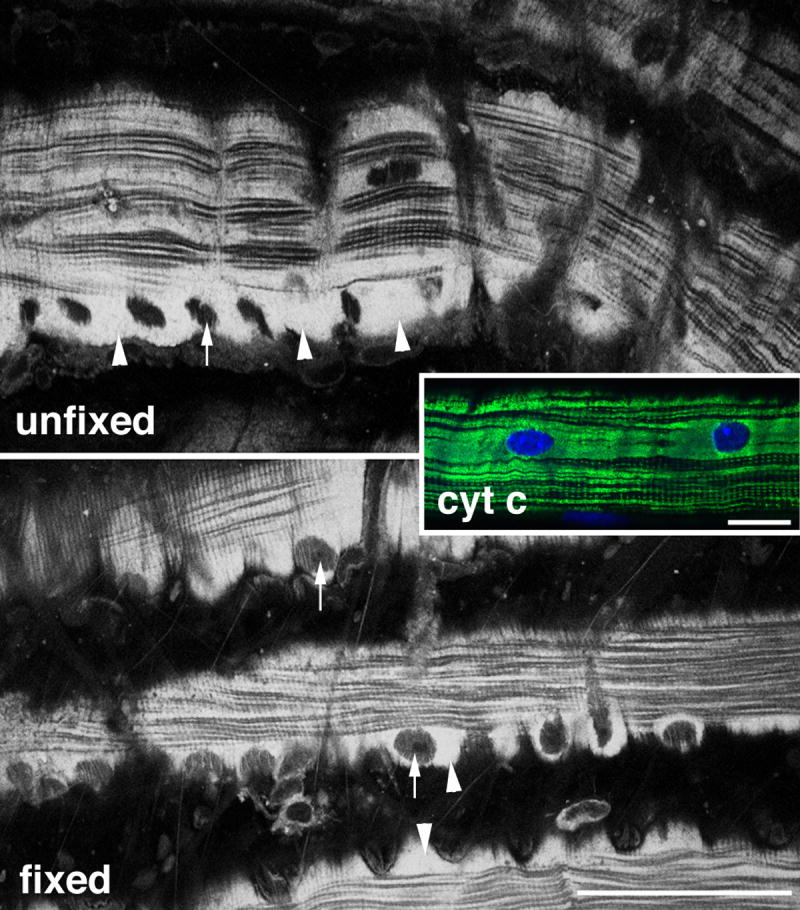
Intrinsic fluorescence from unfixed and from 4% paraformaldehyde-fixed mouse soleus muscle fibers was recorded in 1P confocal mode with stimulation at 405 nm and collection from 410 to 500 nm. Recording parameters were the same for the two images. The plane of focus is a few microns inside the fiber, emphasizing both longitudinal and transverse mitochondrial organization and showing the surface layer of mitochondria (arrowheads) in which nuclei form black holes (arrows). The inset shows mitochondria and nuclei in a single mouse soleus muscle fiber stained with anti-cytochrome c and with Hoechst 33342. Bars: 50 μm.
A control human muscle biopsy was the kind gift of Dr. Bente Stallknecht (Institute of Biomedical Sciences, The Panum Institute, University of Copenhagen, Denmark). All procedures followed the guidelines and rules of the respective countries and institutions where they took place.
Muscle fiber staining
Single fiber staining for immunofluorescence was done as described in Raben et al. (2007).
Light microsocpy
1PEF and immunofluorescence of muscle fibers were observed on a Leica SP5 confocal system (NIAMS) equipped with a 405nm 15 mW diode laser. Two Leica SP2 and the SP5 confocal systems, all based on inverted microscopes, were used for 2PEF and SHG imaging. In one system (NIDCR), the laser (a 5W Tsunami Ti:sapphire (Spectra-Physics, Mountain View, CA.) system with a Millenium Vs pump) was fiber-coupled to the scanhead. The SHG signal stimulated at 820 nm was collected in the forward direction with a transmitted light detector. The SHG signal was selected by an HQ410/20 filter for 2P microscopy (Chroma Technology Inc., Rockingham, VT.). Backscattered autofluorescence was recorded in one of the confocal PMTs. In the second SP2 (NIAID) and SP5 (NIAMS), the laser was a 3W Mai-Tai HP Ti:sapphire laser (Spectra-Physics). The SHG signal, collected in the forward direction by a transmitted light detector, was stimulated at 810 nm and selected by a 2-filter set containing an ET405/20 bandpass filter and an ET-680SP 2P8 short-pass filter (Chroma). Backscattered autofluorescence was collected in a non-descanned detector (RLD). In both cases we used a 63× NA 1.4 oil immersion objective and a high N.A. condenser cap (0.9 and 1.4NA) with oil. Direct comparison on one of the systems showed that the 2-filter set was significantly brighter than the high-Q filter. Image quality was improved by line averaging during recording and, occasionally, by image accumulation. Images were generally recorded in (512)2 and (1024) 2 formats and occasionally (2048) 2 for details of the sarcomeric organization. Regardless of the configuration, the results were qualitatively undistinguishable. Limited by the working distance of the objectives, we did not record images beyond 100 μm of depth. Confocal images were assembled into montages and linearly enhanced with Photoshop on a Macintosh G5 computer. Electron microscopy was carried out as described in Ploug et al. (1998) except that mouse muscles were fixed by immersion in 2% glutaraldehyde in cacodylate buffer. After osmication and dehydration tissue blocks were imbedded in epoxy resin, sectioned and observed in a Jeol 1200 equipped with an XR-100 CCD camera (Advanced Microscopy Techniques Corporation, Danvers, MA).
Results
SHG and 2PEF images of muscle fibers complement each other
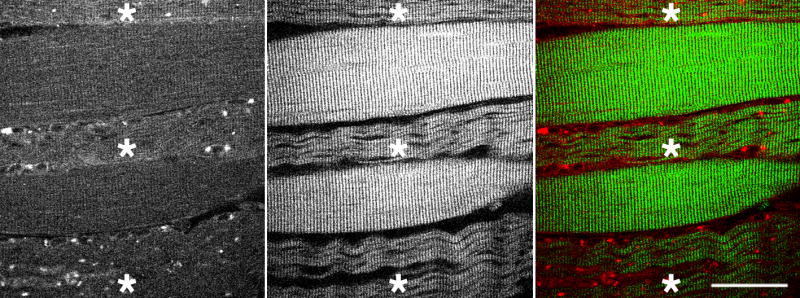
To establish that our experimental conditions allow the simultaneous recording of SHG and AF with complete separation of the signals, we focused on areas of muscle samples showing collagen fibers and blood vessels in addition to the muscle fibers. Fig. 2A shows images from a mouse gastrocnemius muscle. Collagen filaments (arrowheads; particularly in the inset area) are detected by SHG but not by 2PEF, whereas blood vessels (*) are detected by 2PEF but not by SHG. Myonuclei appear as elongated holes (arrows in Fig. 2A) in SHG; in 2PEF, nuclei often blend in the background but can be detected by the presence of brighter spots at the poles. The separation between neighboring fibers is always distinct in SHG but often blurred in 2PEF (see for example the area just above the insets). Inside the muscle fibers, both SHG and 2PEF show transverse stripes which alternate (Fig. 2B), as expected from the origin of the signals. SHG and 2PEF signals in our setup(s) are therefore distinct and complementary.
Figure 2. Complementarity of 2PEF and SHG imaging of gastrocnemius muscle from control mouse.


(A): 2PEF shows transverse and longitudinal stripes in the muscle fibers and highlights blood vessels (*); SHG shows striated pattern inside and collagen filaments outside the fibers (arrowheads). Myonuclei (arrows) appear as holes in SHG; they are not always noticeable in 2PEF. The insert shows an area closer to the connective tissue layer. Bar: 20 μm. (B): the top panel illustrates the alternating banding pattern of the SHG and 2PEF sources in an electron micrograph of mouse gastrocnemius muscle. Mitochondria (arrowheads), the main source of 2PEF, are in the I bands. Mitochondria also form longitudinal lines not shown here. Myosin filaments, the SHG source, are in the A bands. Bar: 500 nm. Middle panel: SHG and 2PEF images from mouse gastrocnemius muscle showing transverse striated pattern in both images and longitudinal lines in 2PEF. Bottom panel: histogram showing intensity of the signal as a function of location along the ROI1 lines (in μm), showing the alternance of SHG and 2PEF maxima. Scale in microns; ROI1 = 25 μm.
SHG and 2PEF show large non-contractile inclusions in muscles of GAA KO mice
We then examined fiber bundles from the gastrocnemius muscle of one year-old GAA KO mice. Compared to age-matched wild-type (WT), GAA KO muscles show striking differences (Fig. 3). In GAA KO muscles, SHG shows small holes (arrows), also visible as holes in 2PEF, as well as large holes (arrowheads) which contain fluorescent material, including bright particles. The shape and fluorescence of these particles identify them as the lysosomal pigment lipofuscin. The size and content of the large holes suggest that they represent the inclusions of autophagic debris previously noticed by EM and immunofluorescence (Fukuda et al., 2006), and that smaller holes represent nuclei and enlarged lysosomes. To verify this identification, we examined single mouse muscle fibers stained with markers for autophagosomes (anti-LC3), lysosomes (anti-Lamp1), and nuclei (Hoechst dye). We sequentially recorded immunofluorescence of the markers in 1P mode and SHG in 2P mode. As shown in Fig. 4, the identification was entirely confirmed.
Figure 3. SHG and 2PEF show profound defects in each fiber of GAA KO muscle.

2PEF (red in the bottom panel) and SHG images (green) were recorded from bundles of fibers from the gastrocnemius muscles of one year-old control (WT) and KO mice. In the KO, numerous autofluorescent particles are visible in areas that do not produce an SHG signal (arrowheads). These areas correspond to the regions of autophagic debris accumulation (Fukuda et al., 2006). There are also smaller holes (arrows) corresponding to the enlarged lysosomes characteristic of the GAA KO. Bar: 40 μm.
Figure 4. Holes in the SHG images of GAA KO mouse muscle fibers correspond to lysosomes, areas of autophagic accumulation, and nuclei.

Single muscle fibers were stained with markers for lysosomes (anti-Lamp1, Lp), autophagosomes (anti-LC3, LC), and nuclei (Hoechst dye, H). SHG and 1P immunofluorescence images were recorded consecutively. The large holes in the SHG images (asterisks) correspond to the autophagic areas; medium-sized holes to nuclei (arrow) and smaller holes (arrowheads) to lysosomes. Bar: 20 μm.
We next utilized SHG to analyze 6 Z-series of images that covered 59 fiber segments in the WT samples and 51 in the GAA KO. Large inclusions were present in 51/51 of the KO fibers and 0/59 of the WT fibers; small holes were present in 51/51 of the KO fibers and in 12/59 of the WT fibers. Upon closer examination, all the small holes in WT fibers corresponded to nuclei in optical sections through the surface of a fiber. In addition, GAA KO fibers appear consistently wavy compared to WT fibers, particularly in the SHG image. These results establish that the combination of SHG and 2PEF is extremely sensitive to the pathological changes in GAA KO muscles, which affect every fiber.
Heterogeneity of biopsies from patients with late-onset Pompe Disease
We next examined muscle biopsies from patients with the late onset form of PD which results from partial enzyme deficiency. Fig. 5 shows representative SHG and 2PEF-combined images. There is a large variability of fiber conditions both within biopsies and from patient to patient, with fibers ranging from normal to nearly completely destroyed. As the large inclusions appear to be a hallmark of the disease, we evaluated the incidence and extent of this damage. The bar graph in Fig. 5 shows the percent of fibers with large inclusions. The prevalence ranges from 8% (patient B, 36 fibers examined) to 72% (patient D, 58 fibers examined). As was the case with the mouse GAA KO samples, SHG images of PD fibers are often wavy but in human muscles, fibers with wavy myofibrils are found next to normal-looking fibers (Fig. 6, patient C). This feature is therefore unlikely to be due to gross damage to the muscle during collection or preparation. Instead, the wavy myofibrils may reflect loss of elasticity of individual damaged fibers (see discussion). In addition, SHG reveals that fibers that are not grossly abnormal show extensive areas of sarcomere irregularity (Fig. 7) which might be the presage of sarcomere proteolysis, eventually leading to the muscle atrophy observed in PD. No such irregularities were observed in a control human biopsy (data not shown).
Figure 5. SHG and 2PEF show profound defects in a subset of fibers from adult-onset PD patients.

2PEF (red) and SHG (green) images were obtained from muscle biopsies from four patients with different degrees of muscle damage. Each of the images shows a representative single section from a Z-series with at least one area similar to those observed in the mouse sample. The bar graph indicates the percent of fibers with these areas in each sample. The number of fibers sampled was 47 for patient A, 36 for B, 31 for C, and 59 for D. In each sample, practically normal-looking fibers are also found. Bar: 40 μm.
Figure 6. SHG emphasizes the wavy character of myofibrils in a subset of fibers (*) from adult-onset PD patients.
This image from patient D emphasizes the differences in damage between neighboring fibers; the wavy SHG pattern may indicate failure to contract. The gap between the fibers appears increased whereas 2PEF shows no such gap. Bar: 40 μm.
Figure 7. SHG shows irregularities in the sarcomeres of otherwise normal-looking fibers from patient D.
Arrowheads point to areas in which sarcomeres divide and give a weaker SHG signal. Bar: 10 μm.
Infant biopsies show non-contractile inclusions as well as disorganized sarcomeres
The most devastating form of PD results from complete or near-complete enzyme deficiency and affects infants. We have examined 7 infant biopsies: 4 collected following PD diagnosis during a newborn screening (from 2 weeks to 3 months of age), and 3 collected after 6 months of treatment with enzyme replacement therapy (ERT; from 7 to 9 months of age). In only one of these cases do we have biopsies before and after ERT. The biopsies from the younger infants have extensive connective tissue; the fibers are thin and floppy, and as a result, very few fibers are strong enough to be prepared for immunofluorescence (Raben et al., 2007). No such problem is encountered when preparing the samples for SHG and 2PEF. Fig. 8 shows combined SHG and 2PEF images. Each one represents a single section from a Z-series. Muscle samples from the younger infants (Fig. 8 A-C) show poor structure, areas practically without SHG signal, split fibers, and extensive non-contratile inclusions. 2PEF shows that some intrinsically fluorescent material is present. Very few bright fluorescent particles are detected, which is consistent with data on the relation between age and accumulation of lipofuscin. In addition, as shown in Fig. 9, the SHG image reveals local abnormalities in the organization of the sarcomeres. In the samples from older infants on ERT (Fig. 8 D-E), muscle fibers look better organized and the defects resemble those observed in the adult-onset PD biopsies. The frequency of these defects is variable; in one of the samples imaged, only one non-contractile inclusion, with lipofuscin accumulation, was detected in several Z-series totalling segments from 53 fibers. Because of the small number of biopsies seen so far, and of the even smaller number of infants for which both pre- and post-ERT biopsies are available, we cannot state whether ERT has been effective at slowing down or reversing the course of the muscle damage. We can state with confidence, however, that the combination of SHG and 2PEF provides extensive information on the different muscle defects in PD, and that sample processing is not an obstacle.
Figure 8. Non-contractile inclusions and other abnormalities revealed by SHG and 2PEF in infant biopsies.

Representative single optical sections from confocal Z-series showing 2PEF (red) and SHG (green). Biopsies from 0.5 month-old (A), 3 months-old (B) and 1.5 months-old (C) infants show extensive damage. In A, the separation between fibers is difficult to perceive; some areas appear to give no SHG (arrows); in B & C, the fibers show damage and fragmentation (arrowheads) with some accumulation of autofluorescent material, and occasional SHG-specific holes (arrows). Biopsies D and E are from 9 months-old and 7 months-old infants respectively after 6 months ERT. The fibers are thicker and hold together better but show damage similar to that seen in adults (arrowheads and asterisk). Bars: 50 μm (A, D) and 25 μm (B, C, E).
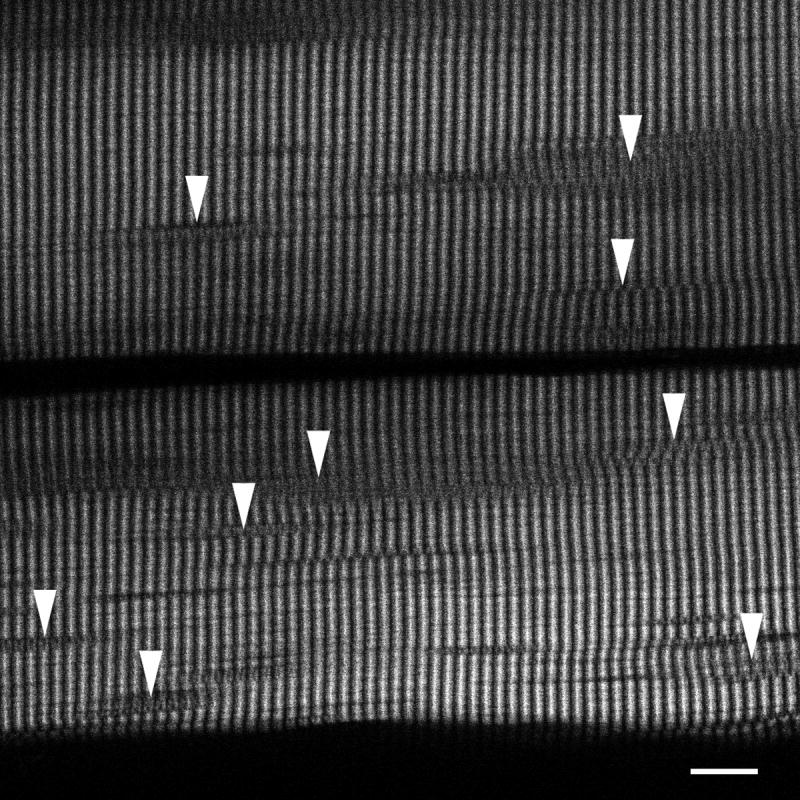
Figure 9. SHG shows evidence for local disorder in sarcomeric organization of infant muscles.

Single images from Z-series from 3 different infant biopsies (0.5 to 3 months-old) show variation in the intensity of the SHG signal (arrowheads), the length, and the shape of the sarcomeres. The 2PEF image does not show any remarkable features. Bar: 50 μm.
Discussion
The application of SHG to the analysis of pathological conditions in muscle has lagged behind compared to applications using the collagen signal. We find, however, that muscle SHG is relatively simple to record using turnkey confocal systems, and that it provides, especially in combination with 2PEF, detailed information on the type and extent of muscle fiber damage. Sample handling is minimal and easy and the ability to image muscle fibers in their original surroundings is a clear advantage. SHG and 2PEF can detect all the critical changes in Pompe muscle fibers of both patients and mouse model. Additionally, these methods allow the complete and unbiased scanning of samples, which may reveal previously unnoticed information. It would be extremely easy, for example, to overlook the infrequent autophagic areas in some infant muscle biopsies.
SHG and 2PEF images of unstained muscle are complementary and reinforce each other. 2PEF can provide specific information about mitochondria, redox state of the muscle, and lysosomal degradation products such as lipofuscin. 2PEF is also useful for revealing the outline of the muscle as in the fragile infant biopsies (Fig. 8). While examination of SHG alone might suggest a hole in the tissue at the periphery of the fiber, 2PEF shows continuity with the neighboring fibers. Both pattern and intensity of the SHG signal convey structural information not easily accessible by other techniques and suggest previously unnoticed defects in PD muscles. For example, SHG shows that the myosin filaments of some PD muscle fibers are wavy, in contrast to the normal-looking ones in the next fiber (Fig. 6). Since waviness is a known characteristic of muscle fibers that have lost the ability to contract elastically (Brown et al., 1984), these images suggest a failure to contract due to the buildup of non-contractile material and the atrophy of the fiber. 2PEF alone is relatively normal and would not reveal the damage. Work with single fibers might not reveal it either since an investigator may intentionally leave out wavy fibers, attributing this morphology to poor handling prior to fixation. SHG also shows that the stairlike transitions found in normal muscle (Both et al., 2004) are present at higher frequency in PD muscles and that there are areas of poor organization in otherwise normal-looking areas of adult human PD fibers (Fig. 6) in which 2PEF did not show any accumulation of autofluorescent material. Intensity of the SHG signal is related to the semi-crystalline order in muscle A-bands (Greenhalgh et al., 2007). The local loss of SHG signal in infant biopsies, therefore, could reflect loss of sarcomeric organization. The highly variable sarcomeric length in the SHG images of biopsies from young infants (Fig. 9) may be due to incomplete development as well as to the disease. The lack of biopsies from age- and origin-matched human infant controls makes it difficult at this point to evaluate the significance of these changes. It will be interesting to determine which of these defects are also present in other muscle pathologies.
SHG images show a better delineation of individual fibers than 2PEF. This is related more to cellular organization than to optics. Muscle fibers, especially type I, have layers of mitochondria next to the plasmalemma. The layers of two neighboring fibers are close enough to be unresolvable in diffraction-limited 2PEF. In contrast, the myofibrils from neighboring fibers are separated from each other by two such layers and are resolved in SHG.
The ease of sample preparation and the high information content of SHG and 2PEF combined should be useful in the observation and analysis of other muscle diseases, in particular those that involve displacement of organelles, such as the centronuclear myopathies (Pierson et al., 2005) or formation of inclusions such as the tubular aggregates found in some myopathies (Chevessier et al., 2005). The key to in vivo applications is the possibility to record the backscattered SHG signal from muscle (Rothstein et al., 2006). The signal is weak and a complicating factor is that it results in part from backscattered SHG and in part from the reflection of the forward signal (Légaré et al., 2007). SHG, however, is still in its infancy. Not so long ago, nuclear magnetic resonance was a useful technique to study protein samples in thin glass tubes. Who would have predicted, then, the current use of MRI on alert humans? Likewise, it is highly probable that technical advances will make SHG more readily accessible in the future.
Acknowledgments
We thank Dr. Bente Stallknecht (University of Copenhagen) for the generous gift of a control human biopsy. We are grateful to Charles Hemphill (Leica Microsystems) for help with initial SHG experiments, to Dr. J.H. Tao-Cheng (NINDS) for help with the electron microscopy, to Gary Melvin (NIAMS) for help with the filters, and to Drs. Sergey Plotnikov (NHLBI), Kristien Zaal (NIAMS), and Thorkil Ploug (Univ. Copenhagen, Denmark) for stimulating discussions. This work was supported by the Intramural Research Program of the National Institutes of Health.
Footnotes
Publisher's Disclaimer: This is a PDF file of an unedited manuscript that has been accepted for publication. As a service to our customers we are providing this early version of the manuscript. The manuscript will undergo copyediting, typesetting, and review of the resulting proof before it is published in its final citable form. Please note that during the production process errors may be discovered which could affect the content, and all legal disclaimers that apply to the journal pertain.
References
- Both M, Vogel M, Friedrich O, von Wegner F, Kunsting T, Fink RH, Uttenweiler D. Second harmonic imaging of intrinsic signals in muscle fibers in situ. J Biomed Opt. 2004;9(5):882–892. doi: 10.1117/1.1783354. [DOI] [PubMed] [Google Scholar]
- Brown E, McKee T, diTomaso E, Pluen A, Seed B, Boucher Y, Jain RK. Dynamic imaging of collagen and its modulation in tumors in vivo using second-harmonic generation. Nat Med. 2003;9(6):796–800. doi: 10.1038/nm879. [DOI] [PubMed] [Google Scholar]
- Brown LM, Gonzalez-Serratos H, Huxley AF. Structural studies of the waves in striated muscle fibres shortened passively below their slack length. J Muscle Res Cell Motil. 1984;5(3):273–292. doi: 10.1007/BF00713108. [DOI] [PubMed] [Google Scholar]
- Brunk UT, Terman A. Lipofuscin: mechanisms of age-related accumulation and influence on cell function. Free Radic Biol Med. 2002;33(5):611–619. doi: 10.1016/s0891-5849(02)00959-0. [DOI] [PubMed] [Google Scholar]
- Campagnola PJ, Loew LM. Second-harmonic imaging microscopy for visualizing biomolecular arrays in cells, tissues and organisms. Nat Biotechnol. 2003;21(11):1356–1360. doi: 10.1038/nbt894. [DOI] [PubMed] [Google Scholar]
- Chen J, Zhuo S, Luo T, Jiang X, Zhao J. Spectral characteristics of autofluorescence and second harmonic generation from ex vivo human skin induced by femtosecond laser and visible lasers. Scanning. 2006;28(6):319–326. doi: 10.1002/sca.4950280604. [DOI] [PubMed] [Google Scholar]
- Chevessier F, Bauche-Godard S, Leroy JP, Koenig J, Paturneau-Jouas M, Eymard B, Hantai D, Verdiere-Sahuque M. The origin of tubular aggregates in human myopathies. J Pathol. 2005;207(3):313–323. doi: 10.1002/path.1832. [DOI] [PubMed] [Google Scholar]
- Drost MR, Hesselink RP, Oomens CW, van der Vusse GJ. Effects of non-contractile inclusions on mechanical performance of skeletal muscle. J Biomech. 2005;38(5):1035–1043. doi: 10.1016/j.jbiomech.2004.05.040. [DOI] [PubMed] [Google Scholar]
- Elbaum R, Tal E, Perets AI, Oron D, Ziskind D, Silberberg Y, Wagner HD. Dentin micro-architecture using harmonic generation microscopy. J Dent. 2007;35(2):150–155. doi: 10.1016/j.jdent.2006.07.007. [DOI] [PubMed] [Google Scholar]
- Engel AG. Acid maltase deficiency in adults: studies in four cases of a syndrome which may mimic muscular dystrophy or other myopathies. Brain. 1970;93(3):599–616. doi: 10.1093/brain/93.3.599. [DOI] [PubMed] [Google Scholar]
- Engel AG, Franzini-Armstrong C, editors. Myology. New-York: McGraw-Hill; 2004. [Google Scholar]
- Fukuda T, Ewan L, Bauer M, Mattaliano RJ, Zaal K, Ralston E, Plotz PH, Raben N. Dysfunction of endocytic and autophagic pathways in a lysosomal storage disease. Ann Neurol. 2006;59(4):700–708. doi: 10.1002/ana.20807. [DOI] [PubMed] [Google Scholar]
- Futerman AH, van Meer G. The cell biology of lysosomal storage disorders. Nat Rev Mol Cell Biol. 2004;5(7):554–565. doi: 10.1038/nrm1423. [DOI] [PubMed] [Google Scholar]
- Greenhalgh C, Prent N, Green C, Cisek R, Major A, Stewart B, Barzda V. Influence of semicrystalline order on the second-harmonic generation efficiency in the anisotropic bands of myocytes. Appl Opt. 2007;46(10):1852–1859. doi: 10.1364/ao.46.001852. [DOI] [PubMed] [Google Scholar]
- Han M, Zickler L, Giese G, Walter M, Loesel FH, Bille JF. Second-harmonic imaging of cornea after intrastromal femtosecond laser ablation. J Biomed Opt. 2004;9(4):760–766. doi: 10.1117/1.1756919. [DOI] [PubMed] [Google Scholar]
- Hirschhorn R, Reuser A. In: Glycogen Storage Disease Type II: Acid alpha-Glucosidase (Acid Maltase) Deficiency. Scriver CR, Beaudet A, Sly WS, Valle D, editors. New-York: McGraw-Hill; 2001. pp. 3389–3420. [Google Scholar]
- Hutter E, Skovbro M, Lener B, Prats C, Rabol R, Dela F, Jansen-Durr P. Oxidative stress and mitochondrial impairment can be separated from lipofuscin accumulation in aged human skeletal muscle. Aging Cell. 2007;6(2):245–256. doi: 10.1111/j.1474-9726.2007.00282.x. [DOI] [PubMed] [Google Scholar]
- Légaré F, Pfeffer C, Olsen BR. The Role of Backscattering in SHG Tissue Imaging. Biophys J. 2007;93(4):1312–1320. doi: 10.1529/biophysj.106.100586. [DOI] [PMC free article] [PubMed] [Google Scholar]
- Lin MG, Yang TL, Chiang CT, Kao HC, Lee JN, Lo W, Jee SH, Chen YF, Dong CY, Lin SJ. Evaluation of dermal thermal damage by multiphoton autofluorescence and second-harmonic-generation microscopy. J Biomed Opt. 2006;11(6):064006. doi: 10.1117/1.2405347. [DOI] [PubMed] [Google Scholar]
- Mohler W, Millard AC, Campagnola PJ. Second harmonic generation imaging of endogenous structural proteins. Methods. 2003;29(1):97–109. doi: 10.1016/s1046-2023(02)00292-x. [DOI] [PubMed] [Google Scholar]
- Nadiarnykh O, Plotnikov S, Mohler WA, Kalajzic I, Redford-Badwal D, Campagnola PJ. Second harmonic generation imaging microscopy studies of osteogenesis imperfecta. J Biomed Opt. 2007;12(5):051805. doi: 10.1117/1.2799538. [DOI] [PubMed] [Google Scholar]
- Pierson CR, Tomczak K, Agrawal P, Moghadaszadeh B, Beggs AH. X-linked myotubular and centronuclear myopathies. J Neuropathol Exp Neurol. 2005;64(7):555–564. doi: 10.1097/01.jnen.0000171653.17213.2e. [DOI] [PubMed] [Google Scholar]
- Plotnikov S, Juneja V, Isaacson AB, Mohler WA, Campagnola PJ. Optical clearing for improved contrast in second harmonic generation imaging of skeletal muscle. Biophys J. 2006a;90(1):328–339. doi: 10.1529/biophysj.105.066944. [DOI] [PMC free article] [PubMed] [Google Scholar]
- Plotnikov SV, Millard AC, Campagnola PJ, Mohler WA. Characterization of the myosin-based source for second-harmonic generation from muscle sarcomeres. Biophys J. 2006b;90(2):693–703. doi: 10.1529/biophysj.105.071555. [DOI] [PMC free article] [PubMed] [Google Scholar]
- Ploug T, van Deurs B, Ai H, Cushman SW, Ralston E. Analysis of GLUT4 distribution in whole skeletal muscle fibers: identification of distinct storage compartments that are recruited by insulin and muscle contractions. J Cell Biol. 1998;142:1429–1446. doi: 10.1083/jcb.142.6.1429. [DOI] [PMC free article] [PubMed] [Google Scholar]
- Raben N, Nagaraju K, Lee E, Kessler P, Byrne B, Lee L, LaMarca M, King C, Ward J, Sauer B, Plotz P. Targeted disruption of the acid alpha-glucosidase gene in mice causes an illness with critical features of both infantile and adult human glycogen storage disease type II. J Biol Chem. 1998;273(30):19086–19092. doi: 10.1074/jbc.273.30.19086. [DOI] [PubMed] [Google Scholar]
- Raben N, Takikita S, Pittis MG, Bembi B, Marie SK, Roberts A, Page L, Kishnani PS, Schoser BG, Chien YH, Ralston E, Nagaraju K, Plotz PH. Deconstructing Pompe disease by analyzing single muscle fibers: to see a world in a grain of sand. Autophagy. 2007;3(6):546–552. doi: 10.4161/auto.4591. [DOI] [PubMed] [Google Scholar]
- Ralston E, Ploug T. Pre-embedding staining of single muscle fibers for light and electron microscopy studies of subcellular organization. Scanning Microsc Suppl. 1996;10:249–259. discussion 259-260. [PubMed] [Google Scholar]
- Rothstein EC, Carroll S, Combs CA, Jobsis PD, Balaban RS. Skeletal muscle NAD(P)H two-photon fluorescence microscopy in vivo: topology and optical inner filters. Biophys J. 2005;88(3):2165–2176. doi: 10.1529/biophysj.104.053165. [DOI] [PMC free article] [PubMed] [Google Scholar]
- Rothstein EC, Nauman M, Chesnick S, Balaban RS. Multi-photon excitation microscopy in intact animals. J Microsc. 2006;222(Pt 1):58–64. doi: 10.1111/j.1365-2818.2006.01570.x. [DOI] [PMC free article] [PubMed] [Google Scholar]
- Vanzi F, Capitanio M, Sacconi L, Stringari C, Cicchi R, Canepari M, Maffei M, Piroddi N, Poggesi C, Nucciotti V, Linari M, Piazzesi G, Tesi C, Antolini R, Lombardi V, Bottinelli R, Pavone FS. New techniques in linear and non-linear laser optics in muscle research. J Muscle Res Cell Motil. 2006;27(57):469–479. doi: 10.1007/s10974-006-9084-3. [DOI] [PubMed] [Google Scholar]
- Yeh AT, Nassif N, Zoumi A, Tromberg BJ. Selective corneal imaging using combined second-harmonic generation and two-photon excited fluorescence. Opt Lett. 2002;27(23):2082–2084. doi: 10.1364/ol.27.002082. [DOI] [PubMed] [Google Scholar]
- Yeh AT, Hammer-Wilson MJ, Van Sickle DC, Benton HP, Zoumi A, Tromberg BJ, Peavy GM. Nonlinear optical microscopy of articular cartilage. Osteoarthritis Cartilage. 2005;13(4):345–352. doi: 10.1016/j.joca.2004.12.007. [DOI] [PubMed] [Google Scholar]
- Zipfel WR, Williams RM, Christie R, Nikitin AY, Hyman BT, Webb WW. Live tissue intrinsic emission microscopy using multiphoton-excited native fluorescence and second harmonic generation. Proc Natl Acad Sci U S A. 2003;100(12):7075–7080. doi: 10.1073/pnas.0832308100. [DOI] [PMC free article] [PubMed] [Google Scholar]
- Zoumi A, Yeh A, Tromberg BJ. Imaging cells and extracellular matrix in vivo by using second-harmonic generation and two-photon excited fluorescence. Proc Natl Acad Sci U S A. 2002;99(17):11014–11019. doi: 10.1073/pnas.172368799. [DOI] [PMC free article] [PubMed] [Google Scholar]