

Abstract
The timing and propensity for migration between fresh- and seawater is a key theme in the diversity of life histories within the salmonid fishes. Across salmonid species, life-history strategies range from wholly freshwater-resident populations, to migratory and nonmigratory variation within populations, to populations and species that are primarily migratory. Despite the central theme of migration to the evolution of these fishes, the genetic architecture of migration-related processes is poorly understood. Using a genetic cross of clonal lines derived from migratory and nonmigratory life-history types of Onchorhynchus mykiss (steelhead and rainbow trout, respectively), we have dissected the genetic architecture of the complex physiological and morphological transformation that occurs immediately prior to seaward migration (termed smoltification). Quantitative trait loci (QTL) analyses were used to identify the number, effects, and genomic location of loci associated with smoltification-related traits, including growth and condition factor, body coloration, morphology, and osmoregulatory enzymes during the smoltification period. Genetic analyses revealed numerous QTL, but one locus in particular is associated with multiple traits in single and joint analyses. Dissecting the genetic architecture of this highly complex trait has profound implications for understanding the genetic and evolutionary basis of life-history diversity within and among migratory fishes.
MIGRATION is a pervasive theme in the diversification and evolution of animals. Migration has been described as a “syndrome” or a complex suite of integrated physiological, morphological, and behavioral traits that together with environment promotes the drive to move over long distances (Dingle 2006). Across all animal taxa, proximate mechanisms or features such as energetic and morphological changes are intricately tied to the ultimate decision to migrate (Dingle 2006). The genetic architecture of migration and the evolutionary forces that have shaped polyphenism in migration and residency have not been elucidated for any species. In this study, we describe the genetic architecture of proximate physiological and morphological traits associated with migration vs. residency in Oncorhynchus mykiss, a species that consists of both migratory (steelhead trout) and nonmigratory (rainbow trout) life-history types.
Migratory or anadromous salmonids rear in freshwater, migrate to the ocean as juveniles, and return to freshwater to spawn (Groot and Margolis 1991). Prior to seaward migration, juvenile salmonids transform from dark-colored parr, adapted to life in a freshwater stream environment, to silvery smolts, physiologically and morphologically adapted to life in the ocean (Hoar 1976). This physiological transformation, called smoltification, is regulated by environmental cues and complex physiological processes and ultimately culminates in downstream migration (Folmar and Dickhoff 1980; Hoar 1988). Smoltification is generally characterized by an increase in lipid metabolism and protein synthesis, increased growth in length relative to weight, and increased hypo-osmoregulatory ability relative to premigratory and nonmigratory individuals (Folmar and Dickhoff 1980; Hoar 1988; Dickhoff et al. 1997). These processes are modulated by numerous, integrated endocrine changes involving at least three different hormone axes, including the growth hormone, thyroid hormone, and corticosteroid hormone axes (Folmar and Dickhoff 1980; Hoar 1988; Dickhoff et al. 1997). Increased protein synthesis is associated with the deposition of the metabolic by-products guanine and hypoxanthine in the skin and scales of smolts, giving smolts a silvery appearance (Folmar and Dickhoff 1980; Hoar 1988). An increase in growth rate in length relative to weight has profound influences on the body morphology of smolts (Beeman et al. 1994, 1995; Gorbman et al. 1982), rendering the fish more streamlined for a migratory life history. An increase in hypo-osmoregulatory ability is most notably associated with biochemical and morphological changes in the gill and intestines, leading to an increased expression of Na+-K+ ATPase during the transformation (Folmar and Dickhoff 1980; Hoar 1988).
These rapid growth, metabolic, morphological, and behavioral changes in smolts do not occur at the same magnitude in nonmigrant fish. The decision to undergo smoltification and migrate is tightly associated with growth trajectories. Physiological thresholds of body size and growth are often discussed as a mechanism promoting divergence in alternative migratory and nonmigratory life-history trajectories (Thorpe 1994; Dickhoff et al. 1997; Thorpe and Metcalfe 1998; Thorpe et al. 1998). In freshwater, sexual maturation precludes seaward migration (Foote et al. 1994; Thorpe 1994; Thorpe and Metcalfe 1998). Thorpe and others (Thorpe 1994; Thorpe and Metcalfe 1998; Thorpe et al. 1998) have hypothesized that smoltification is a developmental decision made in individuals that have failed to sexually mature in freshwater. Indeed, a negative genetic correlation or genetic trade-off between sexual maturation and smoltification has been observed (Thrower et al. 2004). Although the physiology and the endocrinology of smoltification have been well studied, the ultimate genetic and molecular regulatory mechanisms responsible for alternative migratory and resident life-history types and the genetic trade-offs between these divergent life-history “decisions” are poorly understood. In this study, we test the hypothesis that these multiple physiological and morphological changes associated with smoltification are triggered by one or few major genome regions or that one or few major gene regions work to integrate the complex physiological and morphological changes occurring during smoltification.
The origin of anadromy in salmonid fishes has long been debated (McDowall 1997). Some suggest that anadromy is a derived character arising from wholly freshwater ancestors (Hoar 1976; Stearley 1992). The basis for this theory was originally predicated upon the broad freshwater distribution of salmonid species, parallels among species in the physiological basis of seawater adaptation, and the fact that all species spawn and spend at least part of their life cycle in freshwater (Tchenavin 1939; Quinn and Myers 2004). Phylogenetic relationships among salmonid species constructed from morphological data are in agreement with the “degree” of anadromy. Historically, the mapping of migratory life-history type upon a coarse, morphology-derived phylogenetic tree of salmonids showed a gradation in anadromy—from optionally anadromous (species consisting of either freshwater or anadromous forms) to the most derived obligately anadromous (species consisting exclusively of anadromous forms) (Hoar 1976; Oakley and Phillips 1999). However, more recent molecular Salmonidae and Salmonine phylogenies suggest multiple origins of anadromy when mapped to these trees (Stearley 1992; Stearley and Smith 1993; Oakley and Phillips 1999). On a finer level, observations within species suggest plasticity in the trait and multiple parallel accounts of both the gain and the loss of anadromy in both natural and introduced populations (Quinn et al. 2000, 2001; Unwin et al. 2000; Pascual et al. 2001; Stockwell et al. 2003; Riva-Rossi et al. 2007). While many of the above studies support the theory that timing of and propensity for anadromy is a derived character, having evolved from a freshwater ancestor, alternative views suggest that anadromy is ancestral and that extant salmonids evolved from a marine ancestor (McDowall 1997).
The inheritance of nonmigratory and migratory life-history types and associated traits has been examined in several salmonid species (Refstie et al. 1977; Clarke et al. 1992, 1994; Foote et al. 1992; Johnsson et al. 1994; Thrower et al. 2004; Duston et al. 2005). Although plasticity exists within and across populations (Quinn and Myers 2004; McPhee et al. 2007), inheritance studies suggest that both timing of and propensity for smoltification are also under genetic control. In crosses between life-history variants of Chinook salmon that differ in smoltification timing, Clarke et al. (1994) found that early smolting (smolting during the first year of life, also called “ocean type”) was dominant and apparently controlled by few genetic loci; the authors used body morphology and coloration to discriminate between dark, stream-dwelling individuals and silvery, premigratory smolts to determine if Chinook salmon in their study were smolting in their first or second year of life. In species for which both freshwater resident and migratory forms exist, studies evaluating smoltification in intercrosses between resident and anadromous forms indicate that there is also a genetic basis for the propensity to undergo smoltification (Foote et al. 1992; Johnsson et al. 1994). In these studies, hybrid progeny were made from crosses between anadromous sockeye salmon and freshwater resident kokanee (O. nerka) (Foote et al. 1992) and between anadromous steelhead and freshwater resident rainbow trout (O. mykiss) (Johnsson et al. 1994); in both studies, hybrids were intermediate between freshwater and migratory forms in their ability to hypo-osmoregulate in seawater, suggesting that propensity for smoltification is under additive rather than dominant genetic control in these species.
To dissect the genetic basis of alternative migratory and nonmigratory life-history types, we have conducted a comprehensive quantitative trait loci (QTL) analysis of smoltification-related traits in O. mykiss (rainbow and steelhead trout). We evaluate the joint segregation of molecular markers, ordered in the genome, with the segregation of quantitative or polygenic traits associated with smoltification in a cross between nonmigratory rainbow trout and migratory steelhead trout lines. We test the hypotheses that multiple traits are controlled by a few loci of large effect and that multiple, correlated traits of smoltification colocalize to the same regions in the genome.
MATERIALS AND METHODS
Genetic crosses:
Genetic analyses of smoltification-related characters were conducted in doubled-haploid progeny produced from a cross between the Oregon State University (OSU) rainbow trout and Clearwater (CW) steelhead trout clonal lines; clonal line origin and production is described elsewhere (Nichols et al. 2007). Briefly, eggs from one OSU female were fertilized with sperm from one CW male to produce a family of F1 progeny. Sperm from the resulting F1 male hybrid clones was used to produce doubled haploid progeny by androgenesis, as described by Young et al. (1998). Doubled haploids were produced in October and reared for ∼3 years at the Washington State University research hatchery. Embryos were maintained in recirculating stack egg incubators at a constant 11° until swim-up (complete yolk absorption). At swim-up, fish were transferred to 5-gallon tanks maintained in a recirculating system at similar densities. At 6 months of age, all fish were transferred to a single 200-gallon tank and were fed by automatic feeder, which was replenished once daily. Temperatures in the recirculating systems ranged from 11° to 18° throughout this study.
Genotyping:
Genotypes of doubled-haploid progeny were assessed at multiple loci, using amplified fragment length polymorphic (AFLP), microsatellite, and known gene markers. Dominant AFLP markers are unambiguous in the doubled-haploid progeny, as all individuals are homozygous. Methods for AFLP genotyping are described elsewhere (Nichols et al. 2007). Seventeen AFLP primer sets were used with EcoRI- and MseI-digested genomic DNA. AFLP markers are named according to EcoRI + 3 selective bases, MseI + 3 selective bases, and either an arbitrary number or base pair size of fragment, in that order. Microsatellite markers were chosen on the basis of known placement on existing rainbow trout maps (Sakamoto et al. 2000; Nichols et al. 2003; Danzmann et al. 2005; Guyomard et al. 2006). At least one microsatellite locus per chromosome was chosen to enable the identification of syntenic linkage groups among salmonid linkage maps. Potential candidate genes were chosen on the basis of their putative involvement in the smoltification process, as part of a parallel study aimed to map genes whose products play a role in the endocrine, osmoregulatory, and other physiological changes that occur during smoltification. Primer sets for microsatellite and known genes are provided in supplemental Table S1.
Phenotyping:
Because smoltification is a temporal process, we chose to sample phenotypes over a time course from February through June 2003 over which the physiological transformation or smoltification was anticipated to occur. In 2003, fish were age 1+, and all fish were sampled again in March 2004 at age 2+ to determine if fish that had not gone through smoltification at 1+ were doing so at age 2+. Since repeated samples or data were taken from the same individuals, fish were sampled nonlethally and with limited invasiveness to minimize handling stress effects. Data on phenotypes were collected February 24, March 17, April 7, April 21, May 5, May 18, and June 9, 2003. At sampling, fish were anesthetized with clove oil and phenotypic data were then collected. Phenotypes collected over this time course included body morphology and skin reflectance from digital photographs, body size (length and weight), gill sodium-potassium ATPase (Na+/K+ ATPase), body condition factor, and instantaneous growth rate in length and weight.
Body morphology:
The change in body morphology from a more deep-bodied, stream-dwelling fish to a more fusiform shape has been well documented in smolting salmonids (Gorbman et al. 1982; Beeman et al. 1994, 1995). We used morphometric shape analysis to quantify variability in body shape among phenotypically divergent doubled-haploid progeny. From digital photographs, 13 landmarks along the left lateral side of the fish were digitized for each time point (Figure 1). Two-dimensional coordinates for landmarks were obtained by digitizing each point using the software tpsDig2 (Rohlf 2005a).
Figure 1.—

Digitized landmarks for morphology and area measured for skin reflectance. Skin reflectance was made in the shaded area below the dorsal fin and was quantified as average pixel intensity.
Skin reflectance:
As smolting salmonids are readied for out-migration and adaptation to life in the sea, the metabolic by-products guanine and hypoxanthine are deposited in the skin and scales of smolts, rendering the fish silver in color and highly reflective (Folmar and Dickhoff 1980; Hoar 1988). The concentration of skin guanine has been shown to be highly correlated with color or the reflectance from the skin (Haner et al. 1995). Subjective, qualitative assessments of body silvering have long been used to identify smolts, but more recently, noninvasive measures of skin color or reflectance have been developed to objectively quantify body silver color or reflectance (Duston 1995; Ando et al. 2005). In this study, skin reflectance was quantified by calculating the average pixel intensity within an area directly above the lateral line and below the dorsal fin (Figure 1). To do this, digital photographs were taken in an enclosed box with constant, bright, diffuse light provided by four full-spectrum bulbs. Fish were placed in a shallow, V-shaped aquarium that was affixed with black and white calibration tabs. Digital photographs were taken in this controlled-light environment, using manual camera settings with constant exposure settings for all photos. SigmaScanPro (SysStat Software) software was used to acquire average pixel intensity from this area. Briefly, intensity was calibrated for each image, choosing a two-point calibration: one calibration point on the black tab (scaled at 0) and one calibration point on the white tab (scaled at 100). Using the trace tool, the area mentioned above was defined and calibrated average pixel intensity measured (on a scale from 0 to 100).
Gill Na+/K+ ATPase:
During smoltification, salmonids experience a spike in gill Na+/K+ ATPase, enabling hypo-osmoregulation in seawater (Folmar and Dickhoff 1980; Hoar 1988; McCormick and Bradshaw 2006). At sampling, three to four gill filaments were clipped from each fish nonlethally, placed in 100 μl SEI buffer (150 mm sucrose, 10 mm EDTA, 50 mm imidazole, pH 7.3) at 4°, and then frozen within 4 hr at −80° for storage. Na+/K+ ATPase was quantified in these samples according to McCormick (1993).
Body condition factor:
Condition factor commonly decreases in smolting salmonids relative to nonsmolts (Folmar and Dickhoff 1980; Hoar 1988). Condition factor was quantified using weight (W in grams) and standard length (L in millimeters) with the formula (W/L3 × 100,000).
Growth rates:
Growth rates were calculated from both weights and standard lengths for spring interval from February to June 2003. Relative to nonsmolts, smolts experience a greater increase in growth in length during the spring of smolting (Folmar and Dickhoff 1980; Hoar 1988; Dickhoff et al. 1997). Instantaneous growth rates were calculated using [ln(L2) − ln(L1)]/[t2 − t1] × 100, where L1 and L2 are standard lengths or weights at times 1 and 2 (t1 and t2 in days).
Binary smolt phenotype:
From each sampling point, in addition to the above quantitative data, individuals were scored as smolts (1) or nonsmolts (0) for QTL analyses. The binary smolt phenotype was assigned on the basis of the digital photographs taken for reflectance and morphology. Individuals were categorized as smolts if they were streamlined, reflective, silvery individuals characteristic of this life-history type. Individuals with distinctive parr marks along the lateral line through the duration of the study are typical of stream-dwelling parr and were categorized as nonsmolts. Individuals that were more deeply bodied, yellow, and spotted in color are more characteristic of larger freshwater-dwelling rainbow trout and were also categorized as nonsmolts. Fish that could not be reliably categorized were scored as missing or unknown.
Sex phenotype:
The phenotypic sex of the fish surviving to March 2004 was determined by internal examination of gonads. Fish were euthanized with a lethal dose of anesthetic (clove oil) prior to dissection. For summary statistical analyses, males were coded as 1 and females as 0.
Statistical analyses:
Body morphology, thin plate spline analysis:
Morphometric shape analysis was conducted using a thin plate spline analysis, using tpsRelw software (Rohlf 2005b). Landmarks from all fish from all time points were superimposed to calculate the generalized least-squares Procrustes average or consensus shape, eliminating size differences (Rohlf and Slice 1990). From the consensus shape, each individual sampled at each time point was evaluated for deformation from the consensus shape, and variation captured in partial warp scores (Rohlf and Bookstein 2003). The covariance matrix of partial warp scores for all individuals at all time points was used in a principal-components analysis to distill partial warp scores into fewer orthogonal dimensions describing variation in shape (Bookstein 1991). Principal components of partial warp scores are called relative warps, and these relative warps were taken as metrics for shape for use in QTL analyses.
All traits, summary statistics:
Traits were organized over the time course of sampling. With longitudinal sampling of each individual, one could conceivably conduct genotype–phenotype analyses of the trajectories of individual traits using fitting of orthogonal polynomials (Yang et al. 2006). However, because these methods are not readily implemented for interval mapping in non-growth-related traits, we chose to use metrics that were informative on whether or not the fish were smolting during the time course of the spring, based upon our biological knowledge of the physiological and morphological changes that occur during smoltification. Using time-course data, we chose to use (1) the minimum condition factor, since smolts have lower condition factors than nonsmolts; (2) the maximum and empirical range of skin reflectance values, since smolts will have larger values and may change most dramatically during smoltification; (3) the maximum Na+/K+ATPase value, since smolts achieve a higher peak ATPase during smoltification, returning to baseline levels if they do not migrate to the ocean; (4) maximum values of relative warps obtained from thin plate spline analyses (along six orthogonal axes); and (5) spring growth rates (taken as the growth from February to June) in length and weight. Individuals with incomplete time-course data were given missing data values for QTL analyses. Using the metrics chosen for each trait above, data were tested for outliers and assumptions of normality and homogeneity of variance prior to QTL analyses. Data that were nonnormal in distribution were transformed to achieve normality. Correlations between trait values used in QTL analyses were conducted using Pearson's correlations in the case where data were normal and Spearman's correlations in the case where data were not normally distributed. One-way analysis of variance was conducted (PROC GLM; SAS Statistical Software, Cary, NC) to examine whether means for continuous traits were significantly different between the sexes and life-history categories. The model used to test the null hypothesis that the means for each trait ( ) were the same for males and females (
 ) was
) was  , where
  is the phenotype of individual j of sex i. For tests of whether continuous-trait means were the same for the binary life-history category (LHbin), or for smolts and nonsmolts (
 ), the model
  was used, where
  is the continuous-trait phenotype of individual j with LHbin category i. Finally, to test whether continuous-trait means were significantly different among the life-history categories (LHcat), smolt, rainbow, parr, and unknowns (
 ), the model
  was evaluated. When overall models were significant, Tukey–Kramer tests were used to determine which pairs of means were significantly different. In all tests, statistical significance was determined with a type I error rate of α = 0.05.
Genetic analyses:
Linkage map construction:
Prior to linkage map construction, markers were evaluated for segregation distortion, or deviation from the expected 1:1 genotype ratio in doubled-haploid progeny. Markers showing significant distortion were checked for reliability and genotyping errors and were removed from the analysis if unreliable. Only markers for which >80% of individuals were genotyped were used in subsequent analyses. The genetic linkage map was constructed using Mapmaker/EXP (Lander et al. 1987) as described by Nichols et al. (2007).
QTL analyses:
Quantitative trait loci analyses were conducted using interval and composite-interval mapping (Zeng 1994) in R/qtl (Broman et al. 2003); multiple-trait interval mapping (Kao et al. 1999) was conducted using QTL Cartographer (Basten et al. 1994, 2004). In all analyses, permutation tests (Churchill and Doerge 1994; Doerge and Churchill 1996) were performed (n = 1000 permutations for each test) to determine the threshold for log of the odds (LOD) or likelihood-ratio (LR) scores, using a type I error rate of α = 0.05. To control the overall familywise error rate (FWER) in the case of multiple-QTL analyses for single traits, the highest value of the 95% LOD thresholds for all single-trait interval-mapping permutation tests was chosen as the cutoff for inclusion of QTL in the second step of composite-interval mapping, which is outlined below. This is more conservative than using false discovery rate (FDR) methods for simple interval mapping (Benjamini and Yekutieli 2005). The issue of controlling for multiple tests for subsequent single-trait composite-interval mapping (CIM) becomes more difficult, since the models for each QTL scan in CIM are different for each trait; in this case, choosing an overall FWER might be too stringent if chosen among models that range from the inclusion of one additional background cofactor to multiple background cofactors. In this case, significant QTL identified in step 2 below were those that exceeded the 95% permutation threshold for that trait.
Single-trait interval mapping:
R/qtl does not include a model for doubled haploids; thus a backcross model coding for the doubled haploids was used since models for both cross types utilize two genotypic classes for tests of significant QTL effects. In the first step, single QTL were identified with interval mapping using the EM algorithm in R, scanning for QTL at marker positions and every 2 cM in the genome. In this first interval-mapping step, the model 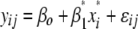 (model 1) was used test the null hypotheses that QTL additive effects are zero (
 ), where
  is the phenotype for individual
  with marker genotype
  ; and
; and  is the marker or calculated QTL genotype (given flanking marker genotypes), where
  = 0 for the OSU genotype and
  = 1 for the CW genotype. In the second step,
  significant QTL, identified in the first step, were used as cofactors in a search for additional QTL in the genome, using the model
 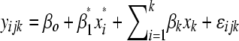 (model 2), testing again for significant QTL effects (
 ) at every 2-cM position. All terms in model 2 are the same as described above, and
  for the OSU genotype and
  for the CW genotype at the
  significant QTL positions identified in model 1. New QTL identified in model 2 were added to the set of
  QTL, and model 2 was tested again at every 2-cM position in the genome until no new QTL were identified in the context of this multiple-QTL model. Two-locus epistasis was tested at all markers and at every 5-cM position in the genome; here, epistasis was tested comparing the likelihood of the model that includes an interaction between two QTL positions (
 and
and  ),
),  +
+  (model 3), to the likelihood of the model including only main effects (where
  ). QTL positions were refined with all significant terms (single and interacting QTL) included in the model, as described by Nichols et al. (2007). Briefly, refining the QTL position involved the use of model 2 above, with the addition of significant interacting QTL from tests of model 3; refining the position of each QTL was accomplished by iteratively testing the likelihood of each QTL position within a chromosome in the context of the multiple-QTL model, until the most likely position of each QTL remained unchanged. Once positions were refined, QTL effects and percentage of variation explained (PVE) were estimated in the context of the multiple-QTL model, using a drop-one-term analysis as described by Nichols et al. (2007). Two-LOD support intervals were estimated for each identified QTL and have been shown to be conservative estimates of 95% confidence intervals for QTL position (Visscher et al. 1996).
Multiple-trait interval mapping:
Multiple-trait QTL mapping was performed using interval mapping with a doubled-haploid design in QTL Cartographer (Basten et al. 2004). Multiple-trait analyses were performed (a) with all traits used to quantify migration-related physiology and morphology and (b) with traits that colocalized to QTL in the genome. Multiple-trait permutation tests were performed by shuffling traits for each individual as a block, maintaining the correlation structure among traits while shuffling traits across marker genotypes.
RESULTS
Phenotypic traits:
A single family of 110 doubled-haploid individuals was measured for physiological and morphological traits related to smoltification. Phenotypic trait values used in QTL analyses are summarized below by life-history category assigned to each fish. Of the 110 fish used for QTL analyses, 22 (20%) were categorized as smolts, 17 (15%) as parr, and 23 (21%) as rainbow; 48 fish (44%) were intermediate in phenotype and were scored as unknowns at age 1+. Continuous-trait data are summarized below by life-history category (including unknowns) to illustrate the differences among the life-history types used to categorize the binary trait. For the binary trait, all smolts were categorized as “smolts,” while parr and rainbow were categorized as “nonsmolts”; intermediate fish were treated as missing data for the binary trait.
Phenotypes used for QTL analyses and summarized below include maximum relative warp values for six axes describing body morphology (maxrelw1–maxrelw6), maximum and range of skin reflectance values (maxrefl and rangerefl, respectively), maximum gill Na+/K+ ATPase (natural log-transformed, ln_maxatpase), minimum condition factor (minkfact), growth in standard length and weight from January through June (sprgrsl and sprgrwt, respectively), binary smolt phenotype (binary), and sex phenotype (sex). With the exception of categorical traits (sex and binary phenotype) and gill Na+/K+ ATPase, all traits conformed to the assumptions of normality and homogeneity of variance.
Body morphology:
Thirteen landmarks digitized along the left side of the fish (Figure 1) revealed significant variation in body morphology (Figure 2). Thin plate spline analyses of all doubled-haploid progeny at all time points (n = 677) revealed that the first six relative warps explained 77% of the variation in body shape; each of these relative warps explained from 5% (relw6) to 24% (relw1) of the variation in shape. Some individuals or time points were missing from the analysis due either to mortality before the end of the study or to poor-quality photographs for accurate digitization of landmarks. Examination of the shape variability captured by each of the relative warps (Figure 2) reveals that this analysis has readily captured quantitative shape variability within the doubled-haploid family. Much of the variability, looking at the extreme values for each relative warp in relation to the consensus (Figure 2), appears to be differences in (1) dorso-ventral body depth (landmarks 3, 4, and 11), (2) snout morphology (landmarks 1, 2, 12, and 13), and (3) caudal peduncle depth and length (landmarks 5–9). Relative warp 1 explained 24% of variation in shape; although rainbow trout appear to have lower maximum relw1 (Figure 3A), the differences among categories are not statistically significant [F = 2.43, d.f. = 3, P = 0.0719 (categorical); F = 0.6, d.f. = 1, P = 0.4437 (binary)]. Relative warp 2 accounted for 17% of shape variation. Fish with an undetermined life-history category had the greatest maximum relw2 values, while rainbow trout had the smallest (Figure 3A). Unknowns were significantly different from rainbow for maxrelw2, but no other pairs were statistically significant (F = 5.42, d.f. = 3, P = 0.0020). When life-history type is coded as a binary trait, not surprisingly from the similar means among smolt, parr, and rainbow, there was no statistical difference between smolts and nonsmolts for maxrelw2 (F = 0.34, d.f. = 1, P = 0.5648). Relative warp 3 explained 12% of the variation in morphology and most obviously captured the shape differences among migratory and nonmigratory life-history types (Figure 3A). Relative warp 3 appears to explain differences in dorso-ventral body depth and in caudal peduncle length and depth (Figure 2). Rainbow trout had lower average maximum relw3 (were more deep bodied), while smolts had larger maximum relw3 values (were more fusiform or less deep bodied). Parr and intermediates were morphologically similar to each other for maxrelw3, but were significantly different from smolts and rainbow trout (F = 15.54, d.f. = 3, P < 0.0001). When coded as a binary trait, nonsmolts and smolts were statistically different from one another for maxrelw3 (F = 15.52, d.f. = 1, P = 0.0003). Relative warp 4 accounted for 10% of shape variation. Maximum relw4 values were on average lower for parr than for all other groups (Figure 3A, F = 4.53, d.f. = 3, P = 0.0057). This statistical difference among groups was not observed when life-history category was coded as a binary trait (F = 0.44, d.f. = 1, P = 0.5111). Relative warps 5 and 6 explained 9 and 5% of shape variation, respectively. Neither maximum relw5 nor relw6 showed significant variation among life-history types, irrespective of coding.
Figure 2.—

Relative warps from thin plate spline analysis of morphology. (A–F) The first six relative warps, which explain 77% of the shape variation. Extreme positive (blue) and negative (red) values of each relative warp are presented in comparison to the consensus or average shape (black).
Figure 3.—

Smoltification phenotype trait means (plus or minus standard error of the mean) for traits used in QTL analyses. (A) Maximum relative warp means for morphology (maxrelw1–maxrelw6). (B) Range (rangerefl) and maximum (maxrefl) reflectance means. (C) Mean maximum Na+/K+ ATPase (ln_ATPase; ln transformed). (D) Mean minimum condition factor (minkfact). (E) Mean growth rates during the spring (February through June) in standard length (SPRGRSL) and weight (SPRGRWT).
Skin reflectance:
Average pixel intensity of the area below the dorsal fin (Figure 1) provided a quantitative estimate of the degree of reflectance or silvery color of each fish. Both maximum (maxrefl: F = 17.32, d.f. = 3, P < 0.0001) and range of (rangerefl: F = 6.73, d.f. = 3, P = 0.0004) reflectance showed significant differences among life-history groups (Figure 3B). Reflectance values were also significantly different when life-history types were encoded as a binary trait (maxrefl: F = 37.16, d.f. = 1, P < 0.0001) (rangerefl: F = 14.82, d.f. = 1, P = 0.0003). Compared to nonsmolts and unknowns, smolts had a significantly greater average maximum reflectance (were more reflective or silver in color; Figure 3B). Smolts also had a greater range in reflectance values during the time course of sampling, when compared to unknowns and rainbow trout, but not when compared to parr (Figure 3B).
Gill Na+/K+ ATPase:
Na+/K+ ATPase values were natural-log transformed to achieve normality. ATPase values were significantly different among life-history categories (F = 4.12, d.f. = 3, P = 0.0086; Figure 3C), but only marginally significant when evaluated for binary encoded life-history types (F = 3.95, d.f. = 1, P = 0.0520). Smolts had greater average maximum ATPase than unknowns and parr, but were not significantly different from the rainbow trout life-history type (Figure 3C).
Body condition factor:
Body condition factor calculates the relative contribution of weight to length. For a given length, fish with greater weight will have a larger condition factor. Minimum body condition factor was greater on average for the rainbow trout life-history type than for all other life-history types that were similar in average minimum condition factor (Figure 3D, F = 8.28, d.f. = 3, P < 0.0001). When compared using binary trait categories, the same trend is observed: nonsmolts (which include rainbow trout) have a significantly greater condition factor than smolts (F = 9.81, d.f. = 1, P = 0.0028).
Growth rates:
Spring growth rates in standard length and weight were not significantly different among life-history types (Figure 3E).
Binary smolt phenotype:
Sixty-two individuals (56%) were scored for binary smolt phenotype. Of the individuals scored, 22 individuals (35%) were categorized as smolts, and 40 (65%) were categorized as nonsmolts. In the nonsmolt category, 17 fish (42.5% of nonsmolts and 27% of all scored) were categorized as smaller parr, while 23 fish (57.5% of nonsmolts and 37% of all scored) were categorized as larger rainbow trout. The 44% of individuals that were not scored were intermediate in their phenotypes and difficult to categorize as either a smolt or a nonsmolt, and were categorized as unknowns for summary statistical analyses.
Sex phenotype:
Of the 110 individuals sampled for smoltification, 74 individuals (67%) survived to the next year when phenotypic sex was determined by internal examination of gonads. Of those sexed, 49% (n = 36) were male and 51% were female (n = 38). Sex significantly contributed to variation in both maximum reflectance (maxrefl, F = 5.41, P = 0.02) and gill Na+/K+ ATPase (maxatpase, F = 5.60, P = 0.02), but not to any other traits (data not shown). Inclusion of sex as a cofactor in QTL analyses for these two traits did not significantly affect the detection of QTL (data not shown).
Correlation among traits:
All traits used in QTL analyses were correlated with at least one other trait, with the exception of the sixth axis of morphometric shape (maxrelw6) (Table 1). Correlations between traits that were alternative expressions of reflectance [maximum and range (maxrefl, rangerefl), r = 0.942, P < 0.0001] and of growth in standard length and weight (sprgrsl and sprgrwt, r = 0.606, P < 0.0001) were greatest (Table 1). Fish with the greatest maximum reflectance also had a larger range in reflectance. Both of these metrics of reflectance were correlated with the binary smolt phenotype; smolts tended to have both higher maxima and greater ranges in reflectance. Reflectance was correlated to a lesser degree with body morphology. Maximum reflectance was negatively correlated with maxrelw2, for which no QTL were identified. Reflectance range was negatively correlated with maxrelw4, for which a QTL was colocalized with most other smoltification-related traits. Finally, the range but not the maximum reflectance had a negative correlation with minimum condition factor. This indicates that fish with a greater change in body coloration also had the lowest condition factor, which is consistent with long-standing observations that smolts both change in body coloration with smoltification and have a reduced condition factor relative to nonsmolts and the presmolting stage. Not surprisingly, fish with greater growth in standard length also experienced greater growth in weight, but this relationship is weaker than that observed for range of and maximum reflectance. Growth in both standard length and weight was negatively correlated with relative warp 3 (maxrelw3) and positively correlated with condition factor (minkfact). Individuals with lower growth rates in both length and weight generally had higher maxrelw3 values (were more fusiform in shape) and lower minimum condition factors. At the same time, individuals with higher growth rates in length and weight had lower maxrelw3 values (were more deep bodied) and higher minimum condition factors. Additional axes of body morphology, aside from those mentioned above, were also correlated with minimum condition factor. The first three relative warps were negatively correlated with condition factor; individuals with higher values for these relative warps generally had lower minimum condition factors. The binary smolt phenotype was positively correlated with reflectance (both maximum and range) and maxrelw3 and negatively correlated with minimum condition factor. Individuals that were scored as smolts had greater maximum and range of reflectance, greater values for maxrelw3 (more fusiform in shape), and lower minimum condition factors.
TABLE 1.
Pairwise correlations among phenotypic trait values used for QTL analyses
| maxrefl | ln_atpase | sprgrsl | sprgrwt | maxrelw1 | maxrelw2 | maxrelw3 | maxrelw4 | maxrelw5 | maxrelw6 | minkfact | Binarya | |
|---|---|---|---|---|---|---|---|---|---|---|---|---|
| rangerefl | 0.60646 | 0.18508 | −0.02974 | −0.00596 | 0.00741 | 0.00561 | 0.20075 | −0.26422 | 0.01706 | 0.03007 | −0.24561 | 0.42154 |
| <0.0001 | 0.088 | 0.7833 | 0.956 | 0.9497 | 0.9619 | 0.0842 | 0.022 | 0.8845 | 0.7979 | 0.0226 | 0.0021 | |
| 89 | 86 | 88 | 88 | 75 | 75 | 75 | 75 | 75 | 75 | 86 | 51 | |
| maxrefl | 0.18276 | 0.04239 | 0.06724 | −0.07931 | −0.22756 | 0.18437 | −0.04546 | −0.11197 | −0.15286 | −0.02022 | 0.65298 | |
| 0.0921 | 0.695 | 0.5336 | 0.4988 | 0.0496 | 0.1133 | 0.6986 | 0.3389 | 0.1904 | 0.8534 | <0.0001 | ||
| 86 | 88 | 88 | 75 | 75 | 75 | 75 | 75 | 75 | 86 | 51 | ||
| ln_atpase | 0.39227 | 0.3112 | −0.16369 | −0.12654 | 0.15658 | 0.06972 | −0.16223 | 0.06343 | −0.04988 | 0.24205 | ||
| <0.0001 | 0.002 | 0.1605 | 0.2794 | 0.1798 | 0.5523 | 0.1643 | 0.5887 | 0.633 | 0.0723 | |||
| 96 | 96 | 75 | 75 | 75 | 75 | 75 | 75 | 94 | 56 | |||
| sprgrsl | 0.94194 | 0.04153 | −0.11395 | −0.33521 | 0.18303 | −0.13708 | 0.08308 | 0.30377 | −0.06681 | |||
| <0.0001 | 0.7199 | 0.3237 | 0.0029 | 0.1111 | 0.2345 | 0.4725 | 0.0026 | 0.6215 | ||||
| 98 | 77 | 77 | 77 | 77 | 77 | 77 | 96 | 57 | ||||
| spgrwt | 0.06042 | −0.13523 | −0.38475 | 0.17854 | −0.09179 | 0.05493 | 0.38342 | −0.10733 | ||||
| 0.6017 | 0.2409 | 0.0006 | 0.1203 | 0.4272 | 0.6351 | 0.0001 | 0.4268 | |||||
| 77 | 77 | 77 | 77 | 77 | 77 | 96 | 57 | |||||
| maxrelw1 | −0.06516 | 0.16817 | 0.13076 | 0.35169 | 0.09101 | −0.24676 | 0.11689 | |||||
| 0.5734 | 0.1437 | 0.257 | 0.0017 | 0.4312 | 0.0316 | 0.4391 | ||||||
| 77 | 77 | 77 | 77 | 77 | 76 | 46 | ||||||
| maxrelw2 | 0.0713 | 0.19152 | −0.1359 | −0.15552 | −0.37472 | 0.12033 | ||||||
| 0.5377 | 0.0952 | 0.2386 | 0.1768 | 0.0009 | 0.4257 | |||||||
| 77 | 77 | 77 | 77 | 76 | 46 | |||||||
| maxrelw3 | 0.01411 | 0.11061 | 0.05611 | −0.58458 | 0.52602 | |||||||
| 0.9031 | 0.3382 | 0.6279 | <0.0001 | 0.0002 | ||||||||
| 77 | 77 | 77 | 76 | 46 | ||||||||
| maxrelw4 | 0.047 | −0.04327 | 0.0225 | 0.12377 | ||||||||
| 0.6848 | 0.7086 | 0.847 | 0.4125 | |||||||||
| 77 | 77 | 76 | 46 | |||||||||
| maxrelw5 | −0.06061 | 0.05524 | 0.02063 | |||||||||
| 0.6005 | 0.6355 | 0.8918 | ||||||||||
| 77 | 76 | 46 | ||||||||||
| maxrelw6 | 0.15719 | −0.01719 | ||||||||||
| 0.1751 | 0.9097 | |||||||||||
| 76 | 46 | |||||||||||
| minkfact | −0.4 | |||||||||||
| 0.0025 | ||||||||||||
| 55 |
Abbreviations for traits are described in the text. Significant correlations are in italics. For each pair of traits, correlation coefficients, P-values for tests of Ho: ρ = 0, and sample size are shown. Underlined pairs are traits for which QTL colocalize.
Spearman's correlation coefficients; all other correlation coefficients are Pearson's coefficients.
Genetic linkage map:
Twenty-nine major linkage groups were identified with linkage analysis in 110 doubled-haploid individuals, using 263 markers and the sex phenotype. The number of major groups corresponds to the number of chromosome pairs revealed by karyotyping in the OSU and CW clonal lines and hybrids (Phillips et al. 2005). Synteny among linkage groups in this study and other rainbow trout maps (Sakamoto et al. 2000; Nichols et al. 2003; Danzmann et al. 2005; Guyomard et al. 2006) is established by mapped syntenic microsatellite markers; linkage groups are named according to the cross (OC) and the linkage group number defined in prior maps (Figure 4; only groups with significant QTL are shown). The average intermarker distance within linkage groups, including markers with 0-cM distances, was 5.8 cM; excluding markers that were completely linked (0-cM distance), the average intermarker distance was 7.5 cM. The sex phenotype mapped to linkage group OC1 and was perfectly linked to marker Ssa408UoS (0-cM distance). This map was the framework for our QTL analysis of smoltification-related traits.
Figure 4.—


Quantitative trait loci (shown as 2-LOD support intervals) for smoltification traits from single-trait and multiple-trait interval mapping. Only linkage groups with significant QTL are shown. Linkage groups are named according to the cross used in this study (OSU × CW: OC) and the linkage group number defined by syntenic markers (in boldface type) with previously published rainbow trout maps.
QTL analyses:
With composite-interval mapping for single traits, QTL were identified for each trait with the exception of morphology metrics maxrelw2 and maxrelw6 and gill Na+/K+ ATPase (Figure 4, Table 2). QTL are named according to the trait and the linkage group to which they localized. In all cases, the genotypic effect of a QTL refers to the estimated phenotypic difference between the CW genotype and the OSU genotype attributed to the additive effects of alleles at that QTL. A positive genotypic effect would indicate that individuals with a CW genotype at a particular QTL would have a greater phenotypic trait value, attributed to that locus, than individuals with the OSU genotype. Note that although determining statistical thresholds for significance in the context of multiple tests is not a simple one to address in the context of IM and CIM for the detection of QTL, most all QTL, in the context of the multiple-QTL models, were significant at P < 0.0001. Although a Bonferroni correction for the 13 single traits may not be correct in the case of multiple nonindependent traits, even in the most conservative case that the traits are independent, the nominal P-value for significance would be α = 0.05/13 or 0.004. All except for one QTL for body morphology (maxrelw3-OC8) were significantly below this threshold in the multiple-QTL models.
TABLE 2.
Quantitative trait loci for morphological and physiological indexes of migratory life-history types
| Genotypic effects
|
|||||||||
|---|---|---|---|---|---|---|---|---|---|
| QTL | Position | Closest marker | d.f. | n | LOD | % VE | χ2P-value | 2a | SE |
| maxrelw1-OC13 | 12.6 | agcagt7 | 1 | 77 | 2.65 | 11.6 | <0.0001 | 0.00837 | 0.00235 |
| maxrelw1-OC31 | 27.1 | acgatc6 | 1 | 4.05 | 18.5 | <0.0001 | −0.0106 | 0.0023 | |
| maxrelw3-OC3 | 48.9 | Ogo2 | 1 | 77 | 3.37 | 10.9 | <0.0001 | 0.00647 | 0.00161 |
| maxrelw3-OC8 | 0 | acgatc13 | 1 | 1.00 | 3.02 | 0.0320 | 0.00349 | 0.00166 | |
| maxrelw3-OC20 | 24.3 | OMM5017aa | 1 | 4.23 | 14.1 | <0.0001 | 0.00716 | 0.00157 | |
| maxrelw3-OC23 | 11.7 | RXRAa | 1 | 3.72 | 12.2 | <0.0001 | 0.00685 | 0.00161 | |
| maxrelw4-OC9 | 22 | agcagc2 | 1 | 77 | 4.63 | 18.1 | <0.0001 | −0.00663 | 0.00142 |
| maxrelw4-OC20 | 8 | GCR | 1 | 3.44 | 13.0 | <0.0001 | −0.00541 | 0.00145 | |
| maxrelw4-OC22 | 34 | acgaag6 | 1 | 2.81 | 10.4 | <0.0001 | 0.00543 | 0.0015 | |
| maxrelw5-OC31 | 23 | accacg1 | 1 | 77 | 2.53 | 14.1 | 0.0006 | −0.00598 | 0.00171 |
| rangerefl-OC16 | 80 | agcagt3 | 1 | 89 | 3.06 | 11.2 | <0.0001 | 4.86 | 1.24 |
| rangerefl-OC20 | 24.3 | OMM5017aa | 1 | 6.11 | 24.3 | <0.0001 | 6.82 | 1.21 | |
| maxrefl-OC17 | 13.4 | acgagt2 | 1 | 89 | 3.50 | 14.4 | <0.0001 | 6.50 | 1.57 |
| maxrefl-OC20 | 35.3 | agcagt19 | 1 | 2.72 | 11.0 | <0.0001 | 5.67 | 1.57 | |
| minkfact-OC20 | 24.3 | OMM5017aa | 1 | 99 | 3.20 | 13.8 | 0.00012 | −0.0860 | 0.0218 |
| sprgrsl-OC8 | 14.4 | OMM1009a | 1 | 98 | 4.03 | 13.3 | <0.0001 | 0.0602 | 0.0138 |
| spgrsl-OC14 | 29.3 | OMM5017b | 2 | 5.45 | 18.7 | <0.0001 | 0.0406 | 0.0166 | |
| sprgrsl-OC20 | 58 | agcagc14 | 2 | 4.41 | 14.7 | <0.0001 | 0.0249 | 0.0171 | |
| sprgrsl-OC14 × sprgrsl-OC20 | 1 | 3.62 | 11.8 | <0.0001 | −0.140 | 0.0341 | |||
| sprgrwt-OC8 | 14.4 | OMM1009a | 1 | 98 | 3.17 | 12.0 | <0.0001 | 0.172 | 0.044 |
| spgrwt-OC20 | 24.3 | OMM5017aa | 1 | 3.29 | 12.5 | <0.0001 | −0.174 | 0.044 | |
| binary_smolt-OC6 | 4 | agcatc2 | 1 | 62 | 2.89 | 9.0 | <0.0001 | −0.296 | 0.086 |
| binary_smolt-OC14 | 22 | acgaca10 | 2 | 4.30 | 14.1 | <0.0001 | −0.254 | 0.115 | |
| binary_smolt-OC20 | 44 | agcatc11 | 1 | 2.85 | 8.8 | <0.0001 | 0.395 | 0.116 | |
| binary_smolt-OC25 | 0 | agcaga4 | 2 | 4.68 | 15.6 | <0.0001 | −0.176 | 0.086 | |
| binary_smolt-OC14 × binary_smolt-OC25 | 1 | 4.18 | 13.6 | <0.0001 | 0.752 | 0.183 | |||
Statistics were obtained from a drop-one-term multiple-QTL model analysis following identification of main-effect and epistatic QTL with interval and composite-interval mapping. Underlined QTL were not identified as significant main-effect QTL in interval or composite-interval mapping, but were significant contributors to epistasis. % VE, percentage of variation explained.
Marker is a member of a cluster of markers.
Body morphology:
Ten QTL for maximum relative warp values for four axes of shape were identified (Figure 4 and Table 2). For maxrelw1, 2 QTL were identified on two linkage groups, OC13 and OC31, explaining 11.6 and 18.5% of the phenotypic variation in maxrelw1. The QTL on linkage group OC31 colocalizes with QTL for maxrelw5, another axis of morphometric shape. No QTL were identified for maxrelw2, despite the significant variation observed among the fish sampled. For maxrelw3, the descriptor that captured dorso-ventral variability in body depth and caudal peduncle shape, 4 main-effect QTL were identified. These QTL explained 3.0–14.1% of the phenotypic variability along this shape axis. The QTL on linkage group OC8 was statistically significant in a single-QTL interval-mapping scan, but did not significantly contribute to the overall, multiple-QTL model when all other QTL were included (Table 2). Maxrelw3 QTL on linkage groups OC8 and OC20 colocalized with QTL for other traits in this analysis. Each of the 4 QTL for maxrelw3 had a positive genotypic effect, indicating that individuals with a CW genotype (paternal) at these loci had larger maximum values of relw3 than those with an OSU genotype at this locus; this difference in genotypic values at these loci exhibits a more dorso-ventrally flattened or fusiform fish, characteristic of smolts, in those with the CW genotype relative to those with the OSU genotype. For maxrelw4, 3 QTL were identified, explaining 10.4–18.1% of variation in shape along this axis. The two QTL with the greatest effects were found on OC9 and OC20, and both had negative genotypic effects. The QTL for maxrelw4 on OC20 (maxrelw4-OC20) colocalized to the same region as maxrelw3-OC20 and other smoltification traits. One additional QTL was identified for body morphology with maxrelw5. The QTL for this morphological shape descriptor explained 14.1% of shape variation and was localized to OC31, the same region as that for maxrelw1-OC31.
Skin reflectance:
A total of four QTL were identified for the two metrics of skin reflectance, maximum reflectance (maxrefl) and range of reflectance (rangerefl) (Table 2, Figure 4). Two QTL were detected for rangerefl, rangerefl-OC16 and rangerefl-OC20; these QTL accounted for 11.2 and 24.3% of the variation in the range of reflectance, respectively. Two QTL were identified for maxrefl, maxrefl-OC17 and maxrefl-OC20, which explained 14.4 and 11.1% of the variation in maximum reflectance, respectively. QTL for reflectance on OC16 and OC17 did not colocalize with QTL for other traits; however, reflectance QTL on OC20 did colocalize with QTL for other traits on this linkage group (Figure 4). Each of the reflectance QTL had positive genotypic effects (Table 2), indicating that individuals with a CW genotype at each locus had a greater maximum or range of reflectance than individuals with an OSU genotype.
Gill Na+/K+ ATPase:
No QTL were detected for maximum log-transformed gill Na+/K+ ATPase, despite the variation observed among life-history types.
Body condition factor:
One QTL for minimum body condition factor (minkfact) was identified on OC20 (Table 2); this QTL colocalizes to the same region as many other traits, including reflectance and body morphology QTL (Figure 4). The minkfact-OC20 QTL accounted for 13.8% of the variation in minimum condition factor and had a negative genotypic effect. Individuals with a CW genotype at this locus had a smaller minimum condition factor compared to those with an OSU genotype.
Growth rate:
QTL for spring growth rate in standard length (sprgrsl) and weight (sprgrwt) colocalized to linkage groups OC8 and OC20 (Table 2). It is clear that sprgrsl-OC8 and sprgrwt-OC8 colocalize to the same region, but 2-LOD support intervals for sprgrsl-OC20 and sprgrwt-OC20 do not overlap on linkage group OC20 (Figure 4). One additional QTL (sprgrsl-OC14) and two-locus epistasis were revealed for spring growth rate in standard length (Table 2). Main-effect QTL for spring growth rate in standard length each had positive genotypic effects; individuals with a CW genotype had greater spring growth rate in standard length compared to those with an OSU genotype with differences ranging from 0.025 ± 0.017% (sprgrsl-OC20) to 0.060 ± 0.014% (sprgrsl-OC8) growth in standard length per day (Table 2). Epistasis between sprgrsl-OC14 and sprgrsl-OC20 had the opposite effect on growth rate; individuals with CW genotypes at both of these loci had 0.140 ± 0.034% lower growth rate in standard length than individuals with OSU genotypes at both loci (Figure 5). The two QTL for spring growth in weight were opposite in their effects. For sprgrwt-OC8, individuals with a CW genotype had larger growth rates in weight relative to those with an OSU genotype (genotypic effect: 0.172 ± 0.044% growth in weight per day); for sprgrwt-OC20, individuals with a CW genotype exhibited a slower spring growth rate in weight compared to those with the OSU genotype (genotypic effect: −0.174 ± 0.044% growth in weight per day).
Figure 5.—

Joint genotypic effects or two-locus epistasis for spring growth rate in standard length. Phenotypic values (points) and means (plus or minus standard error of the mean) for each multilocus genotype are shown. Red symbols were calculated from imputed genotypes in missing individuals.
Binary smolt phenotype:
Two main-effect QTL were identified for the binary smolt phenotype (Figure 4). These QTL were detected on OC6 and OC20 and explained 9.0 and 8.8%, respectively, of the variation in the binary phenotype (Table 2). In a linear model or analysis of variance context, like that employed in the drop-one-term analysis, main-effect regression coefficients from binary trait data are estimates of the penetrance of the loci identified (Coffman et al. 2005). Therefore, the genotypic effects (Table 2) exhibit the penetrance differences for OSU and CW genotypes for each QTL, in the context of a multiple-binary-trait loci model. A positive genotypic effect in this case indicates that the CW genotype is more penetrant; in other words, individuals with the CW genotype are more likely to be smolts than individuals with the OSU genotype at a particular locus. For simplicity, we plot observed proportions of smolts and nonsmolts for each genotype at markers most closely linked to the identified binary trait loci (Figure 6, A–C). For binary_smolt-OC20, the CW genotype was more penetrant than the OSU genotype; 82% of those classified as smolts possessed the CW genotype at binary_smolt-OC20 (and scored for the binary phenotype), while only 18% of smolts possessed the OSU genotype at this locus (Figure 6A). Oppositely, binary_smolt-OC6 had a greater penetrance in those with the OSU genotype; a greater proportion of individuals with the OSU genotype at this locus were smolts compared to those with the CW genotype. For binary_smolt-OC6, 64% of those classified as smolts possessed the OSU genotype, while only 36% of smolting individuals possessed the CW genotype at this locus (Figure 6B). Epistasis significantly contributed to the variation in binary phenotype; binary_smolt-OC14 and binary_smolt-OC25 showed a significant interactive effect, explaining 13.6% of the variation in binary phenotype (Table 2), but did not affect variation in penetrance as main-effect QTL. The LOD scores for these individual loci appear significant (Table 2), but simply reflect the significance of dropping main-effect and all higher-order interactions including that locus; for these loci, composite-interval mapping including all other significant terms as cofactors does not identify main-effect QTL at these loci (data not shown). Complete penetrance (100%, n = 11/11) was observed as a result of epistasis between OSU genotypes at binary_smolt-OC14 and binary_smolt-OC25; on the other hand, no individuals with CW and OSU genotypes at binary_smolt-OC14 and binary_smolt-OC25, respectively, were smolts (n = 0/11; Figure 6C). The remaining two joint genotypic classes produced intermediate proportions of smolts: 25% (n = 4/12) of individuals with CW, CW genotypes and 36% (n = 5/14) with OSU, CW genotypes at binary_smolt-OC14 and binary_smolt-OC25 were smolts (Figure 6C).
Figure 6.—

Binary-trait proportions for binary-trait loci with significant main effects (A and B) and significant two-locus epistasis (C).
Multiple-trait analysis:
Joint- or multiple-trait QTL analyses were conducted using (a) all 12 traits used to quantify physiological and morphological metrics of smoltification and (b) only the 7 quantitative traits that colocalized to OC20 (underlined in Table 1). For each of these scenarios, correlations were not significant for all pairs of traits, but each trait was significantly correlated with at least one other trait (Table 1), with the exception of maxrelw6. A single-QTL interval-mapping scan for all 12 traits revealed a total of 4 QTL (Figure 4). Approximate P-values for significance were obtained from 1000 permutations of the phenotypes (shuffled as a block) across genotypes. Joint QTL for the 12-trait data set were found on linkage groups OC8 (LOD = 10.45, P < 0.01 from 1000 permutations), OC14 (LOD = 9.32, 0.01 < P < 0.05), OC20 (LOD = 16.70, P < 0.01), and OC31 (LOD = 9.02, 0.01 < P < 0.05). When the 12-trait joint QTL on OC20 was included as a background cofactor in the model, all main-effect QTL remained significant except the QTL on OC14 (LOD = 1.96, P ≫ 0.05); no additional main-effect QTL were identified. Joint QTL for the 7-trait data set (including traits colocalizing to OC20) also revealed 4 QTL, but not all in the same positions as those identified in the 12-trait data set (Figure 4). Joint QTL for the 7-trait data set were found on linkage groups OC8 (LOD = 7.35, P < 0.01), OC20 (LOD = 13.35, P < 0.01), OC21 (LOD = 7.09, P < 0.01), and OC30 (LOD = 7.73, P < 0.01). All joint QTL in the 7-trait data set remained significant when the QTL on OC20 was included as a background cofactor in a genome scan, and no additional joint QTL were identified. Not surprisingly, joint QTL for both analyses colocalize to regions where multiple single traits localize, most notably for OC-8 and OC-20 (Figure 4).
DISCUSSION
We have identified several genome regions associated with variation in multiple morphological and physiological indexes of smoltification in O. mykiss, a species that consists of both resident and anadromous or migratory life-history types. This is the first study to reveal genomic loci associated with migration physiology in any fish. Our results provide a foundation for a deeper understanding of the genes and regulatory mechanisms underlying smoltification, or the decision to migrate or stay, in this species. As we reveal the genomic regions and genes involved in this important life-history decision, we may begin to understand the evolutionary history of smoltification within O. mykiss and gain a better understanding of how genes and environment influence the decision to migrate or maintain residency. Ultimately, this study lays the foundation for parallel studies in this and other salmonid species to begin asking questions about the origins and evolution of migration vs. residency.
Our findings indicate that a few genomic loci contribute to variation in the individual trait phenotypes and that one genome region is strongly associated with multiple smoltification traits. The distribution of QTL effects in this study is not unlike the skewed distribution of QTL effects in QTL analyses of complex traits observed across many taxa, and with the limitations of sample size in this study, it is likely that small-effect loci were not detected (Lynch and Walsh 1998; Roff 2007). The fact that all traits for which significant differences were observed among life-history types are associated with a common genome region suggests that either a single locus or multiple linked loci may play a role in the physiology associated with migration vs. residency. The QTL on OC20 are associated with body morphology, skin coloration or silvering, condition factor, and growth rate; not surprisingly, when these traits are considered together either subjectively in binary trait analysis or objectively in joint analysis, the same major region is identified. The fact that multiple single-trait QTL underlie the binary smoltification QTL further corroborates the idea that migration vs. residency is a threshold trait, regulated by underlying continuous traits that contribute to the decision to migrate or stay. Does the colocalization of continuous and binary traits suggest that a master regulatory region or gene may play a significant role in the integrated cascade of events that promote smoltification or residency? It cannot be ruled out that a single gene upstream of the complex, integrated endocrine and growth cascades is responsible for regulating the “switch” that determines whether an individual will undergo smoltification. Despite the long history of studies on smolt physiology, no studies have yet detected the molecular processes triggering and integrating these complex endocrine and physiological processes involved in smoltification. Dissection of the genome region on OC20 together with functional studies will provide clues on whether a single trigger controls many of the physiological differences between smolts and residents.
For most of the detected QTL in this study, the majority of additive effects are unidirectional for individual quantitative traits. For example, for traits significantly segregating between smolt and nonsmolt categories (relative warps 3 and 4, reflectance (maximum and range), and minimum condition factor) there is a preponderance of genotypic effects with the same sign or influencing the trait in the same direction. Under neutral expectations, the signs or directions of effects are expected to be random for a given phenotype (Orr 1998). Our results suggest that additive effects for proximate physiology associated with smolt status may be a result of directional selection. In other words, genes associated with smoltification physiology and morphology are primarily found only in the steelhead line (CW). This result, however, does not hold for the binary-trait QTL. In binary-trait analysis, one locus, found on the linkage group where most other quantitative traits localized (OC20), influences the trait as expected under directional selection and fixation of steelhead alleles in the steelhead line (and nonsmolt alleles in the rainbow trout line). However, the other binary trait locus detected (on OC6) has an opposite effect; individuals possessing the steelhead (CW) allele at this locus have a lower propensity for smolting than OSU. Taken together, there is clear evidence that the multiple genes for being steelhead or rainbow trout in smoltification physiology have been fixed for the most part in the OSU and CW lines, but there is still some evidence for “rainbow trout” genes in the steelhead line and vice versa. What does this mean for adaptive genetic variation for smoltification in the populations from which the lines were derived? Depending on allele frequencies in the source populations, this may mean that even where one life-history strategy is predominant, there may be adaptive potential to respond to environmental change.
In this study, we revealed genomic loci associated with life-history diversity in an evolutionarily divergent cross of O. mykiss (between a rainbow trout derived from California and a steelhead trout derived from Idaho), and it is unknown whether loci associated with smoltification in this wide cross would be the same between sympatric O. mykiss life-history types. Across the natural range of O. mykiss, there is considerable variability in the propensity to migrate. Landlocked and the most northerly populations are wholly resident, while populations with connections to the sea exhibit variable proportions of migratory individuals ranging from wholly anadromous to partially anadromous (a mixture of anadromous and resident life-history types) (Quinn and Myers 2004; McPhee et al. 2007). The degree of genetic differentiation between resident and anadromous populations of O. mykiss in sympatry is variable. Most studies examining genetic differentiation between sympatric life-history types of O. mykiss reveal that alternative life-history forms within the same freshwater system are more closely related to one another than are the same life-history types across river systems (Docker and Heath 2003; Narum et al. 2004; Olsen et al. 2006; McPhee et al. 2007); however, there are some instances where significant reproductive isolation has been observed between sympatric O. mykiss life-history forms (Docker and Heath 2003; Narum et al. 2004). In other words, resident and anadromous O. mykiss in sympatry exhibit some level of gene flow, and there is evidence for plasticity in the expression of the alternative life histories. The close genetic relationship between resident and anadromous life-history types in sympatry is not unique to O. mykiss, but is found in other salmonid species that exhibit variation in anadromy vs. residency (Hindar et al. 1991; Jones et al. 1997; Quinn 2005). With possible multiple parallel examples of life-history diversification within and across salmonid species, the question remains whether the same or different sets of genes play a role in the diversification of (1) anadromous and resident salmonid life histories and (2) timing of migration in anadromous species. Continued studies examining the genetic architecture of these alternative life-history strategies within and among populations and species will address these questions.
The salmonid lineage experienced a whole-genome duplication by autotetraploidization ∼25–100 MYA (Allendorf and Thorgaard 1984). The recent genome duplication within salmonids affords the opportunity to ask questions regarding how duplicated genome regions play a role in the evolution of complex phenotypes. Genomic resources for the salmonid lineage are more extensive than for any other major group of fishes and provide the opportunity to understand complex trait evolution following a genome duplication in multiple, closely related species. Homeologous relationships among duplicated chromosome arms have been identified for several salmonid species (Danzmann et al. 2005; Gharbi et al. 2006; Guyomard et al. 2006). In our study, we find direct evidence that at least one pair of duplicated, homeologous genome regions is associated with smoltification-related traits. The duplicated EST-linked microsatellite, OMM5017 is linked to a QTL identified in the 12-trait joint analysis and to a lesser degree with QTL for spring growth rate in standard length on homeologous linkage groups OC14 and OC20 (Figure 4). For homeologous chromosomes (for which >1 marker has previously identified homeologues) from prior O. mykiss mapping studies (Nichols et al. 2003; Danzmann et al. 2005; Guyomard et al. 2006), there is indirect evidence that QTL for body morphology (maxrelw4) localize to homeologous linkage groups OC9 and OC20. We cannot ascertain whether the duplicate genes or closely linked loci are fundamentally associated with smoltification trait variation in this study. However, this and other studies (O'Malley et al. 2002; Moghadam et al. 2007) suggest that duplicate copies could play a role in the expression of quantitative traits in salmonid taxa. The role of duplication and subsequent duplicate gene evolution remains an important question as the genetic architecture of life histories and other quantitative traits is revealed in this major group of fishes.
To summarize, we have identified genome regions associated with smoltification or the physiological and morphological transition that occurs prior to seaward migration. In particular, one region that is associated with multiple traits lends insight into the genetic basis of multiple correlated traits. We emphasize that in the absence of functional tests for migratory displacement, we cannot ascertain whether genome regions associated with the ultimate decision to migrate are the same as that associated with these proximate metrics of smoltification. The question of whether this same region is associated with smoltification in other salmonids remains unanswered, but this study lays the foundation for parallel studies in this and other species. Ultimately, with parallel accounts of the genetic architecture of smoltification and migration in multiple salmonid species, we can begin to understand the evolution of anadromy on both coarse and fine scales.
Acknowledgments
The authors thank Kyle Sundin, Kyle Martin, Steve Patton, Alan Inderrieden, and Lee Suksdorf for assistance in fish sampling at Washington State University. Trout eggs for the production of clonal lines and doubled haploids were provided by Troutlodge. Bench space for ATPase quantification was kindly provided by Penny Swanson and Brian Beckman, Northwest Fisheries Science Center (NWFSC), and laboratory assistance was provided by Kathy Cooper. Philip Haner was helpful in discussions on quantification of body reflectance. The authors thank Gary Winans and James Rohlf for discussions on morphometric statistical analyses. Later molecular work was completed at the NWFSC in the Conservation Biology DNA laboratory under the direction of Linda Park and Michael Ford, with the kind assistance of Elizabeth Heeg. Julia Sharp, Montana State University, was helpful with general statistical discussions. Rodney McPhail, Purdue University, was helpful in the production of scientific illustrations and figures. Karl Broman, Johns Hopkins University, kindly provided code for refining QTL positions in R/qtl and was helpful in discussions on statistical issues in QTL analyses. The authors thank Michael Ford and Ted Morgan and anonymous reviewers and the editor for comments that improved the final manuscript. This research was funded by the National Science Foundation to G.H.T. (IBN-0082773) and by a National Research Council postdoctoral fellowship to K.M.N.
References
- Allendorf, F., and G. Thorgaard, 1984. Tetraploidy and the evolution of salmonid fishes, pp. 1–46 in Evolutionary Genetics of Fishes, edited by B. J. Turner. Plenum Press, New York.
- Ando, D., T. Kitamura and S. Mizuno, 2005. Quantitative analysis of body silvering during smoltification in masu salmon using chromameter. North Am. J. Aquacult. 67 160–166. [Google Scholar]
- Basten, C. J., B. S. Weir and Z.-B. Zeng, 1994. Zmap—a QTL cartographer, pp. 65–66 in 5th World Congress on Genetics Applied to Livestock Production: Computing Strategies and Software, edited by D. Smith, S. Gavora, B. Benkel, J. Chesnais, W. Fairfull et al. 5th World Congress on Genetics Applied to Livestock Production, Guelph, Ontario, Canada.
- Basten, C. J., B. S. Weir and Z.-B. Zeng, 2004. QTL Cartographer v. 1.17. North Carolina State University, Raleigh, NC.
- Beeman, J. W., D. W. Rondorf and M. E. Tilson, 1994. Assessing smoltification of juvenile spring Chinook salmon (Oncorhynchus tshawytscha) using changes in body morphology. Can. J. Fish. Aquat. Sci. 51 836–844. [Google Scholar]
- Beeman, J. W., D. W. Rondorf, M. E. Tilson and D. A. Venditti, 1995. A nonlethal measure of smolt status of juvenile steelhead based on body morphology. Trans. Am. Fish. Soc. 124 764–769. [Google Scholar]
- Benjamini, Y., and D. Yekutieli, 2005. Quantitative trait loci analysis using the false discovery rate. Genetics 171 783–789. [DOI] [PMC free article] [PubMed] [Google Scholar]
- Bookstein, F. L., 1991. Morphometric Tools for Landmark Data: Geometry and Biology. Cambridge University Press, Cambridge, UK/New York.
- Broman, K. W., H. Wu, S. Sen and G. A. Churchill, 2003. R/qtl: QTL mapping in experimental crosses. Bioinformatics 19 889–890. [DOI] [PubMed] [Google Scholar]
- Churchill, G. A., and R. W. Doerge, 1994. Empirical threshold values for quantitative trait mapping. Genetics 138 963–971. [DOI] [PMC free article] [PubMed] [Google Scholar]
- Clarke, W. C., R. E. Withler and J. E. Shelbourn, 1992. Genetic control of juvenile life history pattern in chinook salmon (Oncorhynchus tshawytscha). Can. J. Fish. Aquat. Sci. 49 2300–2306. [Google Scholar]
- Clarke, W. C., R. E. Withler and J. E. Shelbourn, 1994. Inheritance of smolting phenotypes in backcrosses of hybrid stream-type X ocean-type chinook salmon (Oncorhynchus tshawytscha). Estuaries 1A 13–25. [Google Scholar]
- Coffman, C. J., R. W. Doerge, K. L. Simonsen, K. M. Nichols, C. Duarte et al., 2005. Model selection in binary trait locus mapping. Genetics 170 1281–1297. [DOI] [PMC free article] [PubMed] [Google Scholar]
- Danzmann, R. G., M. Cairney, W. S. Davidson, M. M. Ferguson, K. Gharbi et al., 2005. A comparative analysis of the rainbow trout genome with 2 other species of fish (Arctic charr and Atlantic salmon) within the tetraploid derivative Salmonidae family (subfamily: Salmoninae). Genome 48 1037–1051. [DOI] [PubMed] [Google Scholar]
- Dickhoff, W. W., B. R. Beckman, D. A. Larsen, C. Duan and S. Moriyama, 1997. The role of growth in endocrine regulation of salmon smoltification. Fish Physiol. Biochem. 17 231–236. [Google Scholar]
- Dingle, H., 2006. Animal migration: Is there a common migratory syndrome? J. Ornithol. 147 212–220. [Google Scholar]
- Docker, M. F., and D. D. Heath, 2003. Genetic comparison between sympatric anadromous steelhead and freshwater resident rainbow trout in British Columbia, Canada. Conserv. Genet. 4 227–231. [Google Scholar]
- Doerge, R. W., and G. A. Churchill, 1996. Permutation tests for multiple loci affecting a quantitative character. Genetics 142 285–294. [DOI] [PMC free article] [PubMed] [Google Scholar]
- Duston, J., 1995. A light-reflectance meter to quantify silvering during smolting in Atlantic salmon. J. Fish Biol. 46 912–914. [Google Scholar]
- Duston, J., T. Astatkie and P. F. MacIsaac, 2005. Genetic influence of parr versus anadromous sires on the life histories of Atlantic salmon (Salmo salar). Can. J. Fish. Aquat. Sci. 62 2067–2075. [Google Scholar]
- Folmar, L. C., and W. W. Dickhoff, 1980. The parr-smolt transformation (smoltification) and seawater adaptations in salmonids. Aquaculture 21 1–37. [Google Scholar]
- Foote, C. J., C. C. Wood, W. C. Clarke and J. Blackburn, 1992. Circannual cycle of seawater adaptability in Oncorhynchus nerka: genetic differences between sympatric sockeye salmon and kokanee. Can. J. Fish. Aquat. Sci. 49 99–109. [Google Scholar]
- Foote, C. J., I. Mayer, C. C. Wood, W. C. Clarke and J. Blackburn, 1994. On the developmental pathway to nonanadromy in sockeye salmon, Oncorhynchus nerka. Can. J. Zool.—Rev. Can. Zool. 72 397–405. [Google Scholar]
- Gharbi, K., A. Gautier, R. G. Danzmann, S. Gharbi, T. Sakamoto et al., 2006. A linkage map for brown trout (Salmo trutta): chromosome homeologies and comparative genome organization with other salmonid fish. Genetics 172 2405–2419. [DOI] [PMC free article] [PubMed] [Google Scholar]
- Gorbman, A., W. W. Dickhoff, J. L. Mighell, E. F. Prentice and F. W. Waknitz, 1982. Morphological indices of developmental progress in the parr-smolt coho salmon, Oncorhynchus kisutch. Aquaculture 28 1–19. [Google Scholar]
- Groot, C., and L. Margolis (Editors), 1991. Pacific Salmon Life Histories. UBC Press, Vancouver, BC.
- Guyomard, R., S. Mauger, K. Tabet-Canale, S. Martineau, C. Genet et al., 2006. A type I and type II microsatellite linkage map of rainbow trout (Oncorhynchus mykiss) with presumptive coverage of all chromosome arms. BMC Genomics 7 302. [DOI] [PMC free article] [PubMed] [Google Scholar]
- Haner, P. V., J. C. Faler, R. M. Schrock, D. W. Rondorf and A. G. Maule, 1995. Skin reflectance as a nonlethal measure of smoltification for juvenile salmonids. North Am. J. Fish. Manag. 15 814–822. [Google Scholar]
- Hindar, K., B. Jonsson, N. Ryman and G. Stahl, 1991. Genetic relationships among landlocked, resident, and anadromous brown trout, Salmo trutta. Heredity 66 83–91. [Google Scholar]
- Hoar, W. S., 1976. Smolt transformation—evolution, behavior, and physiology. J. Fish. Res. Board Can. 33 1233–1252. [Google Scholar]
- Hoar, W. S., 1988. The physiology of smolting Salmonids, pp. 275–343 in Fish Physiology, edited by W. S. Hoar and D. J. Randall. Academic Press, San Diego.
- Johnsson, J. I., W. C. Clarke and J. Blackburn, 1994. Hybridization with domesticated rainbow trout reduces seasonal variation in seawater adaptability of steelhead trout (Oncorhynchus mykiss). Aquaculture 121 73–77. [Google Scholar]
- Jones, N., H. Ougham and H. Thomas, 1997. Markers and mapping: we are all geneticists now. New Phytol. 137 165–177. [Google Scholar]
- Kao, C.-H., Z. B. Zeng and R. D. Teasdale, 1999. Multiple interval mapping for quantitative trait loci. Genetics 152 1203–1216. [DOI] [PMC free article] [PubMed] [Google Scholar]
- Lander, E., P. Green, J. Abrahamson, A. Barlow and M. Daly, 1987. MAPMAKER: an interactive computer package for constructing primary genetic linkage maps of experimental and natural populations. Genomics 1 174–181. [DOI] [PubMed] [Google Scholar]
- Lynch, M., and B. Walsh, 1998. Genetics and Analysis of Quantitative Traits. Sinauer Associates, Sunderland, MA.
- McCormick, S. D., 1993. Methods for nonlethal gill biopsy and measurement of Na+, K+ -ATPase activity. Can. J. Fish. Aquat. Sci. 50 656–658. [Google Scholar]
- McCormick, S. D., and D. Bradshaw, 2006. Hormonal control of salt and water balance in vertebrates. Gen. Comp. Endocrinol. 147 3–8. [DOI] [PubMed] [Google Scholar]
- McDowall, R. M., 1997. The evolution of diadromy in fishes (revisited) and its place in phylogenetic analysis. Rev. Fish Biol. Fish. 7 443–462. [Google Scholar]
- McPhee, M. V., F. Utter, J. A. Stanford, K. V. Kuzishchin, K. A. Savvaitova et al., 2007. Population structure and partial anadromy in Oncorhynchus mykiss from Kamchatka: relevance for conservation strategies around the Pacific Rim. Ecol. Freshw. Fish 16 539–547. [Google Scholar]
- Moghadam, H. K., J. Poissant, H. Fotherby, L. Haidle, M. M. Ferguson et al., 2007. Quantitative trait loci for body weight, condition factor and age at sexual maturation in Arctic charr (Salvelinus alpinus): comparative analysis with rainbow trout (Oncorhynchus mykiss) and Atlantic salmon (Salmo salar). Mol. Genet. Genomics 277 647–661. [DOI] [PubMed] [Google Scholar]
- Narum, S. R., C. Contor, A. Talbot and M. S. Powell, 2004. Genetic divergence of sympatric resident and anadromous forms of Oncorhynchus mykiss in the Walla Walla River, U.S.A. J. Fish Biol. 65 471–488. [Google Scholar]
- Nichols, K. M., W. P. Young, R. G. Danzmann, B. D. Robison, C. Rexroad et al., 2003. A consolidated linkage map for rainbow trout (Oncorhynchus mykiss). Anim. Genet. 34 102–115. [DOI] [PubMed] [Google Scholar]
- Nichols, K. M., K. W. Broman, K. Sundin, J. M. Young, P. A. Wheeler et al., 2007. Quantitative trait loci x maternal cytoplasmic environment interaction for development rate in Oncorhynchus mykiss. Genetics 175 335–347. [DOI] [PMC free article] [PubMed] [Google Scholar]
- Oakley, T. H., and R. B. Phillips, 1999. Phylogeny of salmonine fishes based on growth hormone introns: Atlantic (Salmo) and Pacific (Oncorhynchus) salmon are not sister taxa. Mol. Phylogenet. Evol. 11 381–393. [DOI] [PubMed] [Google Scholar]
- Olsen, J. B., K. Wuttig, D. Fleming, E. J. Kretschmer and J. K. Wenburg, 2006. Evidence of partial anadromy and resident-form dispersal bias on a fine scale in populations of Oncorhynchus mykiss. Conserv. Genet. 7 613–619. [Google Scholar]
- O'Malley, K. G., T. Sakamoto, R. G. Danzmann and M. M. Ferguson, 2002. Quantitative trait loci for spawning date and body weight in rainbow trout: testing for conserved effects across ancestrally duplicated chromosomes. J. Hered. 94 273–284. [DOI] [PubMed] [Google Scholar]
- Orr, H. A., 1998. Testing natural selection vs. genetic drift in phenotypic evolution using quantitative trait locus data. Genetics 149 2099–2104. [DOI] [PMC free article] [PubMed] [Google Scholar]
- Pascual, M., P. Bentzen, C. R. Rossi, G. Mackey, M. T. Kinnison et al., 2001. First documented case of anadromy in a population of introduced rainbow trout in Patagonia, Argentina. Trans. Am. Fish. Soc. 130 53–67. [Google Scholar]
- Phillips, R. B., M. R. Morasch, P. A. Wheeler and G. H. Thorgaard, 2005. Rainbow trout (Oncorhynchus mykiss) of Idaho and Alaskan origin (2n=58) share a chromosome fusion relative to trout of California origin (2n = 60). Copeia 2005 661–664. [Google Scholar]
- Quinn, T. P., 2005. The Behavior and Ecology of Pacific Salmon and Trout. American Fisheries Society/University of Washington Press, Bethesda, MD.
- Quinn, T. P., and K. W. Myers, 2004. Anadromy and the marine migrations of Pacific salmon and trout: Rounsefell revisited. Rev. Fish Biol. Fish. 14 421–442. [Google Scholar]
- Quinn, T. P., M. J. Unwin and M. T. Kinnison, 2000. Evolution of temporal isolation in the wild: genetic divergence in timing of migration and breeding by introduced chinook salmon populations. Evolution 54 1372–1385. [DOI] [PubMed] [Google Scholar]
- Quinn, T. P., M. T. Kinnison and M. J. Unwin, 2001. Evolution of chinook salmon (Oncorhynchus tshawytscha) populations in New Zealand: pattern, rate, and process. Genetica 112 493–513. [PubMed] [Google Scholar]
- Refstie, T., T. A. Steine and T. Gjedrem, 1977. Selection experiments with salmon. II. Proportion of Atlantic salmon smolting at 1 year of age. Aquaculture 10 231–242. [Google Scholar]
- Riva-Rossi, C., M. A. Pascual, J. A. Babaluk, M. Garcia-Asorey and N. M. Haldenk, 2007. Intra-population variation in anadromy and reproductive life span in rainbow trout introduced in the Santa Cruz River, Argentina. J. Fish Biol. 70 1780–1797. [Google Scholar]
- Roff, D. A., 2007. A centennial celebration for quantitative genetics. Evolution 61 1017–1032. [DOI] [PubMed] [Google Scholar]
- Rohlf, F. J., 2005. a tpsDig2, Digitize Landmarks and Outlines. State University of New York, Stony Brook, NY.
- Rohlf, F. J., 2005. b tpsRelw v. 1.42, Relative Warps Analysis. State University of New York, Stony Brook, NY.
- Rohlf, F. J., and F. L. Bookstein, 2003. Computing the uniform component of shape variation. Syst. Biol. 52 66–69. [DOI] [PubMed] [Google Scholar]
- Rohlf, F. J., and D. Slice, 1990. Extensions of the Procrustes method for the optimal superimposition of landmarks. Syst. Zool. 39 40–59. [Google Scholar]
- Sakamoto, T., R. G. Danzmann, K. Gharbi, P. Howard, A. Ozaki et al., 2000. A microsatellite linkage map of rainbow trout (Oncorhynchus mykiss) characterized by large sex-specific differences in recombination rates. Genetics 155 1331–1345. [DOI] [PMC free article] [PubMed] [Google Scholar]
- Stearley, R. F., 1992. Historical ecology of Salmoninae, with special reference to Oncorhynchus, pp. 622–658 in Systematics, Historical Ecology, and North American Freshwater Fishes, edited by R. L. Mayden. Stanford University Press, Stanford, CA.
- Stearley, R. F., and G. R. Smith, 1993. Phylogeny of the Pacific trout and salmon (Oncorhynchus) and genera of the family Salmonidae. Trans. Am. Fish. Soc. 122 1–33. [Google Scholar]
- Stockwell, C. A., A. P. Hendry and M. T. Kinnison, 2003. Contemporary evolution meets conservation biology. Trends Ecol. Evol. 18 94–101. [Google Scholar]
- Tchenavin, V., 1939. The origin of salmon. Salmon Trout Magazine 95 1–21. [Google Scholar]
- Thorpe, J. E., 1994. An alternative view of smolting in salmonids. Aquaculture 121 105–113. [Google Scholar]
- Thorpe, J. E., and N. B. Metcalfe, 1998. Is smolting a positive or a negative developmental decision? Aquaculture 168 95–103. [Google Scholar]
- Thorpe, J. E., M. Mangel, N. B. Metcalfe and F. A. Huntingford, 1998. Modelling the proximate basis of salmonid life-history variation, with application to Atlantic salmon, Salmo salar L. Evol. Ecol. 12 581–599. [Google Scholar]
- Thrower, F. P., J. J. Hard and J. E. Joyce, 2004. Genetic architecture of growth and early life-history transitions in anadromous and derived freshwater populations of steelhead. J. Fish Biol. 65 286–307. [Google Scholar]
- Unwin, M. J., T. P. Quinn, M. T. Kinnison and N. C. Boustead, 2000. Divergence in juvenile growth and life history in two recently colonized and partially isolated chinook salmon populations. J. Fish Biol. 57 943–960. [Google Scholar]
- Visscher, P. M., R. Thompson and C. S. Haley, 1996. Confidence intervals in QTL mapping by bootstrapping. Genetics 143 1013–1020. [DOI] [PMC free article] [PubMed] [Google Scholar]
- Yang, R. Q., Q. Tian and S. Z. Xu, 2006. Mapping quantitative trait loci for longitudinal traits in line crosses. Genetics 173 2339–2356. [DOI] [PMC free article] [PubMed] [Google Scholar]
- Young, W. P., P. A. Wheeler, V. H. Coryell, P. Keim and G. H. Thorgaard, 1998. A detailed linkage map of rainbow trout produced using doubled haploids. Genetics 148 839–850. [DOI] [PMC free article] [PubMed] [Google Scholar]
- Zeng, Z. B., 1994. Precision mapping of quantitative trait loci. Genetics 136 1457–1468. [DOI] [PMC free article] [PubMed] [Google Scholar]