Abstract
We previously showed that the content of advanced glycation end products (AGEs) in the diet correlates with serum AGE levels, oxidant stress (OS), organ dysfunction, and lifespan. We now show that the addition of a chemically defined AGE (methyl-glyoxal-BSA) to low-AGE mouse chow increased serum levels of AGEs and OS, demonstrating that dietary AGEs are oxidants that can induce systemic OS. OS predisposes to the development of cardiovascular and chronic kidney diseases; calorie restriction (CR) is the most studied means to decrease OS, increase longevity, and reduce OS-related organ damage in mammals. Because reduction of food intake also decreases oxidant AGE s intake, we asked whether the beneficial effects of CR in mammals are related to the restriction of oxidants or energy. Pair-fed mice were provided either a CR diet or a high-AGE CR diet in which AGEs were elevated by brief heat treatment (CR-high). Old CR-high mice developed high levels of 8-isoprostanes, AGEs, RAGE, and p66shc, coupled with low AGER1 and GSH/GSSG levels, insulin resistance, marked myocardial and renal fibrosis, and shortened lifespan. In contrast, old CR mice had low OS, p66shc, RAGE, and AGE levels, but high AGER1 levels, coupled with longer lifespan. Therefore, the beneficial effects of a CR diet may be partly related to reduced oxidant intake, a principal determinant of oxidant status in aging mice, rather than decreased energy intake.
The postulated mechanisms of senescence and aging in organisms from yeast to mammals include environmental and genetic factors, elevated oxidant stress (OS), cumulative DNA damage, altered gene expression, telomere shortening, and energy utilization.1,2,3 Calorie restriction (CR), via restriction of food intake, is the principal nongenetic or environmental intervention that prevents these processes and extends lifespan without significant side effects.4,5 Although the mechanism(s) of CR are complex, the prevention of OS and maintenance of antioxidant reserves are common features.1,2,6,7 The beneficial effects of lowering OS on lifespan have been shown with anti-oxidant mimetics or genetic models of extended lifespan, ie, loss-of-function mutations of the GH/IGF-1 axis,8,9 of p66Shc10 and the FOXO transcription factors,11 as well as overexpression of catalase.12,13
Although the formation of oxidants is a part of normal metabolism, their excess causes inflammation and organ injury, compromises healthspan, and shortens lifespan.14,15 Oxidants may be derived from endogenous sources, ie, hyperglycemia16,17 or exogenous sources, namely the diet.18,19,20 Heat exposure of animal and human food is an important generator of variable amounts of glycoxidants, or advanced glycation end products (AGEs).19,21 The levels of carboxy-methyl-lysine (CML), a common AGE,16,22 directly correlate with the levels of other protein or lipid AGEs, ie, methyl-glyoxal (MG)23 or lipid oxidation malonyl-dialdehyde derivatives in food.21 Thus, CML has been used as a surrogate AGE marker in foods, as well as in tissues and fluid spaces of man and animals.18,19,21,24 Because AGEs increase cellular OS, AGEs are recognized as pro-oxidant substances.16,17,25 Dietary AGEs contribute to increased systemic levels of AGEs and inflammatory modulators in humans and experimental animals.18,26,27,28 Lowering the intake of AGEs by restricting the heat-processing of standard chow fed to normal mice reduces circulating and tissue AGE levels and systemic OS, resulting in preservation of antioxidant reserves and decreased levels of inflammatory cytokines.26,29,30,31,32 These findings also apply to patients with chronic kidney disease or diabetes.24,27,28 Other studies of aging-related diseases in experimental animal models show that an AGE-reduced, isocaloric diet provides protection from insulin resistance and diabetes as well as cardiovascular and chronic kidney disease.26,29,30,31,32 The mechanisms that may underlie these effects are thought to include decreased levels of OS regulatory components, ie, p66shc10 and RAGE,25 and increased anti-OS AGE-receptor-1 (AGER1),33,34 resulting in an improved net anti-oxidant homeostasis.26
Others have shown that the restriction of calories (CR) in rats results in a reduced consumption of dietary AGEs as an obligate accompaniment of reduced food intake.35 This unintended consequence may be of clinical relevance, because an ∼50% decrease in dietary oxidants led to a reduction in oxidant load and tissue damage as well as an increase in lifespan.26 However, none of the previous studies demonstrated 1) a direct role in CR for specific AGEs, 2) that feeding a CR diet results in lower levels of AGE consumption, or 3) that a CR diet containing AGE levels similar to those of a regular diet may significantly modify the benefits of CR. We addressed these questions in normal aging mice that were pair-fed a CR diet or an identical CR diet in which the content of AGEs was increased by brief heat treatment, similar to that used in preparation of the regular diet.
We report that AGEs in food are a significant contributor to OS, by showing that addition of a chemically purified AGE to mouse chow markedly increases OS in normal mice. In addition, we show that the reduction of food consumption in a CR diet implicitly restricts the consumption of AGEs, leading to lower OS and increased healthspan. Finally, we demonstrate that a CR diet that is AGE-supplemented, so that consumption of AGEs is no longer restricted, results in high OS, accelerated aging-related cardiovascular/renal disease, and a shorted lifespan. The findings demonstrate that the oxidant content of the calorie-restricted diet, as well as the normal mouse chow diet, may be a major determinant of oxidant status in both young and aged animals.
Materials and Methods
Animals and Diets
AGE-Supplemented Diet: 6-Month Study
Previous studies in animals on the effect of dietary AGEs were based on correlations between measurements of CML-like AGEs in a standard chow diet (Table 1), and the corresponding levels of CML in serum and tissues. In the current study a chemically defined AGE, MG-BSA prepared as previously described,21 was directly added to a low-AGE diet, which had been prepared with reduced exposure to heat.26,30,31 The levels of protein and lipid-associated MG-derivatives, as well as CML, a terminal glycoxidation product, were increased (Table 1). Dams fed the Low diet were maintained on the same diet during gestation, and groups of their pups (n = 15 per group, 7 males and 8 females) were pair-fed one of three diets at weaning (Table 1): 1) regular mouse chow (Reg), 2) a low-AGE mouse chow (Low),26 or 3) Low diet to which MG-BSA (1 mg/g food) had been added (Low + MG), followed by air-drying. All food was consumed between feedings.
Table 1.
Characteristics of Dietary Formulas
| Groups | Reg*† | Low | Low + MG* | CR† | CR-high† |
|---|---|---|---|---|---|
| Protein (g) % | 19 | 20 | 20 | 19 | 19 |
| Fat (g) % | 4.5 | 4.5 | 5 | 4.4 | 4.5 |
| Carbohydrates (g) % | 56 | 55 | 55 | 55 | 55 |
| Calories (kcal/g) | 4 | 4 | 4 | 4 | 4 |
| CML (U/g) | 6 × 10⁴ | 3.4 × 10⁴ | 6.4 × 10⁴ | 6.2 × 10⁴ | 17.4 × 10⁴ |
| MG (nmol/g) | 0.3 × 10⁴ | 0.14 × 10⁴ | 0.38 × 10⁴ | 0.28 × 10⁴ | 0.45 × 10⁴ |
| Lipid-CML (U/g) | 0.03 × 10⁴ | 0.02 × 10⁴ | 0.02 × 10⁴ | 0.026 × 10⁴ | 0.046 × 10⁴ |
| Lipid-MG (nmol/g) | 6.3 | 5 | 9 | 6 | 11 |
Six-month study;
chronic study.
Reg, regular diet; low, low-AGE diet; low + MG, MG-supplemented low-AGE diet; CR, calorie restricted; CR-high, CR with increased AGEs.
CR Diets: Long-Term Studies
C57BL/6 mice (n = 66, male, 4 months of age) from the National Institutes on Aging CR colonies were individually caged and provided free access to water. Mice were assigned to one of three diets (n = 22 per group): A) a modified version of NIH-31 calorie-deficient (40% calorie reduction) diet, which was balanced in minerals and vitamins (CR)1,2; B) the same CR diet, in which the content of AGEs was increased by extending heat exposure (by 15 minutes. at 120°C) (CR-high); and C) The NIH-31 open formula diet (Reg) (Harlan Teklad, Madison, WI) (Tables 1 and 2). Diets were purchased in small amounts (<5 kg) and kept at 4°C. Food consumption was monitored daily for the first 4 weeks, and weekly thereafter (Table 2). After establishing the daily intake in the CR and Reg mice, the CR and CR-high were pair-fed. Food was completely consumed by the mice between feedings throughout the study. Body weight was monitored biweekly during the first 3 months and then monthly. These mice were used for survival curves.
Table 2.
Daily Dietary Intake
| Groups | Reg*† | Low | Low + MG* | CR† | CR-high† |
|---|---|---|---|---|---|
| Food (g/day) | 5 | 4.8 | 5 | 3 | 3 |
| Calories (kcal/day) | 20 | 20 | 20 | 12 | 12 |
| CML (U/day) | 30 × 104 | 17 × 104 | 32 × 104 | 19 × 104 | 52 × 104 |
| MG (nmol/day) | 1.3 × 10⁴ | 0.7 × 10⁴ | 1.9 × 10⁴ | 0.8 × 10⁴ | 1.4 × 10⁴ |
| CML-lipid (U/day) | 0.1 × 10⁴ | 0.09 × 10⁴ | 0.1 × 10⁴ | 0.08 × 10⁴ | 0.14 × 10⁴ |
| MG-lipid (nmol/day) | 31 | 25 | 45 | 17 | 33 |
Six-month study;
chronic study.
Reg, regular diet; low, low-AGE diet; low + MG, MG-supplemented low-AGE diet; CR, calorie restricted; CR-high, CR with increased AGEs.
A parallel cohort of male, 4-month-old C57BL/6J mice, divided into the same three groups (n = 20 per group), was used for serial blood and glucose tolerance testing or were sacrificed at intervals for blood and tissue studies. At sacrifice, tissue segments were placed in 2% freshly prepared paraformaldehyde in PBS or were snap-frozen at −80°C. Mice were maintained in a pathogen-free environment, with the room temperature maintained at 72° F, 50% humidity, and 12:12-hour light:dark cycles, at the Center for Laboratory Animal Science, Mount Sinai School of Medicine. Sentinel mice in the same room were tested every 3 months and found to be seronegative for pneumonia virus of mice (PVM); mouse hepatitis virus (MHV); mouse minute virus (MVM); lymphocytic choriomeningitis virus (LCMV); mouse adeno virus (MAV), and Sendai virus, and also tested negative for parasites (pinworm) and other routine pathogens. All experimental procedures complied with the Guide for the Care and Use of Laboratory Animals (Department of Health, Education, and Welfare, publication no. NIH 78-23, 1996).
Measurement of AGEs
The concentrations of AGEs in sera, heart, kidney, urine, and diets were determined by enzyme-linked immunosorbent assay, using well characterized monoclonal antibodies for CML-like epitopes (4G9; Alteon, Northvale, NJ) and for MG derivatives (3D11).18,19,21,24,26 We used three reference standards, characterized by HPLC/GC-MS, a glucose-modified BSA standard containing 36 modified lys/mol, a synthetic CML-BSA containing 23 modified lys/mol, and a MG-BSA standard containing 22 MG-modified arginines/mol. CML immunoreactivity (using the 4G9 mAb) correlated with MG-immunoreactivity (based on 3D11 mAb) in vitro21 and in vivo.27 Unless otherwise stated, AGE values in the chronic study are based on CML measurements, consistent with our previous studies.18,19,24,26,27,28,29,30,31,32
Metabolic Studies
At 16 and 112 weeks of age, an intraperitoneal glucose tolerance test (5% dextrose solution; 2 mg/g body wt) was performed in the serial sacrifice cohort from each dietary group (n = 5), after an overnight fast.26,29,30 Blood was sampled before and at intervals between 5 and 120 minutes after glucose infusion. Glucose levels were determined with an Elite glucometer (Bayer, Mishawaka, IN) and serum insulin levels were determined by enzyme-linked immunosorbent assay (Ultra-Sensitive mouse insulin kit; Alpco Diagnostics, Windham, NH).
Glutathione (GSH), Oxidized Glutathione (GSSG), and 8-Isoprostane Studies
Blood was collected via cardiac puncture at 16 and 112 weeks of age from five animals in each diet group from the serial sacrifice cohort. GSH and GSSG were analyzed colorimetrically (OxisResearch, Portland, OR) using the manufacturer’s recommendations and quantified by an enzyme-linked immunosorbent assay reader (412 nm).26,29 Endogenous lipid peroxidation products (8-isoprostanes or 8-epi-PGF2α) were determined in fresh plasma samples, using an enzyme immunoassay kit, which correlates with values determined by GC-MS (Cayman Chemical, Ann Arbor, MI).26,29
Urinary AGEs, Creatinine, and Albumin
Urinary AGEs, albumin, and creatinine excretion were evaluated at 16 and 112 weeks of age. Urinary creatinine and albumin were measured using a DCA 2000 microalbumin/creatinine reagent cartridge with DCA 2000 analyzer (Bayer Corp., Elkhart, IN). The urinary albumin:creatinine ratio and the excretion of AGEs were calculated from aliquots of 24-hour urine samples collected from each group (n = 5).32
Western Blot Analysis
Equal amounts of protein extracts from heart and kidney tissues were separated on 10% or 8% sodium dodecyl sulfate-polyacrylamide gels and transferred to nitrocellulose membranes.26,34 The membranes were blocked in TTBS (Tris-buffered saline with 0.1% Tween 20) containing 5% powdered milk for 1 hour. Primary antibody incubations were performed in TTBS with 5% powdered milk overnight at 4°C. After washing, the membranes were incubated with the appropriate secondary peroxidase-conjugated antibody for 1 hour in TTBS. Proteins were visualized using the enhanced chemiluminescence system from Roche, Nutley, NJ. For reprobing, blots were stripped with a buffer containing 50 mmol/L Tris-HCl, pH 6.8, 2% sodium dodecyl sulfate, and 0.1 mol/L β-mercaptoethanol and probed with a second primary antibody. Antibodies: anti-Shc from BD Biosciences Transduction Laboratories (San Jose, CA), anti-MnSOD from Stressgen Biotechnologies (Victoria, Canada), and anti-phospho-Thr-32-FKHRL1 from Upstate Biotechnology, Inc. (Lake Placid, NY).
Histology
Kidney
Specimens obtained at 16 and 112 weeks (n = 5) in the serial sacrifice cohort were fixed in 10% buffered formalin and embedded in paraffin. Sections, stained by periodic acid-Schiff were used to assess glomerulosclerosis.26,31,32
Heart
The heart was immersion-fixed in 10% buffered formalin and cross-sections taken at the mid-ventricular level were embedded in paraffin. Sections were stained with Sirius Red to reveal connective tissue.31,32
Statistics
Survival curves were calculated by the Kaplan-Meier method and statistical differences between these curves were evaluated by the log rank test. Analysis of weight and serum AGEs at indicated time points were performed by one-way analysis of variance followed by Bonferroni’s multiple comparisons test. Data are shown as mean ± SEM. P values <0.05 were defined as significant.
Results
AGE-Supplemented AGE Diet: 6-Month Study
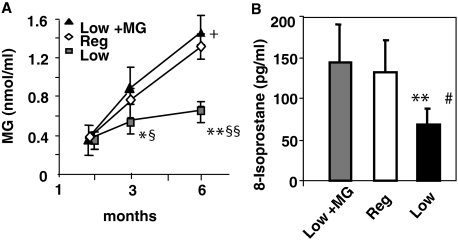
The MG-supplemented diet (Low + MG) was identical to the Low diet, except for the anticipated higher content in MG-derived AGEs (Table 1). As previously noted,36 litters from mothers fed a Low diet had lower baseline serum AGE levels than litters from dams fed the Reg diet during gestation (Reg-Fo, serum MG 1.2 ± 0.4 nmol/ml; Low-Fo, MG 0.6 ± 0.2 nmol/ml). Serum MG derivatives in the Low + MG and the Reg mice were three- to fourfold increased above baseline levels at 6 months, whereas the levels in the Low group did not differ from baseline values (Figure 1A). The levels of plasma 8-isoprostanes were also twofold elevated in the Reg and Low + MG groups (Figure 1B), whereas serum CML levels increased by threefold (baseline: 11 ± 2 U/ml, and at 6 months: Reg: 37 ± 7 U/ml, Low + MG: 43 ± 13 U/ml, Low: 23 ± 12 U/ml; Reg and Low + MG versus Low, P < 0.01, respectively) reflecting the higher systemic oxidants in these mice. Thus, AGEs in the diet are a direct contributor to systemic levels of AGEs and OS in young mice. There were no differences in body weight during this short-term follow-up study.
Figure 1.
Serum AGEs and OS in MG-supplemented diet, a 6-month study. Pups, from dams fed a low-AGE diet, were pair-fed either a Low diet, a Low + MG, or a Reg diet at weaning, for 6 months. A: Serum MG levels are shown as means ± SEM of triplicate values. Low versus Reg, *P < 0.05; **P < 0.001; Low versus Low + MG, §P < 0.01, §§P < 0.001; Low + MG versus Reg, +P < 0.05. B: 8-isoprostane levels. Low versus Low + MG, **P < 0.01; Low versus Reg, #P < 0.01.
AGE Intake and Body Weight in CR Mice, Chronic Study
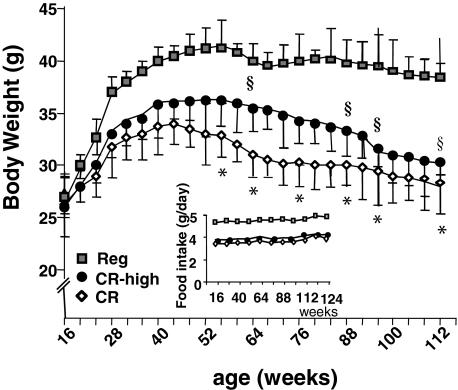
The nutrient and micronutrient composition between the two CR diets and the regular diet was identical. The sole difference between the CR diets was the brief heating step in the CR-high diet, which increased CML and MG levels (Table 1).26,30,31,32,37 Calorie intake in both CR groups was 12 kcal/day (∼40% restriction) compared to that in the Reg group (19 kcal/day) and remained stable throughout the study in all groups (Table 2). The reduced food intake resulted in an ∼45% lower consumption of protein, and fat-associated dietary AGEs by the CR mice than the Reg mice. In contrast, the total intake of AGEs by the CR-high mice was ∼2-fold greater than in the CR mice, and 1.8-fold greater than in the Reg mice. The levels in this diet, although high, are less than in the usual Western diet.
Body weight in both CR groups remained lower than in the Reg mice throughout the study (Figure 2) and continued to decline after 53 weeks, whereas the Reg mice maintained their highest achieved adult weight throughout the study (>24 months). After 56 weeks of age, the CR-high mice tended to have a higher body weight throughout much of their adult life than did pair-fed CR mice, despite an identical energy intake in the two CR groups.
Figure 2.
Body weight, chronic study. Mice were pair-fed a CR diet, a CR-high diet, or regular diet (Reg) for life (n = 22 per group) as per Table 1. Food intake (g/day) is shown in the inset. Data are shown as means ± SEM. CR versus Reg, *P < 0.001; CR-high versus Reg, §P < 0.01.
Serum and Tissue AGEs
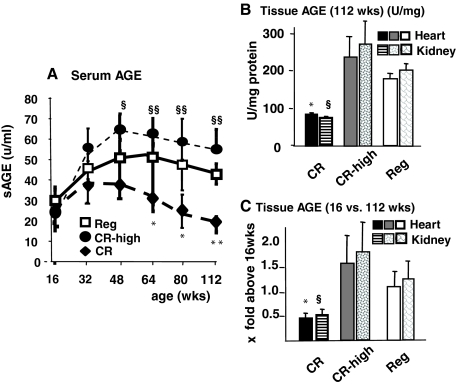
The differences in the dietary content of AGEs were reflected in the serum and tissue AGE levels of the three cohorts (Figure 3, A–C). By ∼50 weeks of age, serum AGE levels in the CR-high mice were significantly higher than in the CR group from 48 weeks to the end of the study despite a restricted calorie intake (Figure 3A). A similar pattern was observed in tissue AGE levels in cohorts sacrificed at 16 and 112 weeks of age (Figure 3, B and C). Tissue AGE levels were three- to sixfold higher in old CR-high than in CR mice (Figure 3, B and C). Thus, the increased content of AGEs in a CR-high diet resulted in high AGE levels, similar to those found in Reg old mice fed an unrestricted diet.26
Figure 3.
Serum and tissue AGE levels, chronic study. A: Serum AGEs in mice exposed to Reg, CR, or CR-high diet (n = 20 per group). CR versus Reg, *P < 0.05, **P < 0.01; CR versus CR-high, §P < 0.05; §§P < 0.001. B: Heart and kidney tissue AGE levels were assessed at 16 and 112 weeks of age (n = 8 per group). CR versus Reg, *P < 0.05; CR versus CR-high, §P < 0.001. C: Heart and kidney AGE levels, shown as x-fold above baseline (16 weeks old) (n = 5 per group). Data are shown in means ± SEM. CR versus Reg, *P < 0.05; CR versus CR-high, §P < 0.001.
Glucose and Insulin Metabolism
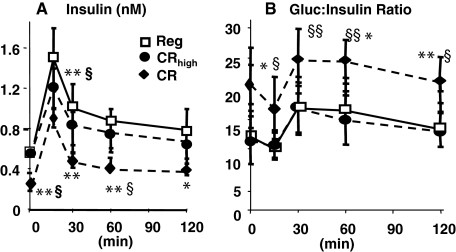
We previously showed that aging mice pair-fed the Reg diet were insulin resistant and retained more body mass than aging mice fed a diet with a low AGE content.26 In the current study, 112-week-old CR-high and Reg mice had higher fasting insulin levels than CR mice (Table 3), and these changes were associated with an impaired insulin response to a glucose challenge and a blunted glucose:insulin ratio (GIR) (Figure 4, A and B). In contrast, 112-week-old CR mice had nearly normal insulin levels and response to glucose challenge. Insulin levels returned to baseline levels within 30 minutes, and the GIR was normal (twofold higher than in CR-high or Reg mice).
Table 3.
Changes in Fasting Plasma Glucose and Insulin Levels with Aging
| Groups | 16 weeks old
|
112 weeks old
|
||
|---|---|---|---|---|
| Glucose (mmol/L) | Insulin (nmol/L) | Glucose (mmol/L) | Insulin (nmol/L) | |
| CR | 6.8 ± 1.1 | 0.19 ± 0.07 | 6.2 ± 0.5 | 0.3 ± 0.04*† |
| CR-high | 6.8 ± 0.9 | 0.16 ± 0.06 | 6.6 ± 1.3 | 0.56 ± 0.2* |
| Reg | 6.4 ± 0.5 | 0.18 ± 0.07 | 6.1 ± 0.7 | 0.53 ± 0.12* |
Fasting plasma glucose levels: P = NS between dietary or age groups. Fasting insulin levels: 16-week-old versus 112-week-old mice in each dietary group: *P < 0.05. At 112 weeks: CR versus Reg:
P < 0.05; CR versus CR-high:
P < 0.01, (n = 8 per group).
Figure 4.
Insulin response to glucose challenge, chronic study. At 112 weeks, an intraperitoneal glucose tolerance test was performed in each group of mice (n = 6 per group). A: Insulin levels. B: GIR. Data are shown in means ± SEM. CR versus Reg, *P < 0.01, **P < 0.01; CR versus CR-high, §P < 0.05, §§P < 0.01.
Plasma 8-Isoprostanes and the GSH:GSSG Ratio
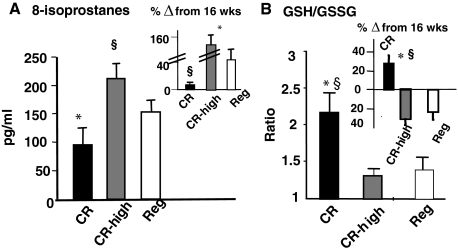
A reduction of dietary AGEs has been shown to prevent increased OS and age-related kidney lesions.26,32 However, the effect of CR, with or without an elevated intake of AGEs, on serum and cellular markers of OS in aging mice has not been explored. Endogenous lipid oxidants, ie, 8-isoprostanes, were more than twofold higher in CR-high and Reg mice than in CR mice at 112 weeks (Figure 5A). Although plasma 8-isoprostanes were slightly increased with age in the Reg group (Figure 5A, inset), in the CR-high mice they were three- to fourfold increased above the 16-week levels. Therefore, we examined intracellular GSH/GSSG in freshly isolated blood cells from each group to assess the handling of excess OS in these groups with aging. GSH:GSSH ratios at 112 weeks were approximately twofold higher in CR mice than in age-matched CR-high or Reg mice (Figure 5, A and B). In addition, this ratio did not diminish with age in CR mice, but was ∼30% higher at 112 weeks than at the 16-week baseline level (Figure 5B, inset). In contrast, the GSH:GSSG ratio in 112-week CR-high and Reg mice was reduced by ∼25 to 40% below their respective baseline (16 weeks) levels. The levels of GSH was lower in the CR-high mice (103.4 ± 28.1 mmol/L) (P < 0.01) than in the Reg (152.7 ± 5.2 mmol/L) or the CR (199.5 ± 16.4 mmol/L). There were no differences in the levels of GSSG between the dietary groups at 28 months of age. These data indicated that there was significant depletion of cellular antioxidant reserves in old mice fed a diet restricted in calories but not restricted in AGEs.
Figure 5.
OS indicators, chronic study. A: Plasma levels of isoprostane 8-epi-PGF2α (pg/ml) at 112 weeks are shown as means ± SEM (n = 6 per group). CR versus CR-high, *P < 0.001, CR-high versus Reg, §P < 0.001. Inset: Changes from 16 weeks are shown as percent of basal values, CR versus CR-high, *P < 0.001; CR-high versus Reg, §P < 0.01. B: Whole blood GSH:GSSG ratio at 112 weeks, shown as means ± SEM (n = 6 per group). Inset: Changes from 16 weeks are shown as percent of basal. CR versus Reg, §P < 0.01; CR versus CR-high, *P < 0.001.
AGE Receptors and p66shc
The levels of some of the AGE receptors involved in the regulation of AGEs and OS, AGER1 and RAGE, were found to be altered during aging in mice fed an AGE-restricted diet,26 but this has not been previously explored in CR. AGER1 protein levels increased by twofold in heart (Figure 6A) and kidney tissue (data not shown) from 112-week-old CR mice, compared to 16-week-old mice, but no change was found in old CR-high or Reg mice. RAGE expression in CR mice, although higher at 112 weeks relative to 16 weeks, was significantly lower than in the Reg (by ∼50%) and CR-high (by ∼60%). RAGE expression in CR-high, as well as in Reg mice was ∼3.5-fold higher at 112 weeks, than at 16 weeks of age (Figure 6B, inset). Thus, AGER1 expression in aging mice increased under CR, but decreased under CR-high and Reg diet. In contrast, RAGE expression followed a pattern opposite to AGER1 under the same diets.
Figure 6.
AGER1 and RAGE expression, chronic study. Western blot analyses of soluble extracts from myocardium, at 16 weeks (baseline) and 112 weeks (n = 6 per group). A: AGER1 expression; CR-high, 112 versus 16 weeks old, *P < 0.05; CR-high, 112 weeks old versus CR 112 weeks old, §P < 0.05. Densitometry data from five blots per group are shown as AGER1 to β-tubulin ratio (means + SEM). B: RAGE expression; Reg, CR and CR-high, 112 weeks old versus 16 weeks old, *P < 0.05; CR-high versus CR at 112 weeks, §P < 0.05. Densitometry data from five blots per group are expressed as the ratio (means + SEM) of RAGE to β-tubulin.
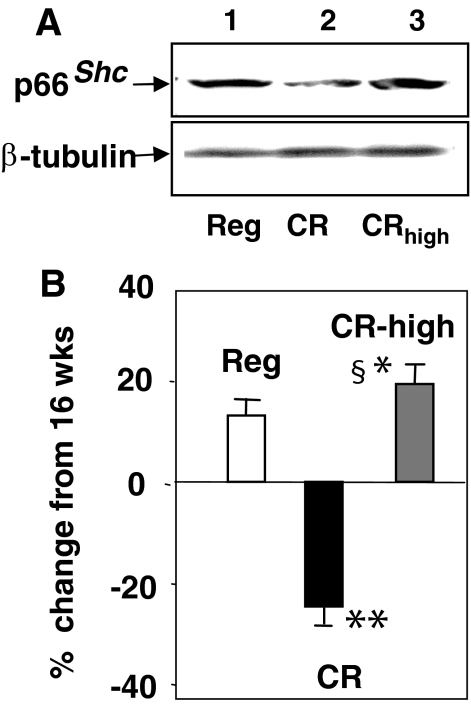
Elevated p66shc tissue levels have been implicated in increased OS, cell and tissue injury,10,38 and decreased lifespan.38,39 We found that p66shc protein expression was reduced in 112-week-old CR mice (Figure 7A, lane 2), but was increased in CR-high, as was in Reg mice, with the highest levels being in the former. Compared to the 16 weeks CR, p66shc levels in 112-week-old CR mice were 25% lower (Figure 7B). This contrasted with the ∼15 to 20% increase above baseline (16 weeks) in p66shc levels of 112-week-old CR-high and Reg mice (Figure 7B).
Figure 7.
p66shc expression in heart tissue, chronic study. A: Western blot analyses of hearts at 112 weeks showing higher levels of expression in CR-high mice than in CR or Reg mice (n = 5 per group). Similar levels were found in kidney tissues (n = 5 per group). B: Densitometry data from five blots per group, shown as the ratio (means + SEM) of p66shc to β-tubulin protein expression at 112 weeks versus 16 weeks (baseline). CR versus CR-high, +P < 0.001; CR versus Reg, *P < 0.05; CR-high versus Reg, §P < 0.05.
Urinary Albumin and AGE Excretion
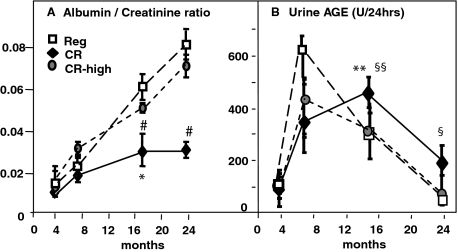
The albumin excretion rate was only slightly increased in CR mice as they aged (Figure 8A). The albumin excretion rate increased at an early time point (24 weeks) in the CR-high and Reg mice, and continued to increase with aging. The urinary AGE excretion increased at an early time point and up to 8 months in the CR-high and Reg mice, consistent with their higher AGE intake (Figure 8B). However, between 16 and 24 months AGE excretion was markedly decreased in these two groups of mice, suggesting that the ability of the kidney to excrete AGEs was already impaired and progressively worsened. In contrast, AGE excretion in CR mice rose less rapidly, consistent with the lower AGE intake, but continued to rise for up to 16 months, and remained higher than CR-high and Reg mice thereafter. This suggests that renal AGE-excretory capacity was less impaired in CR, compared to CR-high and Reg mice, with aging.
Figure 8.
Urinary albumin and AGE excretion, chronic study. A: Albumin:creatinine ratio was estimated based on 24-hour urine collections (n = 6 mice per group). Data are shown as means + SEM of triplicate values. CR versus Reg, *P < 0.05, **P < 0.01; CR versus CR-high, #P < 0.05. B: Urinary AGEs were measured in the same aliquots used for Alb/Cr excretion. CR versus Reg and CR-high, **P < 0.01; CR versus Reg and CR-high, §P < 0.05.
Histology of Kidney and Heart
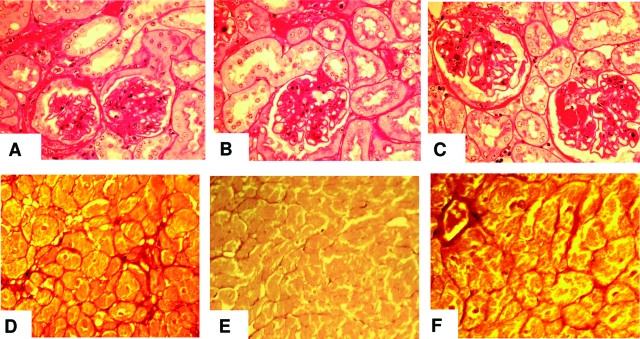
The histological changes in the kidney paralleled the proteinuria and kidney AGE levels in all three diet groups (Figure 9, A–C). The glomerular changes in 112-week-old CR mice were modest consisting of scattered areas of tubulointerstitial fibrosis, associated with tubular atrophy (Figure 9B). Both glomerular and tubulointerstitial sclerosis were moderately severe in old Reg mice (Figure 9A), and although the lesions were more pronounced in the CR-high mice (Figure 9C), these two groups were otherwise similar.
Figure 9.
Kidney and heart histology, chronic study. A–C: Periodic acid-Schiff-stained kidney cortical sections at 26 months of age (n = 5 per group). A: Reg: moderate glomerular and tubulointerstitial sclerosing changes. B: CR: scattered areas of interstitial fibrosis and tubular atrophy. The glomeruli were of normal size, but had recognizable sclerotic changes. C: CR-high: enlarged glomeruli and diffuse glomerular sclerosis, with tubular and interstitial changes more marked than CR mice. D–F: Sirius Red-stained coronal mid-ventricular sections (n = 5 mice/group), at 26 months. D: Reg: bands of connective tissue, concentrated near blood vessels; E: CR: no increase in connective tissue; F: CR-high: diffuse increase in connective tissue bands in the perivascular regions and fine bundles that surround irregularly enlarged bundles of myocytes. Original magnifications, ×250.
As previously noted5,40 and in keeping with the low AGE levels in heart tissue of CR mice, cross sections of the ventricles of old CR mice revealed preservation of the normal architecture relative to those of Reg and CR-high mice (Figure 9, D–F). Namely the myocytes were normal in appearance, uniform in size, and there was no increase in interstitial connective tissue (Figure 9E).40 However, CR-high mice had diffuse, fine filamentous subendocardial bundles of collagen fibrils, visualized with Sirius Red staining, that isolated and compartmentalized the cardiomyocytes (Figure 9F). There was also an increase in the size of individual myocytes, and hyaline changes in the cytoplasm. These changes involved nearly one-third of the thickness of the left ventricle of aged CR-high mice, and were similar, but less marked, in the old Reg mice (Figure 9D). These changes were in line with the significant increase in tissue AGEs in these two groups of mice (Figure 3, B and C).
Survival
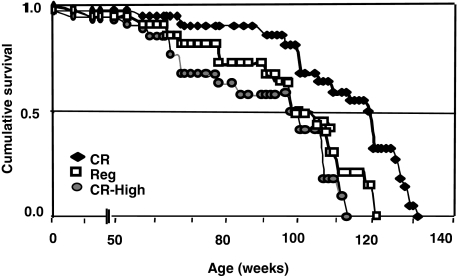
Lifespan in CR mice was longer (median and maximal survival 13.2% and 6%, respectively) than in Reg or CR-high mice (P < 0.001) (Figure 10 and Table 4). In addition, survival in CR-high mice was shorter than in Reg (P < 0.02) mice. At the median survival of CR-high mice, 65% of CR mice were alive, and at the maximal survival level of CR-high mice, 30% of CR mice were still alive (Figure 10 and Table 4).
Figure 10.
Survival, chronic study. Kaplan-Meier survival curves in Reg mice (open squares), CR mice (filled triangles), and CR-high mice (filled circles) (n = 22 per group). Lifespan of Low and CR groups was significantly longer than in Reg (P < 0.004) and CR-high groups (P < 0.0001). Lifespan in CR-high mice was significantly shorter than in Reg (P < 0.02), CR (P < 0.001). Differences between the curves were estimated by the log rank test (see Table 3 for detailed analyses).
Table 4.
Survival
| Confidence intervals for the median | |||||||
| 1. CR-high: Median 120.5, 95% confidence interval: 106–126 | |||||||
| 2. CR-high: Median 105, 95% confidence interval: 79–111 | |||||||
| 3. REG: Median 108, 95% confidence interval: 100–117
| |||||||
| Percentiles
|
Max
|
90%
|
75%
|
50%
|
25%
|
mean ± SE
|
Logrank
|
| Median | |||||||
| 1 = CR | 131 | ∼129 | 127 | 120.5 | 106 | 114.0 ± 3.5 | −7.9 |
| 2 = CR-high | 115 | ∼112 | 111 | 105 | 79 | 95.4 ± 4.4 | 12.1 |
| 3 = REG | 121 | ∼120 | 117 | 108 | 89 | 102.7 ± 4.2 | 6.9 |
| P values* | |||||||
| P values unadjusted for multiple comparisons | |||||||
| CR-high versus CR | <0.001 | ||||||
| CR versus Reg | 0.004 | ||||||
| CR-high versus Reg | 0.02 | ||||||
| P values adjusted for multiple comparisons (Bonferroni) | |||||||
| CR-high versus CRT | <0.01 | ||||||
| CR-high versus Reg | 0.12 | ||||||
| CR versus Reg | 0.024 | ||||||
The unadjusted P values are based on pairwise application of the logrank test.
Discussion
The major benefits of energy restriction in experimental models of CR are not related to any of the nutrients and have been attributed to reduced OS.1,2,3 Reducing food intake also decreases the intake of oxidants, such as AGEs.35 We previously found that the amount of AGEs in the diet of mice directly correlates with serum and tissue AGE levels, markers of inflammation, and the severity of age-related diseases.26,30,31,32 Because these studies did not directly link specific AGEs with changes in circulating AGEs or markers of inflammation, we supplemented a low-AGE diet with a structurally distinct MG-derived AGE with known cytotoxicity,41 present in vivo and in foods,21,23 and administered it to young F1 mice derived from mothers fed a low-AGE diet. These pups had low OS and AGE levels at birth and were apparently healthy. However, after consuming the MG-enriched diet, they developed increased levels of serum MG-derivatives and OS, reaching values that were indistinguishable from littermates fed a regular diet. Thus, the presence of certain AGEs in the diet is an important determinant of the in vivo levels of AGEs and OS. This is the first evidence that the amount of AGEs added to the diet directly affects the levels of serum AGEs and the levels of native lipid peroxides that contribute to OS. In the long term, these levels are associated with fixed organ lesions associated with aging.5,6,40,42 The reduced basal level of AGEs in F1 mice was attributable to low levels of AGEs in the Low-Fo dams.36 This suggests that higher levels of oxidant AGEs in offspring of Reg-Fo dams may be attributable to placental transmission from mothers with high AGE levels. These high intrauterine AGE levels may predispose the offspring to the development of chronic inflammation and diseases in adulthood, such as insulin resistance and diabetes.43
Recent studies have indicated that mouse diets, although well balanced nutritionally, expose mice to a 5- to 10-fold higher AGE load throughout their life time, on a body weight basis, than are present in the human diet.18,21,24,26,27,28,29,30,31,32 We searched for a link between calorie and AGE restriction by feeding mice a typical CR diet (which resulted in a low AGE intake) or with a modified CR diet (CR-high) that resulted in an AGE intake that contained 50% higher amounts of CML and MG derivatives than the Reg diet. We compared mice fed these diets to mice fed regular mouse chow on an ad libitum basis throughout adult life. Serum and tissue levels of AGEs and 8-isoprostanes in the old mice fed the CR diet were reduced, and GSH levels were maintained, consistent with reduced AGE intake in these mice. However, old mice given the CR-high diet developed the typical pattern of increased serum AGEs, lipid peroxides, and loss of anti-oxidant reserves found in old mice fed the regular diet.1,2,3,26 These findings suggest that increasing the AGE intake in calorie-restricted mice to amounts similar to or moderately higher than that consumed by mice fed the regular ad libitum diet, reproduces the pattern of high oxidant load and anti-oxidant depletion associated with aging under an energy replete diet. Thus, increasing the intake of AGEs in the diet erases the benefits of CR.
High circulating levels of AGEs are linked to diabetes and its complications in both humans and animal models.16,24 In addition, both CR and AGE restriction reduce the risk of diabetes and prolong lifespan.26,29,30,31,32 Mice fed regular mouse chow maintained their maximal weight throughout normal life.1,2,3,26 As expected, body weight was lower in CR mice and they maintained normal insulin and GIR levels with aging.1,2,3,4,5,6,7 In contrast, old CR-high mice had elevated fasting insulin levels and GIRs, consistent with insulin resistance, and they tended to have a higher body weight. Age-related IR in these mice was likely attributable to the increased consumption of oxidants, because their energy intake was restricted, matching that of the CR diet. This conclusion is consistent with earlier findings whereby mice pair-fed an AGE-restricted diet, otherwise identical in calories to Reg diet, did not develop IR and showed a trend of lower body weight with age.26 The amount of AGEs consumed by the CR mice in the present study was similar to that of mice fed a Low-AGE diet. Because AGEs are known to promote irreversible protein-protein and protein-lipid cross links that resist degradation,16,17,22,44 the higher intake of AGEs in CR-high versus the CR mice may account for their trend toward higher body mass retention after the initial weight gain.29,30
The development of insulin resistance in the old CR-high mice, coupled with the loss of systemic anti-oxidant reserves and higher tissue deposits of AGEs, may have contributed to the cardiovascular fibrosis and kidney disease of aging noted in the old CR-high mice, but not in the old CR mice.4,5,40 The protection from interstitial fibrosis in the kidneys of CR mice parallels that previously seen in mice fed a low AGE diet.26 Consistent with that study, the contrast between the CR and CR-high mice indicates that the overall amount of oxidants in the diet may be one of the principal determinants of age-related cardiovascular and renal disease.
In the current study, high levels of oxidants in the CR-high diet may have competed against the benefits of CR by mechanisms that remain to be identified. A role for the AGE-associated receptors is likely, of which the best studied are AGER1 and RAGE. AGER1 blocks OS and inflammatory responses,33,34 whereas RAGE increases OS and inflammatory responses.25,45 Because AGER1 blocks RAGE and OS in vitro,33,34 the nearly twofold enhanced AGER1 expression found in old CR mice may have contributed to protection against OS in this group. Similarly, the lowered AGER1 levels in the old Reg and CR-high mice may have promoted OS and inflammatory responses. Because AGER1 also mediates the uptake and degradation of AGEs,33 the increased AGER1 levels in the kidneys of CR mice could underlie the maintenance of higher urinary AGE excretion with aging in these mice. The combination of increased turnover and higher urinary excretion of AGEs in aging CR mice may have contributed to a reduced tissue AGE burden and to long-term tissue protection against AGE toxicity.44
Recent data implicates AGER1 in a novel anti-OS mechanism involving the inhibition of the EGFR-ERK activation pathway and suppression of the OS-regulatory protein, p66shc.46 This is thought to provide protection from AGE-induced inactivation of the forkhead transcription factor, FOXO3a, and diminished MnSOD levels.11,46 The increased AGER1 expression in old CR mice may have played a role in preserving anti-oxidant defenses in these mice via this mechanism. This is supported by the fact that CR mice did not develop the age-dependent rise in p66shc protein,10,11 which has been linked to aging-related diseases such as atherosclerosis and diabetic nephropathy.38,39 This postulate is consistent with the findings in mice fed a low-AGE diet,26 and may provide an in vivo link between the sustained high AGER1 levels and extended lifespan in CR mice of the current study. In contrast to CR mice, p66shc levels were elevated in CR-high mice, as were the levels of tissue RAGE and systemic oxidants, consistent with markedly elevated OS and a depletion of GSH in these mice. Of note, RAGE levels in old CR mice were reduced, identifying CR as one means of suppressing this pro-oxidant factor in aging. These data, although not proving a causal relationship, provide the first indication that oxidant homeostasis in mice may depend on the maintenance of a positive balance between AGER1 and RAGE/OS.
AGE levels in vivo correlate with AGEs in foods19,21,37 and with the cellular effects elicited by synthetic MG and CML.17,23,37,45 This study validates these correlations by showing that specific AGEs in the food contribute directly to serum AGEs and to AGE-induced in vivo responses. It also demonstrates the importance of AGEs contained in the diet, although other oxidants may also contribute to the findings of the current study.20
The findings support evidence that age-related changes in OS and healthspan are parallel in mice, and that OS can be reduced, and healthspan increased, in mice fed a diet that is restricted in the content of AGEs. The data also open the question of normal aging to new paradigms, and warrant further studies of the molecular mechanisms involved. They also point out the necessity of considering the dietary content of oxidants an important variable in studies of aging in both humans and animals.
Footnotes
Address reprint requests to Helen Vlassara, M.D., Mount Sinai School of Medicine, One Gustave Levy Place, New York, NY 10029. E-mail: helen.vlassara@mssm.edu.
Supported by the National Institutes of Health (grants AG00943 and HL73417 to H.V.).
References
- Masoro EJ. Overview of caloric restriction and ageing. Mech Ageing Dev. 2005;126:913–922. doi: 10.1016/j.mad.2005.03.012. [DOI] [PubMed] [Google Scholar]
- Madsen MA, Hsieh CC, Boylston WH, Flurkey K, Harrison D, Papaconstantinou J. Altered oxidative stress response of the long-lived Snell dwarf mouse. Biochem Biophys Res Commun. 2004;318:998–1005. doi: 10.1016/j.bbrc.2004.04.126. [DOI] [PubMed] [Google Scholar]
- Zimmerman JA, Malloy V, Krajcik R, Orentreich N. Nutritional control of aging. Exp Gerontol. 2003;38:47–52. doi: 10.1016/s0531-5565(02)00149-3. [DOI] [PubMed] [Google Scholar]
- Spindler SR, Dhahbi JM. Conserved and tissue-specific genic and physiologic responses to caloric restriction and altered IGFI signaling in mitotic and postmitotic tissues. Annu Rev Nutr. 2007;27:193–217. doi: 10.1146/annurev.nutr.27.061406.093743. [DOI] [PubMed] [Google Scholar]
- Mattson MP, Wan R. Beneficial effects of intermittent fasting and caloric restriction on the cardiovascular and cerebrovascular systems. J Nutr Biochem. 2005;16:129–137. doi: 10.1016/j.jnutbio.2004.12.007. [DOI] [PubMed] [Google Scholar]
- Bokov A, Chaudhuri A, Richardson A. The role of oxidative damage and stress in aging. Mech Ageing Dev. 2004;125:811–826. doi: 10.1016/j.mad.2004.07.009. [DOI] [PubMed] [Google Scholar]
- Longo VD, Finch CE. Evolutionary medicine: from dwarf model systems to healthy centenarians? Science. 2003;299:1342–1346. doi: 10.1126/science.1077991. [DOI] [PubMed] [Google Scholar]
- Shimokawa I, Higami Y, Tsuchiya T, Otani H, Komatsu T, Chiba T, Yamaza H. Life span extension by reduction of the growth hormone-insulin-like growth factor-1 axis: relation to caloric restriction. FASEB J. 2003;17:1108–1109. doi: 10.1096/fj.02-0819fje. [DOI] [PubMed] [Google Scholar]
- Holzenberger M, Dupont J, Ducos B, Leneuve P, Geloen A, Even PC, Cervera P, Le Bouc Y. IGF-1 receptor regulates lifespan and resistance to oxidative stress in mice. Nature. 2003;421:182–187. doi: 10.1038/nature01298. [DOI] [PubMed] [Google Scholar]
- Migliaccio E, Giorgio M, Mele S, Pelicci G, Reboldi P, Pandolfi PP, Lanfrancone L, Pelicci PG. The p66shc adaptor protein controls oxidative stress response and life span in mammals. Nature. 1999;402:309–313. doi: 10.1038/46311. [DOI] [PubMed] [Google Scholar]
- Nemoto S, Finkel T. Redox regulation of forkhead proteins through a p66shc-dependent signaling pathway. Science. 2002;295:2450–2452. doi: 10.1126/science.1069004. [DOI] [PubMed] [Google Scholar]
- Melov S, Ravenscroft J, Malik S, Gill MS, Walker DW, Clayton PE, Wallace DC, Malfroy B, Doctrow SR, Lithgow GJ. Extension of life-span with superoxide dismutase/catalase mimetics. Science. 2000;289:1567–1569. doi: 10.1126/science.289.5484.1567. [DOI] [PubMed] [Google Scholar]
- Schriner SE, Linford NJ, Martin GM, Treuting P, Ogburn CE, Emond M, Coskun PE, Ladiges W, Wolf N, Van Remmen H, Wallace DC, Rabinovitch PS. Extension of murine life span by overexpression of catalase targeted to mitochondria. Science. 2005;308:1909–1911. doi: 10.1126/science.1106653. [DOI] [PubMed] [Google Scholar]
- Stadtman ER. Role of oxidant species in aging. Curr Med Chem. 2004;11:1105–1112. doi: 10.2174/0929867043365341. [DOI] [PubMed] [Google Scholar]
- Stadtman ER. Protein oxidation and aging. Science. 1992;257:1220–1224. doi: 10.1126/science.1355616. [DOI] [PubMed] [Google Scholar]
- Brownlee M. Biochemistry and molecular cell biology of diabetic complications. Nature. 2001;414:813–820. doi: 10.1038/414813a. [DOI] [PubMed] [Google Scholar]
- Baynes JW, Thorpe SR. Role of oxidative stress in diabetic complications: a new perspective on an old paradigm. Diabetes. 1999;48:1–9. doi: 10.2337/diabetes.48.1.1. [DOI] [PubMed] [Google Scholar]
- Koschinsky T, He CJ, Mitsuhashi T, Bucala R, Liu C, Buenting C, Heitmann K, Vlassara H. Orally absorbed reactive glycation products (glycotoxins): an environmental risk factor in diabetic nephropathy. Proc Natl Acad Sci USA. 1997;94:6474–6479. doi: 10.1073/pnas.94.12.6474. [DOI] [PMC free article] [PubMed] [Google Scholar]
- Goldberg T, Cai W, Peppa M, Dardaine V, Baliga BS, Uribarri J, Vlassara H. Advanced glycoxidation end products in commonly consumed foods. J Am Diet Assoc. 2004;104:1287–1291. doi: 10.1016/j.jada.2004.05.214. [DOI] [PubMed] [Google Scholar]
- Staprans I, Pan XM, Rapp JH, Feingold KR. Oxidized cholesterol in the diet is a source of oxidized lipoproteins in human serum. J Lipid Res. 2003;44:705–715. doi: 10.1194/jlr.M200266-JLR200. [DOI] [PubMed] [Google Scholar]
- Cai W, Gao QD, Zhu L, Peppa M, He C, Vlassara H. Oxidative stress-inducing carbonyl compounds from common foods: novel mediators of cellular dysfunction. Mol Med. 2002;8:337–346. [PMC free article] [PubMed] [Google Scholar]
- Requena JR, Ahmed MU, Fountain CW, Degenhardt TP, Reddy S, Perez C, Lyons TJ, Jenkins AJ, Baynes JW, Thorpe SR. Carboxymethylethanolamine, a biomarker of phospholipid modification during the Maillard reaction in vivo. J Biol Chem. 1997;272:17473–17479. doi: 10.1074/jbc.272.28.17473. [DOI] [PubMed] [Google Scholar]
- Shamshi FA, Partal A, Sady C, Glomb MA, Nagaraj RH. Immunological evidence for methylglyoxal-derived modifications in vivo: determination of antigenic epitopes. J Biol Chem. 1998;273:6928–6936. doi: 10.1074/jbc.273.12.6928. [DOI] [PubMed] [Google Scholar]
- Vlassara H, Cai W, Crandall J, Goldberg T, Oberstein R, Dardaine V, Peppa M, Rayfield EJ. Inflammatory mediators are induced by dietary glycotoxins, a major risk factor for diabetic angiopathy. Proc Natl Acad Sci USA. 2002;99:15596–15601. doi: 10.1073/pnas.242407999. [DOI] [PMC free article] [PubMed] [Google Scholar]
- Schmidt AM, Yan SD, Yan SF, Stern DM. The multiligand receptor RAGE as a progression factor amplifying immune and inflammatory responses. J Clin Invest. 2001;108:949–955. doi: 10.1172/JCI14002. [DOI] [PMC free article] [PubMed] [Google Scholar]
- Cai W, He JC, Zhu L, Chen X, Wallenstein S, Striker GE, Vlassara H. Reduced oxidant stress and extended lifespan in mice exposed to a low glycotoxin diet. Association with increased AGER1 expression. Am J Pathol. 2007;294:145–152. doi: 10.2353/ajpath.2007.061281. [DOI] [PMC free article] [PubMed] [Google Scholar]
- Uribarri J, Cai W, Peppa M, Goodman S, Ferrucci L, Striker G, Vlassara H. Circulating glycotoxins and dietary advanced glycation endproducts: two links to inflammatory response, oxidative stress, and aging. J Gerontol A Biol Sci Med Sci. 2007;62:427–433. doi: 10.1093/gerona/62.4.427. [DOI] [PMC free article] [PubMed] [Google Scholar]
- Uribarri J, Peppa M, Cai W, Goldberg T, Lu M, He C, Vlassara H. Restriction of dietary glycotoxins reduces excessive advanced glycation end products in renal failure patients. J Am Soc Nephrol. 2003;14:728–731. doi: 10.1097/01.asn.0000051593.41395.b9. [DOI] [PubMed] [Google Scholar]
- Sandu O, Song K, Cai W, Zheng F, Uribarri J, Vlassara H. Insulin resistance and type 2 diabetes in high-fat-fed mice are linked to high glycotoxin intake. Diabetes. 2005;54:2314–2319. doi: 10.2337/diabetes.54.8.2314. [DOI] [PubMed] [Google Scholar]
- Hofmann SM, Dong HJ, Li Z, Cai W, Altomonte J, Thung SN, Zeng F, Fisher EA, Vlassara H. Improved insulin sensitivity is associated with restricted intake of dietary glycoxidation products in the db/db mouse. Diabetes. 2002;51:2082–2089. doi: 10.2337/diabetes.51.7.2082. [DOI] [PubMed] [Google Scholar]
- Lin RY, Choudhury RP, Cai W, Lu M, Fallon JT, Fisher EA, Vlassara H. Dietary glycotoxins promote diabetic atherosclerosis in apolipoprotein E-deficient mice. Atherosclerosis. 2003;168:213–220. doi: 10.1016/s0021-9150(03)00050-9. [DOI] [PubMed] [Google Scholar]
- Zheng F, He C, Cai W, Hattori M, Steffes M, Vlassara H. Prevention of diabetic nephropathy in mice by a diet low in glycoxidation products. Diabetes Metab Res Rev. 2002;18:224–237. doi: 10.1002/dmrr.283. [DOI] [PubMed] [Google Scholar]
- Lu C, He JC, Cai W, Liu H, Zhu L, Vlassara H. Advanced glycation endproduct (AGE) receptor 1 is a negative regulator of the inflammatory response to AGE in mesangial cells. Proc Natl Acad Sci USA. 2004;101:11767–11772. doi: 10.1073/pnas.0401588101. [DOI] [PMC free article] [PubMed] [Google Scholar]
- Cai W, He C, Zhu L, Vlassara H. Advanced glycation end product (AGE) receptor 1 suppresses cell oxidant stress and activation signaling via EGF receptor. Proc Natl Acad Sci USA. 2006;103:13801–13806. doi: 10.1073/pnas.0600362103. [DOI] [PMC free article] [PubMed] [Google Scholar]
- Teillet L, Verbeke P, Gouraud S, Bakala H, Borot-Laloi C, Heudes D, Bruneval P, Corman B. Food restriction prevents advanced glycation end product accumulation and retards kidney aging in lean rats. J Am Soc Nephrol. 2000;11:1488–1497. doi: 10.1681/ASN.V1181488. [DOI] [PubMed] [Google Scholar]
- Peppa M, He C, Hattori M, McEvoy R, Zheng F, Vlassara H. Fetal or neonatal low-glycotoxin environment prevents autoimmune diabetes in NOD mice. Diabetes. 2003;52:1441–1448. doi: 10.2337/diabetes.52.6.1441. [DOI] [PubMed] [Google Scholar]
- Glomb MA, Tschirnich R. Detection of alpha-dicarbonyl compounds in Maillard reaction systems and in vivo. J Agric Food Chem. 2001;49:5543–5550. doi: 10.1021/jf010148h. [DOI] [PubMed] [Google Scholar]
- Napoli C, Martin-Padura I, de Nigris F, Giorgio M, Mansueto G, Somma P, Condorelli M, Sica G, De Rosa G, Pelicci P. Deletion of the p66Shc longevity gene reduces systemic and tissue oxidative stress, vascular cell apoptosis, and early atherogenesis in mice fed a high-fat diet. Proc Natl Acad Sci USA. 2003;100:2112–2116. doi: 10.1073/pnas.0336359100. [DOI] [PMC free article] [PubMed] [Google Scholar]
- Menini S, Amadio L, Oddi G, Ricci C, Pesce C, Pugliese F, Giorgio M, Migliaccio E, Pelicci P, Iacobini C, Pugliese G. Deletion of p66Shc longevity gene protects against experimental diabetic glomerulopathy by preventing diabetes-induced oxidative stress. Diabetes. 2006;55:1642–1650. doi: 10.2337/db05-1477. [DOI] [PubMed] [Google Scholar]
- Anversa P, Palackal T, Sonnenblick EH, Olivetti G, Meggs LG, Capasso JM. Myocyte cell loss and myocyte cellular hyperplasia in the hypertrophied aging rat heart. Circ Res. 1990;67:871–885. doi: 10.1161/01.res.67.4.871. [DOI] [PubMed] [Google Scholar]
- Shangari N, O'Brien PJ. The cytotoxic mechanism of glyoxal involves oxidative stress. Biochem Pharmacol. 2004;68:1433–1442. doi: 10.1016/j.bcp.2004.06.013. [DOI] [PubMed] [Google Scholar]
- Abbatecola AM, Ferrucci L, Grella R, Bandinelli S, Bonafe M, Barbieri M, Corsi AM, Lauretani F, Franceschi C, Paolisso G. Diverse effect of inflammatory markers on insulin resistance and insulin-resistance syndrome in the elderly. J Am Geriatr Soc. 2004;52:399–404. doi: 10.1111/j.1532-5415.2004.52112.x. [DOI] [PubMed] [Google Scholar]
- Hadjadj S, Duengler F, Torremocha F, Faure-Gerard G, Bridoux F, Boissonnot M, Mauco G, Guilhot J, Marechaud R. Maternal history of type 2 diabetes is associated with diabetic nephropathy in type 1 diabetic patients. Diabetes Metab. 2007;33:37–43. doi: 10.1016/j.diabet.2006.09.003. [DOI] [PubMed] [Google Scholar]
- Li YM, Steffes M, Donnelly T, Liu C, Fuh H, Basgen J, Bucala R, Vlassara H. Prevention of cardiovascular and renal pathology of aging by the advanced glycation inhibitor aminoguanidine. Proc Natl Acad Sci USA. 1996;93:3902–3907. doi: 10.1073/pnas.93.9.3902. [DOI] [PMC free article] [PubMed] [Google Scholar]
- Basta G, Lazzerini G, Del Turco S, Ratto GM, Schmidt AM, De Caterina R. At least 2 distinct pathways generating reactive oxygen species mediate vascular cell adhesion molecule-1 induction by advanced glycation end products. Arterioscler Thromb Vasc Biol. 2005;25:1401–1407. doi: 10.1161/01.ATV.0000167522.48370.5e. [DOI] [PubMed] [Google Scholar]
- Cai W, He JC, Zhu L, Chen X, Striker GE, Vlassara H. AGE-receptor-1 counteracts cellular oxidant stress induced by AGEs via negative regulation of p66shc-dependent FKHRL1 phosphorylation. Am J Physiol. 2008;294:C145–C152. doi: 10.1152/ajpcell.00350.2007. [DOI] [PubMed] [Google Scholar]


