

Abstract
Monkeys fixated a stationary spot during presentation of dot textures that moved in apparent motion defined by the spatial and temporal separations, Δx and Δt, between successive flashes of each dot. For each neuron, we assessed the speed tuning for smooth motion (Δt = 2 or 4 ms) at speeds ≤128°/s and the effect of varying the value of Δt at speeds of 16 and 32°/s. Many medial superior temporal (MST) neurons, like middle temporal (MT) neurons, were tuned for the speed of smooth motion and showed decreases in firing rate as the value of Δt increased at a constant speed. A subset of MST neurons, however, showed monotonically increasing firing rates as a function of smooth stimulus speed and responses to apparent motion that paralleled a previously discovered illusion where estimates of target speed increase with the value of Δt. Opponent firing rate, defined as the difference between responses for motion in the preferred and opposite directions, peaked at values of Δt that were consistent with the behavioral illusion. Comparison with a new sample of MT neurons recorded with the same stimuli failed to reveal comparable effects. Attempts to map the population responses in MT and MST onto the behavioral illusion of increased speed succeeded by averaging the opponent response across MST neurons, but only by applying vector averaging to determine the preferred speed of the most active MT neurons. We suggest that a vector-averaging computation transforms MT’s place code for target speed into the rate code of some MST neurons.
INTRODUCTION
Rate codes and place codes form two extremes for how external events can be represented in the brain. If the value of a parameter of a sensory stimulus or an impending movement can be predicted unambiguously from the firing rate of one neuron, or from the average firing rate of a population of neurons, then we can think of the neuron(s) as the source of a rate code for that particular parameter. For example, when the eye is fixating, the firing rates of extraocular motoneurons provide a rate code for eye position: responses increase progressively as eye position becomes more eccentric (e.g., Fuchs and Luschei 1970). In the cerebral cortex, however, neural responses often are tuned: a neuron might respond best to one value of a parameter and less well for higher or lower values. If the responses of all neurons in a population are tuned for a given parameter of a stimulus, then the value of that parameter cannot be predicted by averaging the firing rates across the population. Instead, the value of the parameter can be estimated by knowing the preferred stimulus and firing rate for each neuron in the population. In this instance, we think of the population of neurons as a place code (Groh 2001), where the most active “place” in the neural population indicates the value of the parameter in question. The representation of orientation in the primary visual cortex is a classic example of a place code: each cortical neuron is tuned for orientation and the only way to deduce the orientation of a stimulus is to determine the preferred orientation of the column of cortical neurons with the highest firing rates (Hubel and Wiesel 1974).
In extrastriate visual area MT, the population of neurons provides place codes for both the speed and direction of motion of visual stimuli. Neurons in MT are tuned for both speed and direction and different neurons have different values of preferred speed and direction. Partly because neural responses are tuned and partly because they are tuned independently for two parameters of target motion, it is not possible to know either the speed or direction of target motion by simply adding or averaging the responses of middle temporal (MT) neurons. Instead, it is necessary to determine the preferred speed and direction of the neurons with the largest responses. Strong evidence that MT provides a place code for target speed comes from an illusion created by providing “apparent motion” targets (Churchland and Lisberger 2001). The basis for this conclusion is sketched in Fig. 1. If motion is degraded by increasing the temporal (and spatial) separation between flashes of a moving target while keeping its speed constant, then the visual system experiences an illusory increase in speed. The size of the illusion peaks at particular temporal separations between target flashes and can be observed both in perceptual reports of speed and during the initiation of smooth-pursuit eye movements (Fig. 1A).
FIG. 1.
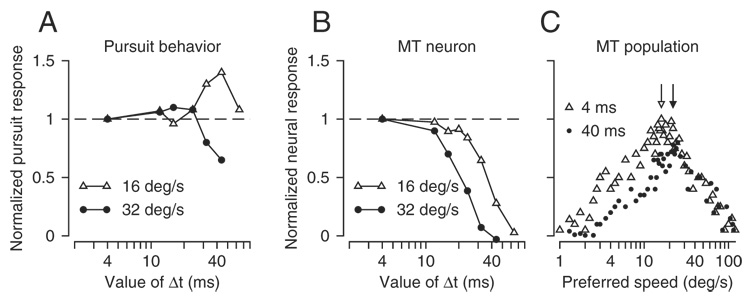
Summary of the background for this paper, based on an earlier paper by Churchland and Lisberger (2001). A: relationship between normalized initial pursuit response and the value of Δt for apparent target motion. B: effect of increasing the value of Δt on the response of a typical middle temporal (MT) neuron to apparent motion stimuli moving at 2 speeds. Responses were normalized so that the response had a value of 1 at the smallest value of Δt tested for each speed. In A and B, open triangles and filled circles indicate responses during 16 and 32°/s motion. C: schematic population responses in MT for stimuli that moved at 16°/s. Open triangles and filled circles show responses when Δt was 4 and 40 ms, respectively. Each symbol plots the normalized response of a single neuron. Two arrows indicate the location of the centers of mass of the 2 population responses, at 16°/s when Δt was 4 ms and at 24°/s when Δt was 40 ms.
Even though neural responses in MT are believed to underlie the representation of speed used for perception and pursuit, most individual MT neurons do not show the same illusion of increased speed observed in behavior. Instead, the averaged responses of MT neurons decrease monotonically as a function of the separation between flashes (Fig. 1B). As a result, a simple average of the responses of all neurons predicts that any estimates of target speed simply decrease, in direct contrast with what is observed behaviorally. However, when the entire population of MT neurons is viewed by plotting each neuron’s response to a single stimulus as a function of the neuron’s preferred speed, a possible neural correlate of the illusion appears. The population response shifts to the right along the preferred speed axis when the temporal separation between flashes increases from 4 to 40 ms (Fig. 1C). A vector average, which decodes a place code by estimating the preferred speed of the most active neurons, maps the population code in MT onto the illusion of increased target speed (arrows in Fig. 1C). The vector average is successful because the effect of apparent motion is to selectively decrease the responses of neurons tuned for slow speeds, causing the peak of the population response to shift to neurons that prefer higher values of speed.
In the course of evaluating the responses to apparent motion of neurons across multiple stages in the visual motion pathways (Churchland and Lisberger 2001; Churchland et al. 2005), we discovered a subset of neurons in the medial superior temporal area (MST) whose visual signals have the potential to provide a rate code for the speed of target motion. We recorded from these neurons using the same parameters of apparent motion that caused pursuit and perception to show illusory increases in their estimates of target speed and MT neurons to show decreased firing rates. In MST, increases in the value of the temporal separation (Δt) at a fixed apparent speed cause a subset of neurons to show increases in visual responses that parallel the illusory increase in target speed reported in pursuit and perception.
Prior reports have emphasized that visual responses in MST are different from those in MT in a number of ways. Receptive fields are larger and many neurons are selective for complex motion stimuli like the flow fields that result from our own motion through the world (Duffy and Wurtz 1991; Graziano et al. 1994; Orban et al. 1995). The contrast between the relatively simple motion signals present in MT and the complex ones present in MST suggests that MST transforms its inputs into complex motion signals that may be particularly useful for downstream perceptual and motor systems. Our data raise the possibility that one of those transformations involves determining the preferred speed of the most active MT neurons and creating motion signals from which speed can be determined simply by averaging the responses of a subset of MST neurons.
METHODS
Eye movement and neural recordings were obtained from three adult male rhesus monkeys (Macaca mulatta) that had been trained to fixate and pursue visual targets for fluid reward. Two of the monkeys provided the data from MST and one provided the data from MT. Using sterile surgical procedures, monkeys were implanted with head restraints and scleral search coils as described elsewhere (Churchland and Lisberger 2000; Ramachandran and Lisberger 2005). After initial training, surgery was performed to implant recording cylinders over a 20-mm circular hole cut in the skull to allow access to MST for neural recordings. For each experimental session, the monkey sat in a primate chair affixed with a tube for dispensing fluid rewards. Methods were approved in advance by the Institutional Animal Care and Use Committee at the University of California, San Francisco and were in accordance with the National Institutes of Health Guide for the Care and Use of Laboratory Animals.
Stimulus presentation and eye-movement recording
Visual stimuli were displayed on a 12-in. diagonal analog oscilloscope that was positioned 30 cm from the monkey and subtended horizontal and vertical angles of 40 and 32°. Visual stimuli consisted of patches of randomly placed dots that moved coherently behind a 30 × 30 or 8 × 8° square, virtual aperture. Each dot was about 0.2° across and had a luminance of 1.6 cd/m2. Dot density was 0.4 and 0.6 dots/deg2 for the large and small textures, respectively. As dots moved outside the virtual aperture, they were replaced by randomly located dots at the opposite edge of the aperture. We created apparent motion by presenting each dot at a sequence of locations with a given temporal (Δt) and spatial (Δx) separation between locations, where apparent speed is defined as Δx/Δt. The control signals for the oscilloscopes were provided by the digital-to-analog converters of a digital signal processing board that ran custom software in a Pentium computer. The specifications of the display oscilloscopes indicate that the phosphor decayed to 10% of its maximal level in 10 µs to 1 ms. We assume that the decay time was related to the intensity of the pixel, although details are not provided in the manuals for these ancient oscilloscopes.
Visual stimuli were presented in “trials,” each of which contained motion at one speed and one value of Δt. Trials began with the onset of a fixation point, followed 600 ms later by the onset of a stationary patch of dots. After a 200-ms presentation of the stationary texture, dots moved coherently at a constant speed for 500 ms. The patch then was extinguished and the fixation light remained on for 200 ms. When the monkeys successfully maintained fixation within a 4–5° window throughout the trial, they were rewarded with a droplet of fluid. Even though actual fixation accuracy was typically much better that 4–5°, the fixation window was selected to be consistent with previous experiments (Churchland and Lisberger 2001) and to ensure that brief deviations of eye position at the start of the fastest stimuli tested did not cause the trial to be aborted. Even at the fastest speed of stimulus motion we tested (128°/s), mean radial eye speed peaked at only 0.76°/s. Eye speed remained at this peak only transiently and 100 ms later was only 0.34°/s. Very few MST neurons would show any extraretinal response to such low eye velocities (Churchland and Lisberger 2005).
Note that our animals were rewarded for fixating a stationary spot and not for tracking the moving stimulus. We chose to measure neural responses during fixation rather than during pursuit because we wanted to assess the visual representation of target speed, not the extraretinal representation of eye speed (e.g., Churchland and Lisberger 2005). Extraretinal responses should not be a feature of our data and examining them would not have allowed us to ask the key question of how visual responses are transformed as they go from MT to MST. Our experimental design allows direct comparison of recordings from MST with the prior observation that the population response in MT forms a place code for target speed (Churchland and Lisberger 2001) because we used the same behavioral conditions and the same parameters of apparent motion. We also enhanced the power of this comparison by recording a new sample of MT neurons with the same large stimulus used most typically in recordings from MST.
Neural recordings
Extracellular action potentials were recorded from single units in area MST of two monkeys using sharp, 1- to 3-MΩ tungsten microelectrodes (FHC). The electrode location was determined by a guide tube inserted in a plastic grid (Crist Instruments) that fit snugly in the recording cylinder. Neural potentials were amplified conventionally, band-pass filtered from 100 Hz to 5 or 10 kHz, and viewed on an analog oscilloscope. Action potentials from individual neurons were triggered by a hardware discriminator (Bak Electronics) and their times of occurrence were recorded to the nearest 10 µs by the computer. In separate experiments, action potentials were recorded from single units in area MT using the same electrodes. For MT recordings, signals were filtered, amplified, and digitized and single units identified with a real-time template matching system (Plexon, Dallas, TX). We strove for excellent isolation of unitary potentials during the experiment but we also used the Plexon system to check and improve isolation, and to convert the action potentials to timestamps. For both sets of experiments, voltages proportional to horizontal and vertical eye position and velocity were sampled at a rate of 1,000 samples/s on each channel.
In all monkeys, the recording cylinders were oriented vertically and centered at about 15 mm lateral and 2–4 mm posterior relative to stereotaxic zero. The advantage of the vertical approach is that penetrations usually go sequentially through MST, the lumen of the superior temporal sulcus, and MT, making it straightforward to distinguish MST from MT. Typically, the two areas were distinguished based on the well-described response properties in each area (Maunsell and Van Essen 1983; Saito et al. 1986; Tanaka et al. 1986) and the location of surrounding areas V4 and 7a. One monkey was sent to a sanctuary and the other two are still being used in other experiments, so histology is not available. To be conservative in our identification of MST neurons, we excluded neurons that were recorded more ventrally if 1) we could not completely rule out the possibility that they were in area MT based on observation of a clear lumen at a deeper recording location or 2) they had small receptive fields restricted to the contralateral visual field (see following text).
After isolating a neuron, we assessed its basic responses to what we will call smooth motion, defined as apparent motion with Δt set to 2 ms (MST) or 4 ms (MT). Of course, motion is technically sampled even with Δt set to such low values, but the motion appears smooth and we will use the shorthand of “smooth” to describe this control motion. We estimated each neuron’s preferred direction by presenting eight directions of target motion at 30°/s; if the neuron failed to exhibit directional responses at 30°/s, faster and slower speeds were tried. Responses to the last 400 ms of motion in each direction were analyzed to determine the neuron’s best direction. The preferred speed then was estimated by presenting a series of target motions in the neuron’s preferred direction at speeds ranging from 0.5 to 128°/s.
Once the preferred speed had been determined, we assessed the receptive field size of MST neurons by presenting 8 × 8° patches at locations that tiled the visual field. A particular location was considered to be part of the receptive field if the mean response to stimulus motion across that location exceeded the baseline firing rate by 3 SDs. Mean receptive field size was 22 × 27° in MST, which is more than half of the visual field tested (our screen measured 32 × 40°). Further, 84% of neurons had significant responses in the ipsilateral field. The large receptive field size and the presence of responses in the ipsilateral visual field of our sample of neurons are consistent with other reports of recordings in MST (Komatsu and Wurtz 1988) and suggest that we recorded primarily from the dorsal subregion, MSTd (Tanaka et al. 1986). Further, most of our receptive fields in MST included the central 10° of visual field, thus overlapping with the receptive field locations of most of the MT neurons recorded by Churchland and Lisberger (2001) as well as those reported here.
Several factors make it difficult to compare quantitatively our receptive field sizes with those reported in Komatsu and Wurtz (1988) or Duffy and Wurtz (1991). First, our screen measured only 32 × 40°, whereas theirs measured 100 × 100°, so the largest receptive fields contributing to our average were much smaller than theirs. Second, we counted locations in the visual field as part of the receptive field only when responses during the stimulus exceeded those during the baseline by 3 SDs. Occasionally receptive fields were described in notes made during the experiment as large on the basis of hand mapping, but turned out to have only a small receptive field by our strict criteria. If we had relaxed our criterion to include all regions of the visual field where firing rate exceeded baseline by only 2 SDs, our MST neurons would have had mean receptive fields sizes of 25 × 32° (almost the size of our screen) instead of 22 × 27°. Finally, Komatsu and Wurtz (1988) described MSTd receptive fields as “>14° per side,” in keeping with our observations.
To study the responses of each neuron to apparent motion, we presented a series of trials where target speed was held constant at 16 and 32°/s and values of Δt were 2 or 4, 12, 24, 32, 44, and 64 ms. We chose 16 and 32°/s so that we could compare the results with the previous sample of MT neurons. In many cases, the speeds were not optimal but still elicited clear responses from the neurons. This approach typically revealed consistent relationships between firing rate and Δt, rather than the inconsistent noisy results we would expect if we were simply using a speed that was far from optimal so that the neurons were unresponsive. To assess the speed tuning simultaneously, interleaved trials presented apparent motion with Δt = 2 ms for MST recordings and 4 ms for MT recordings, at apparent speeds ranging from 8 to 128°/s. The luminance of the individual dots was varied as a function of Δt, so that the luminance of all stimuli was the same when integrated across a time equal to or longer than the longest value of Δt. On our analog oscilloscope, each presentation of the stimulus could be brightened by painting a fixed set of dots multiple times at the same location on the screen; we assumed a linear relationship between number of paintings and brightness.
The apparent motion experiment was conducted first with stimuli presented in a large aperture (30 × 30°) and again with a smaller aperture (8 × 8°) whenever neural stability would allow it. Target motions of each value of speed and Δt were presented in both the preferred direction of the neuron and the opposite (null) direction. Responses were collected until the accumulated histograms showed a reasonable signal-to-noise ratio, ≥10 repetitions of each trial type, or about 15–30 min. Responses to the entire 500-ms interval of stimulus motion were analyzed. Data were fit with a cubic-smoothing spline using the Matlab function csaps with the smoothing parameter set to 0.04. The peak of the fitted curve was taken as the neuron’s preferred speed for data relating response to speed or as the value of Δt that elicited the largest response for data relating response to Δt at a fixed speed. To plot population data, we normalized all of each neuron’s responses so that the largest response to smooth motion had a value of 1.
RESULTS
Responses of representative MST neurons to apparent motion
Figure 2 shows the responses of three of 71 MST neurons whose responses we recorded to apparent motion stimuli. The top row of graphs in Fig. 2, A–C plots the relationship between mean firing rate and Δt for target motion in the preferred direction at 16°/s (open triangles) and 32°/s (filled circles), whereas the bottom row of graphs shows responses for target motion in the neuron’s null direction. In the middle row of graphs of Fig. 2, A–C, each point plots the opponent firing rate, computed as the difference between firing rate in the preferred and null directions for a given value of speed and Δt.
FIG. 2.
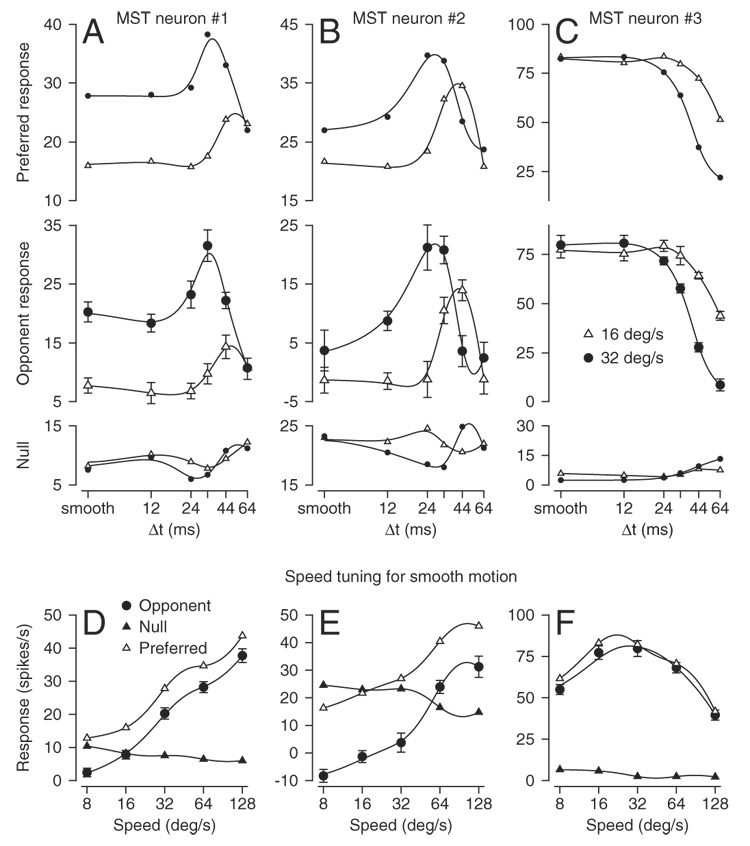
Example responses to apparent motion from 3 medial superior temporal (MST) neurons. Each column of graphs shows response from a single neuron. A–C, top, middle, and bottom rows: graphs show the effect of the value of Δt for apparent motion on firing rate for motion in the preferred direction, opponent firing rate, and firing rate for motion in the null direction, respectively. Open triangles and filled circles show results for apparent motion at 16 and 32°/s, respectively. Ticks on the x-axes labeled “smooth” refer to apparent motion when Δt was 2 ms. D–F: relationship between firing rate and stimulus speed for smooth motion (Δt = 2 ms). Filled circles, open triangles, and filled triangles show opponent, preferred, and null direction responses, respectively. In all 12 graphs, the smooth traces indicate the cubic smoothing splines used to fit the data.
For the two neurons illustrated in the left and center graphs, increases in the value of Δt at a constant apparent speed caused the opponent firing rate of each neuron to first increase and then decrease (Fig. 2, A and B). Comparison of the responses at the two apparent speeds, shown by different symbols, revealed that the faster apparent speed (32°/s, filled circles) caused both a higher opponent firing rate for smooth motion and a peak response that occurred at a lower value of Δt. For both neurons, analysis of the speed tuning for smooth motion (Δt = 2 ms, Fig. 2, D and E) revealed that the opponent firing rate increased monotonically as a function of speed up to the highest speed tested, which was 128°/s. A large subset of MST neurons emitted their largest responses for high values of target speed. In all instances, the neurons fired over a wide range of target speeds, as illustrated in Fig. 2, D and E, and did not show narrow tuning for high speeds.
The neuron illustrated in the right column of graphs in Fig. 2 showed responses that are visibly different from those of the other two neurons in Fig. 2, but are much more similar to those reported previously for MT neurons (Churchland and Lisberger 2001; Newsome et al. 1986). First, Fig. 2C shows that the opponent response declined progressively as a function of increases in Δt. Second, responses to apparent motion began their decline at higher values of Δt for motion at 16°/s (open triangles) than for motion at 32°/s (filled circles). Third, Fig. 2F shows that this MST neuron had a tuned relationship between opponent firing rate and stimulus speed, with a preferred speed of 32°/s. Note in all the panels of Fig. 2 that the opponent response was dominated by the response to motion in the preferred direction. This was true for almost all of the MST neurons we recorded.
Figure 3 illustrates several features of the data for 11 MST neurons that showed the clearest expression of peaks in the relationship between opponent response and Δt. Here, each graph shows data obtained for apparent motion at 32 and 16°/s (filled circles vs. open triangles). In general, the value of Δt that yielded the largest opponent response for a given neuron shifted to a lower value for apparent motion at 32 versus 16°/s. Comparison of the first points in each graph, for smooth motion at the two speeds, shows that the opponent response almost always was larger for motion at 32 versus 16°/s. For larger values of Δt, however, the peak opponent responses often were comparable at the two speeds. Finally, the preferred speeds of these neurons for smooth motion, given by the numbers in the top left corner of each graph, were >90°/s for all but two neurons.
FIG. 3.
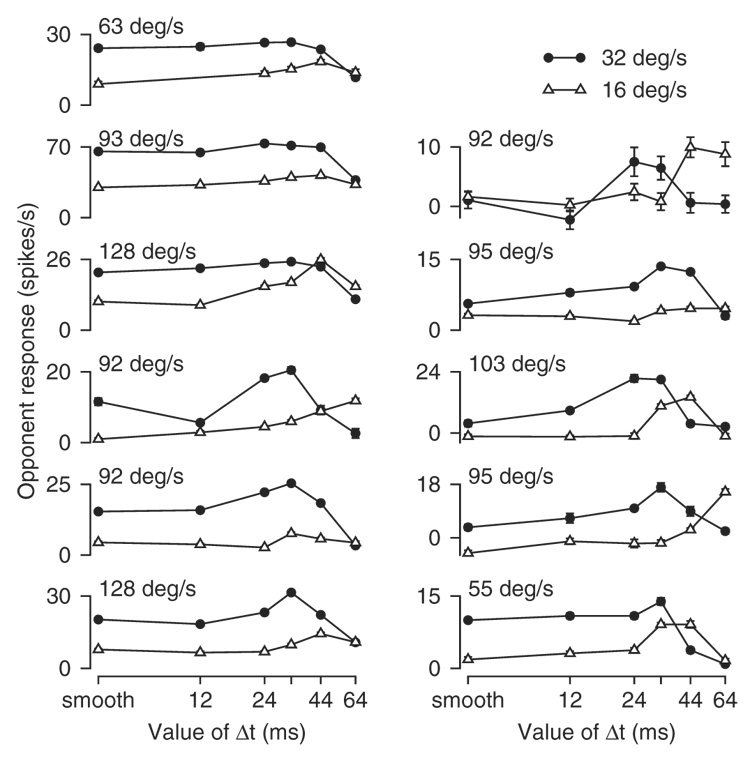
Responses to apparent motion for 11 MST neurons with clear peaks in the relationships between opponent response and the value of Δt. Ticks on the x-axes labeled “smooth” refer to apparent motion when Δt was 2 ms. Each graph superimposes the responses for apparent motion at 16°/s (open triangles) and 32°/s (filled circles) in an individual neuron. Numbers in the top left corner of the graphs indicate the preferred speeds of the neurons for smooth motion. Error bars indicate SEs, but have been plotted only when they are larger than the size of the symbol.
There are two important points to be aware of in reference to Fig. 2 and Fig. 3. First, we recorded the responses of MST neurons to moving stimuli presented during excellent fixation of a stationary spot (see METHODS). Therefore the responses summarized in our figures are driven by image motion, almost entirely uncontaminated by tracking eye motions. Second, we quantified the opponent response of MST neurons because these responses map better onto the illusion of increased target speed (see later), but the same general features appeared in the responses to motion in the preferred direction only. For each MST neuron, we assessed the value of Δt that evoked the largest response and the preferred speed by fitting cubic spline functions to the respective relationships and taking the value of Δt or speed at the peak of the fitted spline. Fits were made both to the opponent responses and to the responses for motion in the preferred direction. For most MST neurons, neither the preferred speed (Fig. 4C), nor the value of Δt that gave the largest response at 16°/s (Fig. 4A) or 32°/s (Fig. 4B) depended strongly on whether the measurements were made from the opponent response or the responses evoked by motion in the preferred direction. Only a few neurons plotted far from the line of slope 1.0 and these were scattered fairly evenly above and below the line.
FIG. 4.
Quantitative comparison of the response measures obtained from responses to motion in the preferred direction vs. the opponent response. A: value of Δt that gave the largest response for target motion at 16°/s. B: value of Δt that gave the largest response for target motion at 32°/s. C: preferred speed for smooth target motion (Δt = 2 ms). Each symbol shows data for an individual MST neuron. Each graph plots the response measure estimated from preferred direction motion vs. that estimated from the opponent response. All values were taken as the value of Δt or target speed at the peak of the cubic spline fitted to the data. Dashed lines have slope of 1.0 and originate from (0, 0), showing the expected location for points when the measures from opponent and preferred responses were equal.
Quantitative summary of the responses of MST neurons to apparent motion
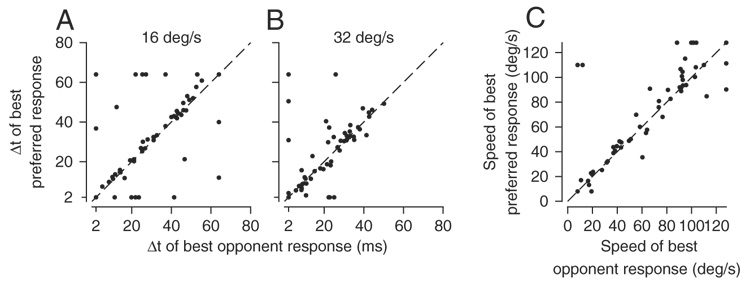
Inspection of Fig. 5, A and B shows considerable scatter, but also reveals that MST neurons with slow preferred speeds almost always responded best for relatively small values of Δt. Neurons with moderate to fast preferred speeds often responded best for larger values of Δt. At both 16°/s (Fig. 5A) and 32°/s (Fig. 5B), the value of Δt that caused the largest response was positively correlated with the preferred speed (16°/s: r = 0.4555, P < 0.001, 32°/s: r = 0.6715, P < 0.001). The use of opponent firing for the analysis in Fig. 2 did not create this relationship: for responses to motion in the preferred direction, the value of Δt that evoked the largest response was similarly correlated with the preferred speed of the neuron (16°/s: r = 0.4402, P < 0.001, 32°/s: r = 0.5494, P < 0.001).
FIG. 5.
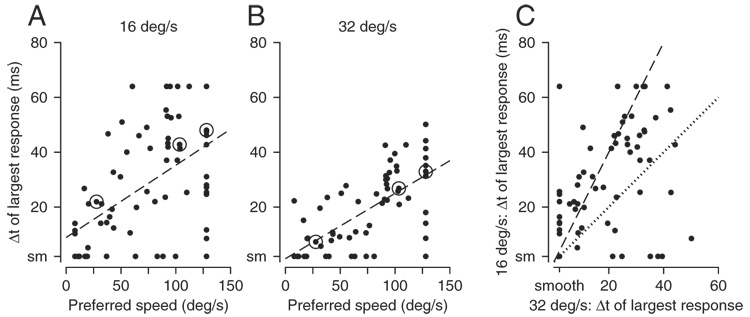
Quantitative analysis of the full sample of MST neurons. In each graph, an individual symbol summarizes the responses of a single MST neuron. A and B: relationship between the value of Δt that caused the largest opponent response and preferred speed, where A and B show data for apparent motion at 16 and 32°/s, respectively. Values for preferred speed and best Δt were taken as the values on the x-axis at the peaks of the spline fits to the data. Dashed lines in A and B indicate the best linear fit to the data, obtained by Type II regression with the assumption of equal variances along the x- and y-axes. Circled data points show points for the example neurons shown in Fig. 2. C: relationship between the value of Δt that caused the largest opponent response for apparent motion at 16 vs. 32°/s. Dotted and dashed lines have slopes of 1.0 and 2.0. Note that 6 neurons appear as a single point at the bottom left corner of the graph because the value of Δt along both axes was 2 ms. Ticks on the axes labeled “smooth” (or “sm”) refer to apparent motion when Δt was 2 ms, effectively smooth motion.
Plotting the value of Δt that evoked the largest response for apparent motion at 16°/s as a function of that for motion at 32°/s (Fig. 5C) revealed a consistent relationship that clustered around the line of slope 2.0. Type II regression on the assumption of equal variances along the x- and y-axes computed a regression slope of 2.02. Almost all points lie above the line of slope 1.0 (dotted line), indicating that on a neuron-by-neuron basis, the value of Δt that evoked the best responses was almost always smaller for motion at 32°/s than that at 16°/s. Note that the slope of the regression line in Fig. 5C would have been 1.0 (dotted line) or 2.0 (dashed line), if the responses to apparent motion of MST neurons were more tightly linked to the temporal (Δt) or spatial (Δx) separation between flashes of the stimuli. The fact that the slope is close to 2.0 implies that MST neurons, like other cortical neurons (Churchland and Lisberger 2001; Newsome et al. 1986), modulate their responses in relation mainly to the spatial separation between flashes, although the scatter among different MST neurons again suggests some heterogeneity. Attempts to correlate receptive field location or size with the parameters of responses to apparent motion did not reveal any relationships worth elaborating, perhaps because our analysis of receptive field properties was hampered by the small size of our screen relative to the size of the receptive fields of most MST neurons.
Effects of stimulus size on the responses of MT and MST neurons to apparent motion
Churchland and Lisberger (2001) recorded the responses of MT neurons to the motion of dots in 8 × 8° apertures to match the stimulus to the size of MT receptive fields. Because many MST neurons respond better to large stimuli, we presented moving dot textures in larger, 30 × 30° apertures for all neurons. To allow comparison of the responses of MST and MT neurons, we have conducted two control experiments. First, we recorded the responses of a smaller sample of 33 MST neurons with smaller, 8 × 8° dot textures. Second, we recorded a new sample of 39 MT neurons and repeated the experiments of Churchland and Lisberger (2001) using both the small and large textures. The combination of these two control experiments verify, as shown below, that there are some genuine differences between the responses of MT and MST neurons to apparent motion stimuli.
Figure 6, A and B plots the value of Δt that evoked the best response as a function of the preferred speed for the 33 MST neurons that were studied with both the large and the small stimuli, using different symbols to compare the responses to the two stimuli. For both large stimuli (filled symbols) and small stimuli (open symbols), the value of Δt that drove a neuron best was related to that neuron’s preferred speed. However, preferred speeds tended to be lower for the smaller stimulus, causing the data for the small stimulus to plot somewhat to the left of those for the large stimulus. As a consequence, the value of Δt that evoked the largest response was also somewhat smaller for the smaller stimulus. For MT neurons, the data for large stimuli (filled symbols) and small stimuli (open symbols) showed almost complete overlap of the relationships between the value of Δt that evoked the best response and the preferred speed. Importantly, comparison of the graphs within each column of Fig. 6 shows that the value of Δt that evoked the largest response was smaller for MT neurons than for MST neurons, even when the comparison is made for neurons with the same preferred speeds. For target motion at 16°/s, MT neurons rarely showed a value of best Δt >35 ms, whereas a reasonable number of MST neurons had larger values of best Δt (gray rectangle in Fig. 6A), even over the range of preferred speeds (≤70°/s) found in both areas. For motion at 32°/s, MT neurons had values of best Δt <20 ms, whereas many MST neurons had larger values, again over the range where preferred speeds overlapped (gray rectangle in Fig. 6B).
FIG. 6.
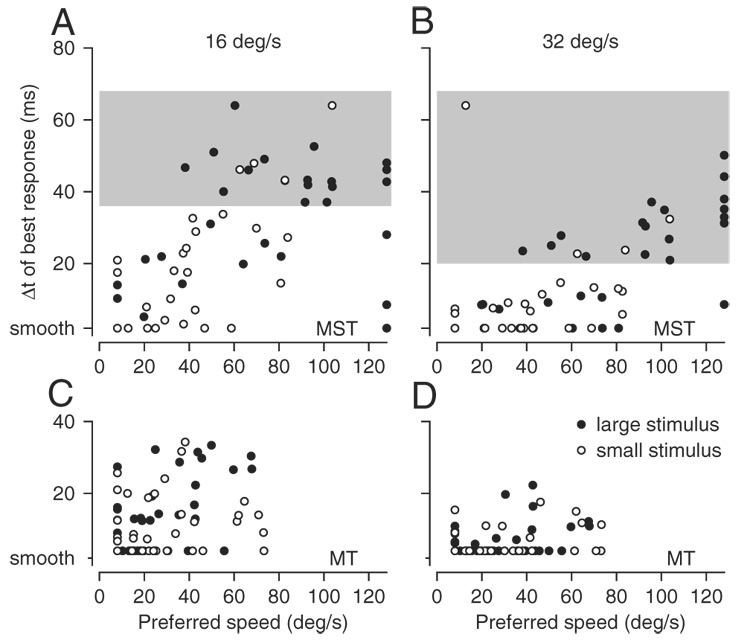
Effect of stimulus size on the responses of MST and MT neurons to apparent motion. A and C: apparent motion at 16°/s. B and D: apparent motion at 32°/s. A and B: MST. C and D: MT. Each point plots the response of an individual neuron and shows the value of Δt that evoked the largest response as a function of the preferred speed. Filled and open circles show responses for large (30 × 30°) and small (8 × 8°) textures of moving dots. Each neuron is represented by 2 symbols in each graph. Note that the 2 symbols for a given neuron need not plot at the same value of preferred speed because this parameter was derived separately for each of the 2 stimulus sizes. Ticks on the y-axes labeled “smooth“ refer to apparent motion when Δt was 2 or 4 ms for recordings in MST and MT, respectively. A and B show the data from 33 MST neurons studied with both the large and small stimulus; C and D show the data from 39 MT neurons studied with both the large and small stimulus. Areas shaded gray in A and B represent regions of the graph where MST neurons plotted but MT neurons did not. Because many points overlapped at the minima on each axis, there appear to be fewer points than the numbers given above in some of the graphs.
Table 1 summarizes another analysis we performed that confirms differences in the relationship between neural responses and Δt for MT versus MST neurons. For each neuron in our new sample, we used a one-tailed t-test with Bonferroni correction to determine whether the firing rate at any value of Δt was significantly larger (P < 0.05) than the response during the smooth motion provided when Δt was 4 ms for MT and 2 ms for MST. As shown in Table 1, the percentage of neurons with a statistically significant peak was larger in MST than in MT for each of the two stimulus sizes. The difference between MT and MST was particularly striking for the large stimulus and was present in both the opponent response and the response to motion in the preferred direction.
TABLE 1.
Percentage of neurons showing a statistically significant peak in the relationship between response and the value of Δt, where the peak is at a value greater than that used to present “smooth” motion
| MT, % |
MST, % |
|||
|---|---|---|---|---|
| Large stimulus | Small stimulus | Large stimulus | Small stimulus | |
| Preferred response (16°/s) | 12.8 | 0.0 | 26.8 | 18.3 |
| Preferred response (32°/s) | 0.0 | 2.6 | 31.0 | 3.1 |
| Opponent response (16°/s) | 5.1 | 0.0 | 25.4 | 6.5 |
| Opponent response (32°/s) | 0.0 | 0.0 | 28.2 | 3.2 |
The size of the stimulus had a consistent effect on the responses to apparent motion in MST, but not in MT. Figure 7, A and B provides scatterplots of the values of Δt that evoked the largest neuronal responses, comparing responses to motion of large and small stimuli. Neurons with larger response parameters for large versus small stimuli should appear in the top left triangle of the graphs, and those with smaller response parameters in the bottom right triangle of the graphs. For target motion at 16°/s (Fig. 7A), increasing the size of the stimulus caused an increase in the value of Δt that evoked the largest response in most MST neurons (filled symbols) but not in MT neurons (open symbols). Many MST neurons plot away from the y-axis, indicating that they retained a peak in the relationship between response and Δt at 16°/s. In Fig. 7B, however, many MST neurons cluster near the y-axis, indicating that the majority showed their largest responses for smooth or nearly smooth motion of a small stimulus at the faster speed of 32°/s. In contrast, the points for MT cells (open symbols) plotted above and below the line of slope 1.0 in equal numbers and near the origin of the graph, indicating that they had their best responses for small values of Δt for both large and small stimuli.
FIG. 7.
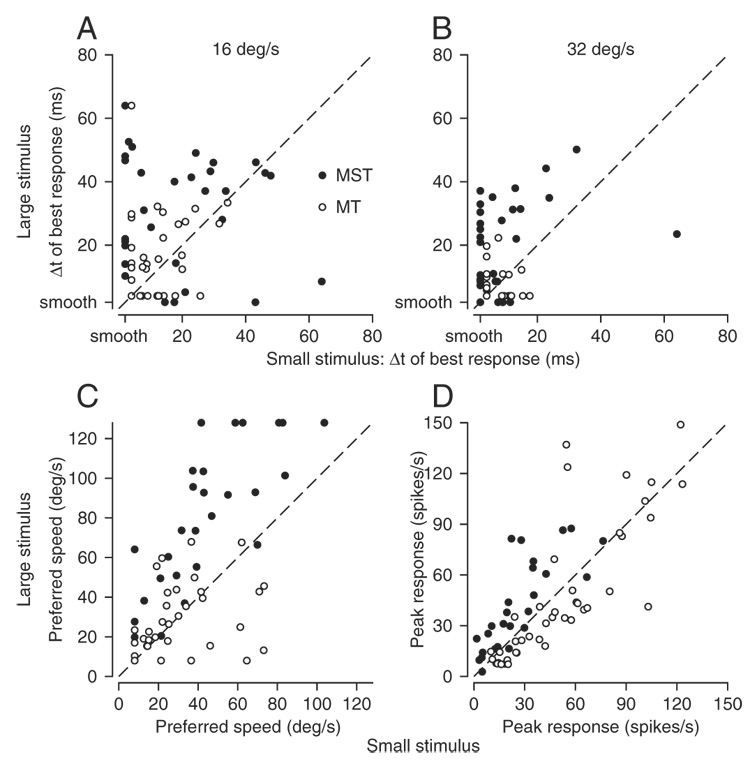
Quantitative comparison of the responses of MST and MT neurons to large vs. small stimuli. Each panel shows a scatterplot for one derived measure of neuronal response, where the measures for the large and small stimuli are plotted on the y-axis and x-axis, respectively. Filled and open symbols show data from 33 MST and 39 MT neurons that were studied with both the large and small stimuli. Oblique dashed lines have slopes of 1.0. A: value of Δt that evoked the largest response for apparent motion at 16°/s. B: value of Δt that evoked the largest response for apparent motion at 32°/s. In A and B, the ticks on the axes labeled “smooth” refer to apparent motion when Δt was 2 ms, effectively smooth motion. C: preferred speed for smooth stimulus motion. D: largest opponent response for smooth motion.
Increasing the size of the stimulus also increased the preferred speed of many MST neurons. In a scatterplot of preferred speed for the large versus small stimulus (Fig. 7C), almost all MST neurons plot above the line of slope 1.0 (mean difference = 31°/s, t-test, P < 0.001), whereas MT neurons are situated evenly above and below the line. Finally, Fig. 7D plots the peak firing rate of each neuron for the large stimulus as a function of that for the small stimulus. Although responses to the large stimulus were larger in almost all MST neurons, the difference is only infrequently profound. Thus the responses of MST neuron to small patches were not so diminished as to be considered noise. For MT neurons, responses were usually slightly larger for the smaller stimulus, but again the difference was small compared with the magnitude of the overall response.
In summary, our samples of MT and MST neurons show two differences that cannot be explained simply by the size of the stimulus. MT neurons have, as a population, lower preferred speeds as well as lower values of best Δt across the range of preferred speeds. We cannot exclude the possibility that either of these differences might have resolved partly if we had sampled from parts of MT that represented more eccentric positions in the visual field.
Mapping the neural codes in MT and MST onto pursuit behavior
As part of their analysis of the responses of MT neurons to apparent motion stimuli, Churchland and Lisberger (2001) showed that the eye acceleration at the initiation of pursuit varied as a function of Δt and apparent speed (Fig. 8A). They also showed that the population response in MT could be decoded to reproduce pursuit’s estimates of target speed as a function of Δt, but only if the population response was pooled using a computation that implemented a vector average based on the opponent response of each neuron
| (1) |
where and are, respectively, the responses of a given MT neuron to motion in its preferred and null directions normalized to the responses to smooth motion; si is the neuron’s preferred speed; and ε is the single free parameter. The success of Eq. 1 is illustrated in Fig. 8B, which plots the results of decoding the responses of our new sample of MT neurons to the 30 × 30° stimulus. The estimate of target speed shows peaks that are at the same values of Δt, but are slightly smaller than those found in the previous analysis of behavior (Fig. 8A). For the graph in Fig. 8B, the value of ε was 14.8 and 15.6% of the summed opponent response to smooth motion in the population for target motion at 16 and 32°/s, respectively. A treatment of the sensitivity of Eq. 1 to the value of ε appears in Churchland and Lisberger (2001).
FIG. 8.
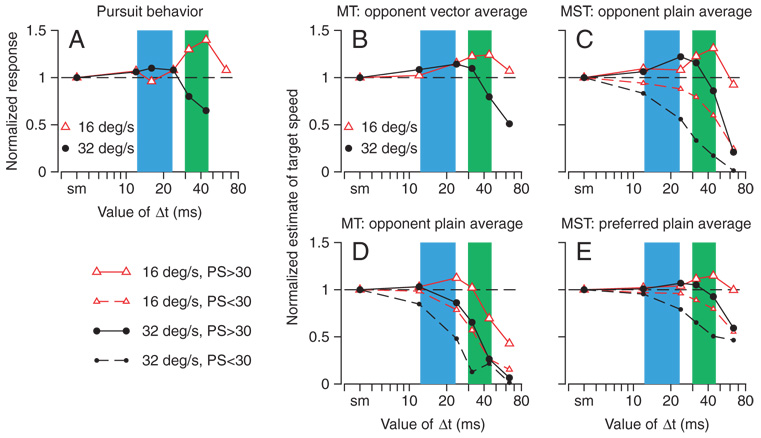
Computational analysis of the relationship among the population responses in MT and MST and the estimates of target speed expressed in the initiation of pursuit eye movements. All graphs plot estimates of target speed as a function of the value of Δt, where red and black traces show responses to target motion at 16 and 32°/s. A: normalized pursuit response to apparent motion stimuli, replotted from Fig. 1A. Green and blue shaded areas in all the graphs indicate the range of values of Δt that evoked the largest pursuit at 16°/s (green) or 32°/s (blue) in the 2 monkeys of Churchland and Lisberger (2001). B: normalized estimate of target speed computed as the opponent vector average of all 39 MT neurons recorded with the 30 × 30° texture. C: normalized estimate of target speed computed as the average opponent response across the population of MST neurons during apparent motion stimuli. D: normalized estimate of target speed computed as the average opponent response across the population of 39 MT neurons during apparent motion stimuli. E: normalized estimate of target speed computed as the average preferred direction response across the population of MST neurons during apparent motion stimuli. Key in the bottom left of the figure refers to C–E. In C–E, large and small symbols show estimates of speed based on responses of neurons with preferred speeds faster than or slower than 30°/s, respectively. Ticks on the x-axes labeled “smooth” refer to apparent motion when Δt was 2 ms for recordings from MST neurons and 4 ms for pursuit and for recordings from MT neurons.
Figure 8D evaluates a pooling computation based on simple averaging of the opponent responses of specific groups of neurons in our new sample from the MT population
| (2) |
where n is the number of neurons in the group used for each analysis. In Eq. 2, the normalized opponent responses of individual neurons are not weighted by their preferred speeds, nor is their summed response divided by the total opponent signal in the population (as in Eq. 1). When applied to the same population of MT neurons used to obtain Fig. 8B, Eq. 2 is less successful at reproducing the magnitude and location of the peaks seen in the behavior. It fails completely to predict a peak in the relationship between estimated target speed and Δt for target motion at 32°/s when the estimate is based on the responses of MT neurons with preferred speeds >30°/s (Fig. 8D, large black circles). It predicts a peak for the response to motion at 16°/s (Fig. 8D, large red triangles), but the peak is small and does not coincide with the green shaded areas that represent the peaks found in pursuit and perceptual behaviors at this target speed. Equation 2 also did not predict the peaks at all when pooling was based only on MT neurons that preferred speeds <30°/s (small triangles and circles). The small peak in the relationship between estimates of target speed and Δt for MT neurons with preferred speeds in excess of 30°/s (Fig. 8D, large red triangles) arises from peaks in the relationship between opponent response and Δt in a few MT neurons. Both the peaks in the single neuron response and the peak in the estimate of target speed disappeared when we used data obtained from the same MT neurons for the smaller visual stimulus.
When applied to the responses to large stimuli for MST neurons with preferred speeds in excess of 30°/s, the averaging of opponent responses described by Eq. 2 successfully predicts both the magnitude and location of peaks in the relationships between estimated target speed and Δt (Fig. 8C, large circles and triangles). In agreement with the data from pursuit and with the vector average of the opponent responses in MT, the peak response for apparent motion at 16°/s corresponded to a larger value of Δt than the peak value for motion of 32°/s (compare Fig. 8C with Fig. 8, A and B). The same pooling computation was not successful when applied to MST neurons with preferred speeds <30°/s (Fig. 8C, small circles and triangles). Using a cutoff speed of 30°/s to separate the MST neurons into two populations was not necessary: increasing or decreasing the cutoff speed moved the size of the peaks up and down but did not dramatically change their locations or existence.
Finally, averaging the responses of MST neurons to motion in the preferred direction (Fig. 8E), rather than the opponent responses, mapped somewhat more successfully onto the illusion found in the behavioral experiments than did simple averaging of the opponent responses of MT neurons (Fig. 8D), but less successfully than simple averaging of the opponent responses of MST neurons (Fig. 8C). When averaging of preferred responses was based on neurons with preferred speeds in excess of 30°/s, peaks persisted in the relationship between estimated target speed and the value of Δt, but the amplitudes of the peaks were diminished relative to decoding based on averaging the opponent responses of MST neurons. When Eq. 2 was applied to the opponent responses of MST neurons to small stimuli, the estimates of target speed were similar to those in Fig. 8E (data not shown). They retained small peaks at the appropriate values of Δt, but the peaks were smaller than those obtained from the opponent responses to large stimuli (Fig. 8C).
In summary, the responses of MT neurons map well onto the behavioral illusion of increased target speed for apparent motion if the population response is decoded using vector averaging, but not if using simple averaging. This is true for the population responses to the small stimuli used in the earlier behavioral analyses (Churchland and Lisberger 2001) and for the large stimuli used for unit recordings in the present paper. The responses of MST neurons map well onto the behavioral illusion if the population response is decoded by simple averaging of the opponent firing. This is true for both the large and small stimuli, but the decoded MST response maps onto the behavioral illusion better for the large stimulus. The comparisons between the decoded population responses and the behavioral illusions are limited by the fact that the behavior was studied with only small stimuli. However, our point is that there is a difference in the way target speed is represented in MT versus MST and this difference is valid irrespective of whether the behavior itself is driven by the output of MST.
DISCUSSION
Rate codes versus place codes in MST
The question of whether a given area provides a rate code or a place code for stimulus speed can be answered only by knowing how that code is decoded by other areas in the nervous system to estimate target speed. Thus our criterion for a place or rate code is based on demonstrating what kinds of decoding computations will and will not map the population response onto perceptual and/or motor estimates of target speed. We would consider a population to contain a place code if target speed can be estimated from the population response only by estimating the preferred speed of the most active neurons (i.e., a vector average or winner-take-all computation). We would say that a population contained a rate code if target speed can be estimated simply by averaging the responses (or opponent responses) of a given population of neurons.
We started our experiments with the knowledge that degrading the target motion by increasing the temporal separation between flashes of apparent motion causes an illusion where both pursuit eye movements and perceptual judgments estimate that a target is moving faster than its actual speed. The present analysis shows that averaging the responses of a subset of MST neurons produces an estimate of target speed that maps onto the illusion. Our previous analysis showed that the illusion could not be reproduced simply by averaging the responses of different subgroups of MT neurons (Churchland and Lisberger 2001). Our new sample of MT neurons confirms our earlier analysis with the same large visual stimulus used when we recorded from MST. Our analyses also indicate that the size of the visual stimulus has some effect on how well and poorly the population responses in MST and MT map onto the behavioral illusions. For a large, 30 × 30° motion stimulus, the population response in MST is an excellent rate code that maps well onto the behavioral illusion; the population response in MT is an excellent place code but forms a poor rate code that shows only one of the features of the behavioral illusion. For a small, 8 × 8° motion stimulus, the population code in MST is a good but imperfect rate code for target speed that maps imperfectly onto the behavioral illusion, whereas that in MT does not serve as a rate code at all. Thus we conclude that the population response in area MST could be used as a rate code for target speed, whereas that in the MT neurons cannot, and that the features that make MST workable as a rate code for target speed become expressed in their most complete form when the motion stimulus is large. Thus motion signals are transformed between MT and MST and the transformation may depend partly on spatial summation across the receptive field of MST neurons.
Our data also reveal why the population in MST forms a rate code for target speed. The responses of a subset of individual MST neurons parallel the behavioral estimates of target speed in the sense that firing rate increases for values of Δt that cause monkeys and humans to respond as if the targets were moving faster. In contrast, the responses of neurons in V1 and most MT neurons decrease as a function of Δt (MT only, Churchland and Lisberger 2001; MT and V1, Newsome et al. 1986). As a result, the population response in MT tracks the illusion of increased target speed only when decoded by computations that find the preferred speed of the most active neurons (Churchland and Lisberger 2001).
One additional feature of the responses of MST neurons fulfills a condition that would be expected for a rate code for target speed. As reported here and by others (Churchland and Lisberger 2005; Kawano et al. 1994), many neurons in MST prefer fast speeds: in contrast to the tuned responses of MT neurons (Maunsell and Van Essen 1983; Perrone and Thiele 2001), they show a monotonically increasing relationship between firing rate and image speed over a wide range of speeds, at least over the range of speeds we tested, ≤128°/s. In contrast, tuned responses cannot serve as a rate code because it is not possible to distinguish two speeds that fall on the rising and falling arms of the tuning curve but cause the same neural response amplitude. As a result, simple averaging of the opponent responses of the population of MST neurons to smooth motion over a wide range of target speeds estimates speed well, whereas it is necessary to perform a computation that is equivalent to vector averaging of the opponent responses of the population of MT neurons to produce an estimate that increases monotonically as a function of target speed.
Attempts to reproduce the estimates of target speed by the motor and perceptual systems from the population response in MST were more successful when we used computations based on opponent motion signals. Thus it might be slightly misleading to conclude that the population response in MST itself is a rate code for target speed because the site of the decoding computation would be required to do more than simply average the responses of the population of MST neurons. Instead, the site of the decoding computation would have to take the average of the difference between the responses of populations of neurons that prefer motion in opposite directions.
Vector-averaging transformations between MT and MST?
Our data show that the transformation of signals related to target speed between areas MT and MST parallels the transformation that occurs in converting the population response in MT into behavior. If the population response in MT cannot be averaged to create signals that lead to pursuit and perception, then simple averaging also cannot create responses in MST that map onto the illusory estimates of increased target speed by pursuit and perception. Instead, we propose that the rate code for speed in MST neurons is created by applying the neural equivalent of vector averaging to transform the place code in MT.
There are many groups of neurons in MST with widely varying response properties and we are proposing that a small subgroup represents the culmination of a vector-averaging decoding of the place code for image speed in MT. The candidate MST neurons are strongly responsive to image motion during fixation, have preferred speeds >30°/s, and often show monotonic relationships between response and target speed up to the fastest stimulus we used, which was 128°/s. We do not know whether these MST neurons contribute to either pursuit eye movements or perception; they might, but they also may be part of a neural pathway that runs in parallel with those for the behaviors we previously analyzed. Indeed, the fact that the MST population works best as a rate code for large motion stimuli means that these neurons may not be interposed between MT and the motor circuits for pursuit. In any event, the important point is that a subset of MST neurons behave as if they were estimating the preferred speed of the largest opponent responses from MT. Because MT provides a large input to MST (Boussaoud et al. 1990; Ungerleider and Desimone 1986), it seems likely that the responses of this small group of MST neurons are derived by decoding the population response in MT. Identification of the relevant MST neurons enables experiments to study the processing that leads to their veridical representation of target speed.
It is tempting to think of the MT/MST border as the site of a transformation from a place code to a rate code. However, it seems more likely that the conversion from a place code to a rate code for speed is distributed, starting in MT and ending in MST. A distributed transformation might be expected because a considerable amount of neural computation appears to be necessary to complete the transformation. To decode speed from MT, neural circuits must perform computations that are equivalent to estimating an opponent motion signal, computing a weighted sum, and normalizing for the magnitude of the opponent signal across the active population. Several neural steps might be required and many neurons might be expected to reflect intermediate stages in the transformation. Some evidence for intermediate neural steps and partial conversion from a place code to a rate code comes from the fact that a few neurons in MT give hints of the responses that would allow them to contribute to a rate code: they have higher preferred speeds and small peaks in the relationship between firing rate and Δt. Further, many neurons in MST lack these features: we find wide variation across MST neurons in 1) the size of the peak in the relationship between firing rate and Δt and 2) the relationship between the value of Δt at the peak response and the neuron’s preferred speed. Similar distributed transformations appear to occur between V1 and MT for the veridical representation of target speed versus spatial and temporal frequency (Priebe et al. 2006) and in MT for the creation of pattern direction selectivity (Rust et al. 2005).
Alternative explanations
Our data leave unresolved the possibility that the differences between the neural codes for target speed in MT and MST neurons may depend simply on the range of preferred speeds or the spatial extent of the inputs to an MST neuron. An MST neuron that receives inputs from MT neurons with a limited range of preferred speeds might be able to decode a veridical estimate of speed only within that range, such as only on the rising arm of its speed tuning curve. Our comparison of responses to large and small stimuli provided data consistent with this scenario. For smaller stimuli of the same size used to study MT, the population of MST neurons provides a less good rate code for target speed: the estimates of target speed obtained by averaging the responses of MST neurons to apparent motion of smaller stimuli underestimated the size of the peaks seen in the behavioral illusions. Further, with the smaller stimuli, it was less common to observe monotonically increasing speed tuning and preferred speeds tended to be smaller. Perhaps MST neurons are able to convert a place code to a rate code because they sum over a large region of visual space. Small stimuli restrict the number of active MT neurons and the range of their preferred speeds and might preclude the full expression of decoding from a place to a rate code.
The effects of apparent motion stimuli on the responses of MST neurons are unlikely to be a consequence of nondirectional responses to aberrant “motion energy” contained in the stimulus (Watson and Ahumada 1985). Although sampled motion does cause spatiotemporal aliasing that could excite sensors tuned for fast speeds (Castet 1995), available data fail to support the suggestion that this mechanism is the basis of the illusion we have studied. First, in MT, the neural basis of the illusion is a decrease in the directional response of slow-tuned neurons, not a nondirectional increase in the response of fast-tuned neurons (Churchland and Lisberger 2001). Second, in MST, increases in the value of Δt caused an increase in the directional responses of the fast-tuned MST neurons, something that could not be caused by nondirectional motion energy. Thus it seems most likely that the responses of MST neurons to apparent motion stimuli reflect a transformation of the signals available from MT.
Representations of the visual scene in MST
Our observations extend the idea that motion signals from area MT are transformed to generate sensitivity to complex stimuli in MST. Accordingly, some of the stimuli that drive a subset of MST neurons best are combinations of spiral motion and expansion that might constitute major components of visual signals caused by self-motion (Duffy and Wurtz 1991; Graziano et al. 1994; Orban et al. 1995). Neurons with different response properties may result from different transformations of the inputs from MT and probably represent different features of the visual scene. Perhaps all the representations in MST are contrived to provide signals that are veridical in the sense that the responses of single neurons are better related to real-world stimuli than those in MT. Veridical signals about real-world motion then could be used by multiple systems to guide both perception and action. The particular group of neurons we have studied provides a rate code for the speed of target motion that can be derived from the place code that exists in MT and that maps well onto estimates of target speed seen in pursuit eye movements and perception. To create the rate code, we suggest that the place code in area MT is transformed into the rate code in MST by a neural computation that implements the equivalent of vector averaging.
ACKNOWLEDGMENTS
We are indebted to M. Churchland for inspiration, helpful discussions, and the opportunity to reanalyze the MT data. We thank K. MacLeod, E. Montgomery, S. Tokiyama, L. Bocskai, K. McGary, and S. Ruffner for technical assistance.
GRANTS
This work was supported by National Eye Institute Grant EY-03878 and the Howard Hughes Medical Institute.
REFERENCES
- Boussaoud D, Ungerleider LG, Desimone R. Pathways for motion analysis: cortical connections of the medial superior temporal and fundus of the superior temporal visual areas in the macaque. J Comp Neurol. 1990;296:462–495. doi: 10.1002/cne.902960311. [DOI] [PubMed] [Google Scholar]
- Castet E. Apparent speed of sampled motion. Vision Res. 1995;35:1375–1384. doi: 10.1016/0042-6989(95)98717-n. [DOI] [PubMed] [Google Scholar]
- Churchland AK, Lisberger SG. Relationship between extraretinal component of firing rate and eye speed in area MST of macaque monkeys. J Neurophysiol. 2005;94:2416–2426. doi: 10.1152/jn.00195.2005. [DOI] [PMC free article] [PubMed] [Google Scholar]
- Churchland MM, Lisberger SG. Apparent motion produces multiple deficits in visually guided smooth pursuit eye movements of monkeys. J Neurophysiol. 2000;84:216–235. doi: 10.1152/jn.2000.84.1.216. [DOI] [PMC free article] [PubMed] [Google Scholar]
- Churchland MM, Lisberger SG. Shifts in the population response in the middle temporal visual area parallel perceptual and motor illusions produced by apparent motion. J Neurosci. 2001;21:9387–9402. doi: 10.1523/JNEUROSCI.21-23-09387.2001. [DOI] [PMC free article] [PubMed] [Google Scholar]
- Churchland MM, Priebe NJ, Lisberger SG. Comparison of the spatial limits on direction selectivity in visual areas MT and V1. J Neurophysiol. 2005;93:1235–1245. doi: 10.1152/jn.00767.2004. [DOI] [PMC free article] [PubMed] [Google Scholar]
- Duffy CJ, Wurtz RH. Sensitivity of MST neurons to optic flow stimuli. I. A continuum of response selectivity to large-field stimuli. J Neurophysiol. 1991;65:1329–1345. doi: 10.1152/jn.1991.65.6.1329. [DOI] [PubMed] [Google Scholar]
- Fuchs AF, Luschei ES. Firing patters of abducens neurons of alert monkeys in relationship to horizontal eye movement. J Neurophysiol. 1970;33:382–392. doi: 10.1152/jn.1970.33.3.382. [DOI] [PubMed] [Google Scholar]
- Graziano MS, Andersen RA, Snowden RJ. Tuning of MST neurons to spiral motions. J Neurosci. 1994;14:54–67. doi: 10.1523/JNEUROSCI.14-01-00054.1994. [DOI] [PMC free article] [PubMed] [Google Scholar]
- Groh JM. Converting neural signals from place codes to rate codes. Biol Cybern. 2001;85:159–165. doi: 10.1007/s004220100249. [DOI] [PubMed] [Google Scholar]
- Hubel DH, Wiesel TN. Sequence regularity and geometry of orientation columns in the monkey striate cortex. J Comp Neurol. 1974;158:267–293. doi: 10.1002/cne.901580304. [DOI] [PubMed] [Google Scholar]
- Kawano K, Shidara M, Watanabe Y, Yamane S. Neural activity in cortical area MST of alert monkey during ocular following responses. J Neurophysiol. 1994;71:2305–2324. doi: 10.1152/jn.1994.71.6.2305. [DOI] [PubMed] [Google Scholar]
- Komatsu H, Wurtz RH. Relation of cortical areas MT and MST to pursuit eye movements. I. Localization and visual properties of neurons. J Neurophysiol. 1988;60:580–603. doi: 10.1152/jn.1988.60.2.580. [DOI] [PubMed] [Google Scholar]
- Maunsell JH, Van Essen DC. Functional properties of neurons in middle temporal visual area of the macaque monkey. I. Selectivity for stimulus direction, speed, and orientation. J Neurophysiol. 1983;49:1127–1147. doi: 10.1152/jn.1983.49.5.1127. [DOI] [PubMed] [Google Scholar]
- Newsome WT, Mikami A, Wurtz RH. Motion selectivity in macaque visual cortex. III. Psychophysics and physiology of apparent motion. J Neurophysiol. 1986;55:1340–1351. doi: 10.1152/jn.1986.55.6.1340. [DOI] [PubMed] [Google Scholar]
- Orban GA, Lagae L, Raiguel S, Xiao D, Maes H. The speed tuning of medial superior temporal (MST) cell responses to optic-flow components. Perception. 1995;24:269–285. doi: 10.1068/p240269. [DOI] [PubMed] [Google Scholar]
- Perrone JA, Thiele A. Speed skills: measuring the visual speed analyzing properties of primate MT neurons. Nat Neurosci. 2001;4:526–532. doi: 10.1038/87480. [DOI] [PubMed] [Google Scholar]
- Preibe NJ, Lisberger SG, Movshon JA. Tuning for spatiotemporal frequency and speed in directionally selective neurons of macaque striate cortex. J Neurosci. 2006;26:2941–2950. doi: 10.1523/JNEUROSCI.3936-05.2006. [DOI] [PMC free article] [PubMed] [Google Scholar]
- Ramachandran R, Lisberger SG. Normal performance and expression of learning in the vestibulo-ocular reflex (VOR) at high frequencies. J Neurophysiol. 2005;93:2028–2038. doi: 10.1152/jn.00832.2004. [DOI] [PMC free article] [PubMed] [Google Scholar]
- Rust NC, Simoncelli EP, Movshon JA. How macaque MT cells compute pattern motion. Soc Neurosci Abstr. 2005:591.11. [Google Scholar]
- Saito H, Yukie M, Tanaka K, Hikosaka K, Fukada Y, Iwai E. Integration of direction signals of image motion in the superior temporal sulcus of the macaque monkey. J Neurosci. 1986;6:145–157. doi: 10.1523/JNEUROSCI.06-01-00145.1986. [DOI] [PMC free article] [PubMed] [Google Scholar]
- Tanaka K, Hikosaka K, Saito H, Yukie M, Fukada Y, Iwai E. Analysis of local and wide-field movements in the superior temporal visual areas of the macaque monkey. J Neurosci. 1986;6:134–144. doi: 10.1523/JNEUROSCI.06-01-00134.1986. [DOI] [PMC free article] [PubMed] [Google Scholar]
- Ungerleider LG, Desimone R. Cortical connections of visual area MT in the macaque. J Comp Neurol. 1986;248:190–222. doi: 10.1002/cne.902480204. [DOI] [PubMed] [Google Scholar]
- Watson AB, Ahumada AJ., Jr Model of human visual-motion sensing. J Opt Soc Am A. 1985;2:322–341. doi: 10.1364/josaa.2.000322. [DOI] [PubMed] [Google Scholar]