Abstract
Atherosclerotic lesions preferentially originate in arterial regions that experience low wall shear stress (WSS) and reversing flow patterns. Therefore, routinely monitoring arterial WSS may help to identify the potential sites of early atherosclerosis. A new non-invasive ultrasonic method implemented with coded excitation techniques was utilized to improve WSS estimation accuracy and precision by providing high spatial and temporal resolution. WSS measurement errors were quantified in a model system by scanning a linearly-varying WSS field (0.3–1.9 Pa) within a flow chamber. A 13-bit Optimal code was found to be most effective in reducing bias and standard deviation in WSS estimates down to ~ 10 % and ~ 8 %. The measurement errors slowly increased with input WSS for all imaging pulses. The expression of endothelial cellular adhesion molecules VCAM-1 and E-selectin was investigated over a similar shear range (0–1.6 Pa) in order to study the impact of relating shear-mediated cellular adhesion molecule (CAM) expression to inaccuracies in WSS measurements. We quantified this influence as the prediction error, which accounts for the ultrasonic measurement errors and the sensitivity of CAM expression within certain shear ranges. The highest prediction errors were observed at WSS < 0.8 Pa, where CAM expression is most responsive to WSS. The results emphasize the importance of minimizing estimation errors, especially within low shear regions. Preliminary 2-D in vivo shear imaging is also presented to provide information about the spatial heterogeneity in arterial WSS distribution.
Keywords: blood velocity estimation, cell adhesion molecules, coded-pulse excitation, range lobes, time-bandwidth product
INTRODUCTION
Atherosclerosis is an inflammatory disease of the arterial wall that originates preferentially in regions of branching and curvature where the time-averaged wall shear stress (WSS) is lower than 0.4 Pa (Nerem, 1992; Farmer and Torre-Amione, 2002). WSS is defined as the product of blood viscosity and wall shear rate (WSR), the radial velocity gradient measured at the vessel wall. The body maintains a narrow physiological WSS range of 1.2–1.7 Pa through actions of the mechanically-responsive endothelium that preserves the homeostasis of blood vessel structure and function (Giddens et al., 1993). Therefore, routinely monitoring vascular WSS may be useful for identifying potential sites of early atherosclerotic plaque formation. In situations where blood viscosity can be assumed as constant, as is typically the case in the medium and large arteries (Reneman et al., 2006), WSR imaging provides information equivalent to WSS.
Non-invasive medical ultrasound imaging has been widely used for visualizing blood flow patterns (Hoeks et al., 1995) and locating atherosclerotic plaques (Couturier et al., 2006). However, the accuracy of ultrasonic WSR estimates is limited by tissue clutter, low sensitivity to slow-flow velocities, and spatial resolution (signal bandwidth) (Reneman et al., 2006; Tsou et al., 2006). To improve estimation performance for WSR measurements, one must be able to estimate blood velocity near the vessel wall with low measurement errors. Previously (Tsou et al., 2006), we showed that the bias or variance of WSR estimates can be reduced in laboratory measurements by applying broadband coded-pulse excitation techniques and a regularized cross-correlation velocity estimation method. This paper describes further implementation of this imaging algorithm combined with phase-modulated (PM) and frequency-modulated (FM) pulse codes on a commercial imaging system (Siemens Antares, Siemens Medical Solutions, Mountain View, CA) that provides a better echo signal-to-noise ratio (eSNR), dynamic range, lateral spatial resolution, frame rate and a wider range of pulse repetitive frequencies. Studies were conducted both on two-dimensional flow-chamber phantoms and on human volunteers.
Our early work has shown that ultrasonic WSR estimation errors vary with the input shear stress while viscosity remains constant (Tsou et al., 2006). In vivo, arterial WSS changes in both space and time. In the present research, we studied the effects of a non-uniform WSS field by building a flow chamber that provides a temporally-steady but spatially-varying shear field and that covers the atherogenic (< 0.4 Pa) and atheroprotective (> 1.2 Pa) shear ranges (Malek et al., 1999) and values in between. Similar to the chamber previously proposed by Usami et al. (Usami et al., 1993), our device generates a known, linearly decreasing WSS through the use of a slowly expanding flow channel. Thus, one set of measurements on a single chamber can provide a wide range of shear field measurements.
From our previous studies (Tsou et al., 2007, in press), we found regions of low WSS exhibit amplified upregulation of cellular adhesion molecules (CAMs) , VCAM-1 and E-selectin, which may increase monocyte capture and initiate the development of atherosclerosis. On the contrary, higher shear stress prevents the process of atherogenesis by suppressing the expression of these two CAMs to a low baseline level. With data collected from the proposed flow chamber providing information on how flow conditions affect WSR measurement errors, we are further interested in establishing how these errors propagate into the uncertainty in predicting the change in expression of VCAM-1 and E-selectin that leads to the inflammatory response and consequently atheroma. To address this issue, we draw upon another recent in vitro study (Tsou et al., 2007, in press) employing the same flow chamber geometry on cultured human aortic endothelial cells (HAEC) where distinct changes in atherosclerosis-related and monocyte adhesion efficiency were observed as responsive to changes in magnitude and gradients of WSS.
At the end of the paper, a connection between shear-dependent ultrasonic WSR estimation errors and shear-sensitive endothelial function is established. The ultimate goal of this paper is to assess the influence of ultrasonic WSR estimation errors on the prediction of shear-mediated endothelial function and associated inflammatory responses.
METHODS
Linear Hele-Shaw WSS flow chamber
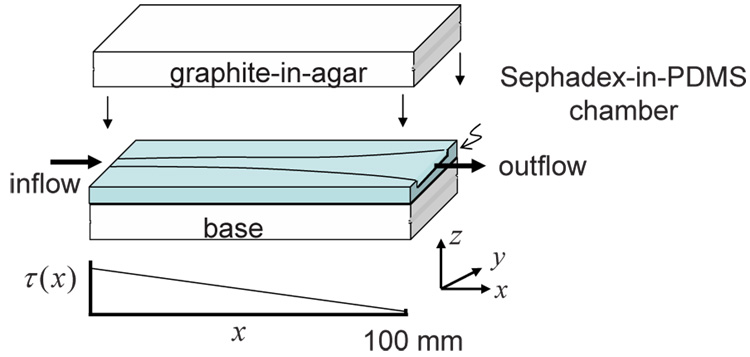
The flow chamber generates a WSS field that varies approximately linearly along its length as schematically depicted in Fig. 1 (a). The flow channel has a constant height h = 3 mm throughout its 130-mm length, an entrance width w0 = 3 mm, and an exit width w1 = 9 mm. The channel width w increases along the length axis x according to w = 150w0/(150 − x) mm for 0 ≤ x ≤ 100 mm. The channel width is a constant of 9 mm for 100 ≤ x ≤ 130 mm. The expanding channel width creates a lateral (y-direction) flow profile that varies, beginning with parabolic flow at x = 0 mm and ending with blunt flow at x = 100 mm. Computational fluid dynamics (CFD) simulations were performed to obtain more accurate flow field information. The flow channel design was first created using AutoCAD (AutoDesk Inc, San Rafael, CA), optimized using CFD, and the best design was molded out of machined plastic. The chamber material was poly-dimethylsiloxane (PDMS) (Slygard 184, Dow Corning) at a 5:1 ratio of base to curing agent. PDMS was selected over agar and gelatin due to its flexible yet sturdy material properties after curing. The drawback is the high acoustic attenuation. Therefore, casting a thin layer (< 1 mm) of PDMS at the top and bottom of the flow channel minimized ultrasonic echo-signal losses. The PDMS also contained Sephadex G-100 microspheres (Sigma-Aldrich, St. Louis, MO) at a concentration of 3 % by mass to generate ultrasonic scattering. The Sephadex-PDMS mixture cured after 1 hour of baking at 75 °C. Tissue-mimicking graphite-agar blocks pressed onto the top and bottom chamber surfaces provided rigidity to the walls.
1.
Flow chamber geometry and the corresponding shear stress field (τ) along the longitudinal axis (x) at the bottom plate of the flow chamber. The PDMS chamber contains Sephadex scatterers, and is surrounded by a graphite-agar ultrasonic phantom medium.
Computational fluid dynamics simulations
Geometry and mesh generation
A mold of the flow channel volume was utilized to form a volume grid for CFD simulations. Separate computational meshes were created within the 100-mm expanding width section of the channel and the 9-mm constant width section at the end (Fig. 1). The constant width section prevented back flow disturbance due to mismatched flow impedance at the outlet connector. Since flow is symmetric about the central axes of the channel, we simulated flow in only one quarter of the cross sectional area to reduce computational time and attain high spatial resolution. The CFD mesh was created using object-defining nodes from which a surface mesh was then generated. Finally a volume mesh using a structured grid was produced. The number of nodes chosen balanced the need for spatial resolution and reasonable computation time. The mesh was progressively refined so that the ultimate flow solution presented here was mesh independent. It took around two hours on a Pentium IV 2.8 GHz processor to complete a set of CFD simulations for determining the flow field in the quarter-model of the flow chamber.
Initial and boundary conditions
The commercial software Fluent (Fluent Inc, Lebanon, NH) was used for the CFD simulations. The parameters were those used in ultrasound experiments. At the flow inlet, a uniform flow velocity of 200 mm/s was applied normal to the chamber cross-section. Chamber walls were assumed to be rigid and a no-slip condition was applied. At the outlet, the flow was assumed to be fully developed. The 200 mm/s average flow velocity input into the channel was selected because, based on parallel plate flow chamber studies, it is expected to create a linear wall shear stress range of 0.3 – 1.8 Pa within the expanding section. This range covers both the low-shear atherogenic (< 0.4 Pa) and high-shear atheroprotective (> 1.2 Pa) regimes.
Governing Equations
Shear rates in large arteries are sufficiently large to assume that blood behaves as a Newtonian fluid (Fung, 1993). The blood-mimicking fluid material (RG Shelley Ltd, Ontario, Canada) used in the experiments is also a Newtonian fluid (Ramnarine et al., 1998). Therefore, flow in the chamber is governed by the mass and linear momentum conservation equations for an incompressible viscous Newtonian fluid:
| (1) |
where V is the velocity vector, p is pressure, t is time, ρ is fluid density, and ν is fluid kinematic viscosity. The flow density and viscosity were constant with ρ= 1050 kg/m3 and ν= 0.003 Pa-s. The Reynolds number (Re) based on the inlet velocity and entrance width was 180.
Acoustic properties of PDMS
To predict the echo-signal loss from acoustic propagation through PDMS, longitudinal sound speed and attenuation coefficients were estimated in water at room temperature. We used a substitution technique (Madsen et al., 1982), where the phase and amplitude of narrow-band pulses transmitted through different layer thicknesses of PDMS in water were measured. For each attenuation estimate, signals from two samples of different thicknesses were compared, instead of comparing signals with and without a PDMS layer, to minimize estimation bias from refractive losses.
Results are summarized in Table 1 over the diagnostic imaging frequency range. The speed of sound in PDMS is significantly lower than that in water. The impedance difference between PDMS and water could be reduced somewhat by increasing the stiffness using a greater amount of prepolymer curing agent. Changing the ratio of the curing agent to the polymer base from 1:10 to 1:5 increased the sound speed by just 4% and decreased the attenuation coefficient at all frequencies. However, the values remained very different from biological tissues. Nevertheless the mechanical properties of PDMS for the flow channel offer major advantages. Acoustic losses were minimized by imaging through a 1-mm thick PDMS layer.
Table 1.
Acoustic properties of PDMS
| Speed of sound (m/s) | Attenuation coefficient (dB/cm) | |||||
|---|---|---|---|---|---|---|
| 3 MHz | 5 MHz | 7 MHz | 9 MHz | 11 MHz | ||
| PDMS (5:1) | 1119.1 | 9.8 | 14.86 | 23.38 | 31.94 | 39.61 |
| PDMS (7:1) | 1089.1 | 15.79 | 21.92 | 29.88 | 44.88 | 55.51 |
| PDMS (10:1) | 1076.5 | 10.14 | 21.30 | 33.57 | 47.85 | 64.33 |
Ultrasonic shear rate measurements
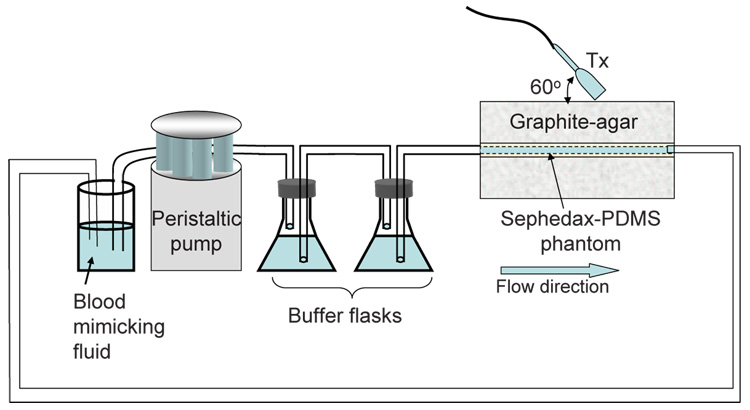
The experimental apparatus is shown in Fig. 2. Blood mimicking fluid was used as flow medium for the ultrasound experiments. The flow channel was separated from the peristaltic pump using two glass flasks in series that serve as a buffer to eliminate flow pulsatility and provide steady inlet velocity with a volumetric flow rate of 1.8 ml/s. A large-diameter tubing (8 mm) was connected to the 3×3-mm channel inlet so that the entering flow velocity profile was assumed to be blunt with an average velocity of 200 mm/s. The imaging Doppler angle was adjusted to 60°.
2.
Diagram of the ultrasound flow experiment.
A Siemens Antares system with an ultrasound research interface (URI) provided RF echo signals for off-line analysis. RF data were acquired in image planes along the cross section of the flow channel at 10 mm increments. The transmission frequency on the linear array was 8.9 MHz and the PRF was 3.5 kHz. Four groups of transmission pulses were programmed into the Siemens Antares using special manufacturer software: uncoded broadband imaging pulses (1 cycle), uncoded narrow band Doppler pulses (4 cycles), phase modulated (PM) code pulses (7 and 13-bit Optimal codes) (Ruprecht and Rupf, 1996), and frequency modulated (FM) code pulses (1.17 and 2.10 µs pseudo-chirps) (Liu and Insana, 2005). The transmission amplitude was the same for all pulses. The lateral resolution was 340 µm due to the same transmission frequency. Also the transmission energies of the PM and FM codes with similar durations were approximately equal. The received signals were decoded using matched filters to restore spatial resolution as described previously (Tsou et al., 2006).
Shear rate estimation
The velocity estimation algorithm used for WSR estimation was described and tested in our previous study (Tsou et al., 2006). Basically, displacements are estimated from echo data with an ensemble size of 12 acquired using coded pulses described above. Displacements are computed offline by minimizing the energy of an objective function with two terms. One term is based on the cross correlation function. The other is a smoothness constraint developed from the color-flow autocorrelation method. The second term regularizes the first to suppress noise. From displacements, angle-corrected velocity and WSR estimates are obtained. The strength of this velocity estimator relative to conventional Doppler methods is amplified near the wall of the flow channel or blood vessel.
Evaluation metrics
WSR estimation performance is evaluated based upon the bias and standard deviation of estimates. Relative percent bias is defined in terms of the ensemble mean of the values estimated WŜR and predicted WSR (Tsou et al., 2006):
| (2) |
The predicted WSR is obtained from CFD simulation results.
In vivo vascular shear rate imaging
Our method was also used to scan the left common carotid artery and left brachial artery of a healthy female volunteer in her twenties. The data acquisition was ECG triggered at peak systole and diastole in order to compare results among the four different imaging pulses. The Doppler angle was estimated to be around 50°. Data for 20 cardiac cycles were acquired for each measurement.
Shear-mediated cultured human aortic endothelial cell experiments
Cell culture experiments allowed us to study the impact of shear stress on the inflammatory reaction that usually occurs in the early stages of atherosclerosis. In developing a correlation between ultrasonic measurement errors and the corresponding change in endothelial function, the engineering aspect of ultrasonic error analysis and the biological investigation on EC function were performed in separate controlled experiments but under comparable shear flow conditions. The reason for separate ultrasound and EC experiments is the experimental difficulty in developing a flow system for shearing a large EC monolayer for 4 hours while monitoring ultrasonically under sterile conditions.
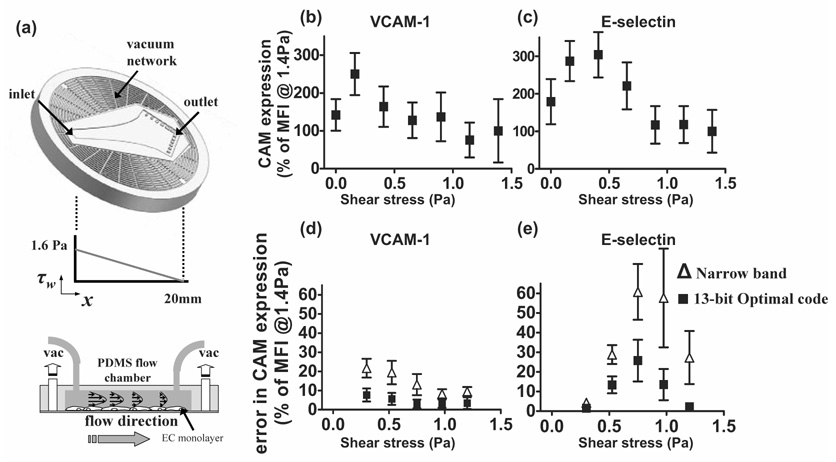
The details of the in vitro shear flow study are provided in our previous work (Tsou et al., 2007, in press). In brief, HAEC (Cascade Biologics, Portland, OR) at passage 6–7 were seeded on 1% gelatin-coated glass cover slips and reached confluence within 3 days. A scaled-down version of the PDMS Hele-Shaw flow chamber (100 µm high and 20 mm long) was utilized to deliver a linearly-varying shear field in the range of 0–1.6 Pa (Fig. 8 (a)). The flow medium contained 0.2% fetal bovine serum and Leibovitz-15 medium (GIBCO, Grand Island, NY) in order to maintain a physiological PH at 7.4 in the absence of CO2. 15% (wt/v) Ficoll PM 70 (Amersham Biosciences, Piscataway, NJ) was added to increase the medium viscosity to a level similar to that of blood (3.27 mPa-s). During the 4-hour shear flow experiment, the HAEC monolayer was continuously treated with a physiological dose of tumor necrosis factor (TNF)-α (0.3 ng/ml) to stimulate an inflammatory reaction as might occur in individuals at risk for the development of atherosclerosis. The cells were then incubated with appropriate fluorescently-labeled monoclonal antibodies. Quantitative mean fluorescence intensity (MFI) was estimated from each field of view (0.02 mm2) captured via immunofluorescence microscopy and was used to establish shear-mediated VCAM-1 and E-selectin expression.
8.
Cell adhesion molecule expression as a function of shear stress. (a) In vitro shear flow experiment setup. The center arrow-shape channel is the microfluidic flow chamber. The corresponding linear-decreasing shear field is plotted below. (b) VCAM-1 and (c) E-selectin expressions vary with the applied shear stress. Errors in predicting (d) VCAM-1 and (e) E-selectin expression resulted from the uncertainties in ultrasonic WSR measurements are plotted as functions of shear stress. Both uncoded (narrow-band spectral Doppler) and coded excitation (13-bit Optimal code) approaches are presented. (b) and (c) share the same axis labels and so as (d) and (e).
RESULTS
Computational fluid dynamic simulations
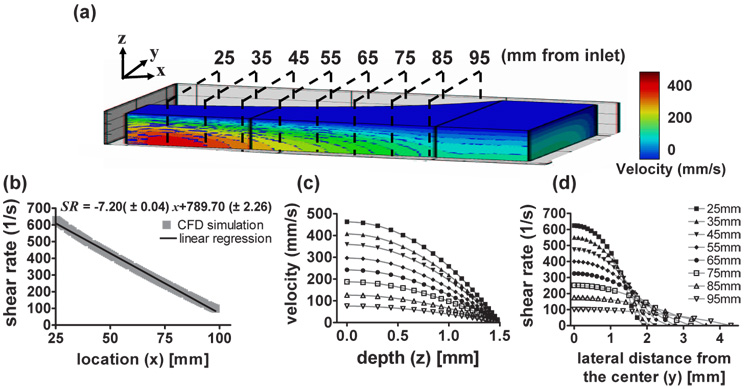
Fig. 3 (a) depicts computed velocity contours within the flow chamber. At any x, the velocity is maximal at the channel center as expected, and the velocity and WSR decrease progressively with x. A linear regression fit yields a correlation coefficient of 0.98 (Fig. 3 (b)). The estimated entrance length was 17 mm. Ultrasonic measurements were acquired at 10 mm increments (black dashed lines in Fig. 3 (a)) for 25 mm ≤ x ≤ 95 mm, where the flow was fully developed. Fig. 3 (c) shows the computed velocity profiles along the z axis at the positions marked in Fig. 3 (a). As expected, the velocity profiles are parabolic with maximum velocities at z = 0 (center of the channel). The estimated WSR profiles along the y axis are plotted in Fig. 3 (d). Near the entrance, the velocity profile in the y-direction is nearly parabolic. However, further downstream as the channel widens, the flow profile becomes blunter, similar to that of a conventional parallel-plate flow chamber geometry. Large areas near the end of the flow channel have approximately the same WSR.
3.
CFD simulation results. (a) Velocity contours within the flow channel. Black dashed lines indicate the ultrasound scan planes. The relative scale of x∶y∶z is 6∶1∶1. (b) Wall shear rate estimated at the bottom plate is a linear function of distance from the flow entrance along the center of the longitudinal axis. (c) Cross-sectional velocity profiles at different scan planes as a function of the z axis. (d) Wall shear rates are plotted along the y axis for different scan planes.
Ultrasonic velocity and WSR measurements
Examples of 2-D velocity and 2-D shear rate images acquired using a 2.1 µs pseudo-chirp pulse are shown in Fig. 4. Images were acquired at 85 mm (Fig. 4 (a), (c)) and 25 mm (Fig. 4 (b), (d)) downstream of the inlet. The velocity at 85 mm is 70 % lower than that at 25 mm due to the larger cross sectional area. Peak velocities are observed at the center of the channel where shear rates are minimal. The maximum shear rate is observed near the wall. Because the sound beam was parallel to the z axis, shear rates were estimated by taking the derivative of velocity with respect to z.
4.
2-D velocity images in the y – z plane at x = 85 mm (a) and x = 25 mm (b). Corresponding shear rate images at x = 85 mm (c) and x = 25 mm (d). In all cases, a 2.1 µs pseudo-chirp coded pulse was used.
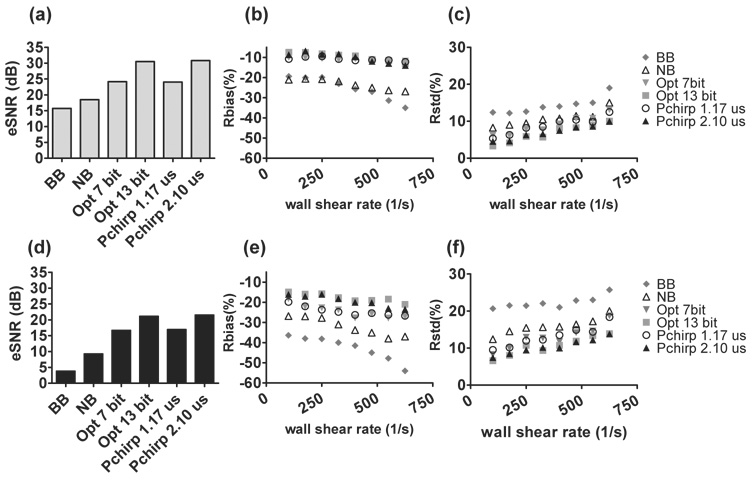
The performance of the WSR estimator was evaluated by comparing Rbias and Rstd measured for different transmission pulse types. Details of ultrasonic WSR measurements are found in Fig. 5. To compare the impact of change in transmitted power on WSR estimation, the pulse amplitude used to generate results in Fig. 5 (a)–(c) is three times that used in the results of Fig. 5 (d)–(f). eSNR inside the lumen was estimated via (Tsou et al., 2006)
| (3) |
The noise-free echo signal g was obtained by averaging 50 RF frames, which noise n was found from the difference between the average echo signal and any one realization.
5.
eSNR and WSR errors for various pulses with two transmission voltages: 5V (a)–(c) and 15V (d)–(f). BB and NB are abbreviations of broadband and narrowband pulses. Note that the abscissas in panels (b), (c), (e), (f) can be converted from WSR (1/s) to WSS (Pa) by multiplying the WSR values by the viscosity of the blood-mimicking fluid, 0.003 Pa-s.
Coded pulses yield higher eSNR than the uncoded pulses. The maximum eSNR was found when a 13-bit Optimal code or a 2.1 µs pseudo-chirp was transmitted (Fig. 5 (a), (d)). By tripling the transmission voltage, eSNR increases 10 dB for all pulses (Fig. 5 (a)). Comparable eSNR and WSR errors were observed between FM and PM coded pulses with similar pulse lengths, which were originally designed to have the same transmission energy. Pulses with the highest eSNR generate the minimum WSR errors. The improvement with coded pulses in WSR errors is greater when the transmission voltage is low. In our previous study (Tsou et al., 2006), the simulation results indicated there is no advantage of using coded pulses when eSNR exceeds 30 dB. However, to avoid producing excess heat, the highest energy generated with the longest pulse setting in this study was ~ 90 % of the system limit (Fig. 5 (a)–(c)).
Decoding using matched filtering techniques achieves the maximum eSNR but at the cost of lower image contrast due to range lobes. Range lobe length is positively correlated to the transmitted code duration. Unsuccessful decoding biases WSR estimates by mixing clutter and noise with the echo signals. The effect is more prominent when a longer code is used in a fast flow condition. As shown in Fig. 5 (b), when WSR is greater than 500 1/s, WSR bias obtained from the 13-bit Optimal code and the 2.1 µs pseudo-chirp code are slightly greater than those of shorter codes. In situations where eSNR is low, the noise reduction from longer codes is more important than range lobe clutter and therefore is recommended. Possibly due to greater decorrelation between signal ensembles, both Rbias and Rstd increase with WSR for all imaging pulses.
In vivo vascular shear rate images
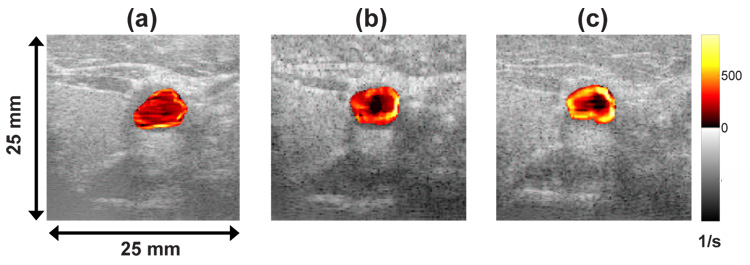
Shear rate images were acquired in vivo from the left common carotid artery and left brachial artery of a healthy volunteer using the Siemens Antares system. Echo acquisition was ECG triggered at peak systole and end diastole to obtain similar flow conditions for comparing imaging pulses. Fig. 6 shows the shear rate imaging data as a color overlay on the B-mode image. Image (a), (b) and (c) are processed from data acquired with an uncoded broadband, an uncoded narrow band and a 7-bit Optimal coded pulse on the same carotid artery at peak systole. The broadband imaging pulse in Fig. 6 (a) clearly does not provide enough eSNR for reliable WSR estimates. The improved eSNR for the narrow band pulse in (b) gives a realistic pattern for WSR (WSR decreases radially inward from the vessel wall) but with a poor spatial resolution that often biases low the WSR estimates. The coded pulse in (c) hints at improved spatial resolution and clearly shows a more uniform pattern of WSR around the vessel. The WSR patterns for the 1.17 µs pseudo-chirp code were very similar to that of the 7-bit Optimal coded pulse shown in (c).
6.
Shear rate images of a carotid artery at peak systole using (a) broadband (b) narrow band and (c) 7-bit Optimal coded pulses.
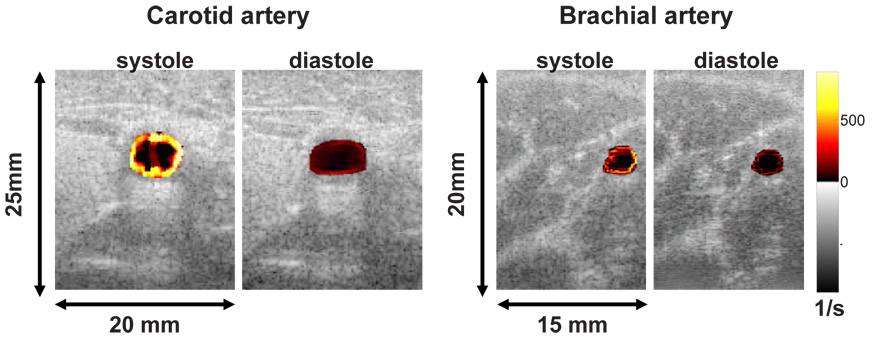
Fig. 7 shows representative in vivo shear rate images of a normal carotid and brachial artery using a 13-bit Optimal coded pulse measured at peak systole and end diastole. The shear rate patterns around the vessel are asymmetric, which could reflect the spatially varying patterns of interest in the present study. However, further study is necessary to validate these findings. Table 2 shows the estimated mean WSR and the corresponding standard deviations averaged over 20 cycles from our volunteer. Since there are no standard comparisons for in vivo results, we can compute only standard deviations but not bias. As shown in Table 2, higher energy pulses yield the smallest standard deviations and the highest means. Since we found that bias is always negative for WSR estimates, the inference is that both systematic and random errors are decreased using large-bandwidth coded pulses.
7.
Shear rate images of human carotid and brachial arteries at peak systole and end diastole using a 13-bit Optimal code.
Table 2.
In vivo estimates of wall shear rate from one normal subject
| Left common carotid artery | Left brachial artery | |||
|---|---|---|---|---|
| Pulse type | Systole | Diastole | Systole | Diastole |
| mean ± std | mean ± std | mean ± std | mean ± std | |
| Broadband | 590 ± 88 | 137 ± 64 | 458 ± 66 | 128 ± 51 |
| Narrow band | 729 ± 63 | 154 ± 57 | 574 ± 47 | 163 ± 43 |
| Opt (7 bit) | 785 ± 37 | 173 ± 25 | 699 ± 33 | 187 ± 29 |
| Pchirp (1.17 µs) | 773 ± 52 | 198 ± 30 | 703 ± 32 | 204 ± 35 |
| Opt (13 bit) | 853 ± 32 | 219 ± 21 | 710 ± 21 | 213 ± 22 |
| Pchirp (2.10 µs) | 820 ± 41 | 225 ± 23 | 743 ± 25 | 219 ± 19 |
WSR unit: 1/s
Prediction errors in shear-mediated endothelial cell function
Fig. 8 (b) and (c) show the major results from our previous in vitro study of shear-mediated CAM expression on an inflamed HAEC monolayer as a function of shear stress (Tsou et al., 2007, in press). Mean fluorescence intensity is defined in the previous method section. The baseline level (100 %) was set to the steady-state MFI, which is the expression occurring at WSS > 1.4 Pa. These graphs clearly show that CAM expression is not constant within the physiological fluid shear range. VCAM-1 and E-selectin are more sensitive to low WSS (< 0.4 Pa). There is little or no change in the response to shear stresses > 0.8 Pa. This elevation in E-selectin and VCAM-1 expression at low shear triggers monocyte rolling and adhesion to inflamed HAEC. Monocyte adhesion is considered an important initial step in atherogenesis. In this section, we focus on studying the interplay between ultrasonic measurement errors (Fig. 5) and CAM expression under shear. In order to understand the impact of correlating biased WSS estimates to shear-mediated CAM expression, prediction errors were computed.
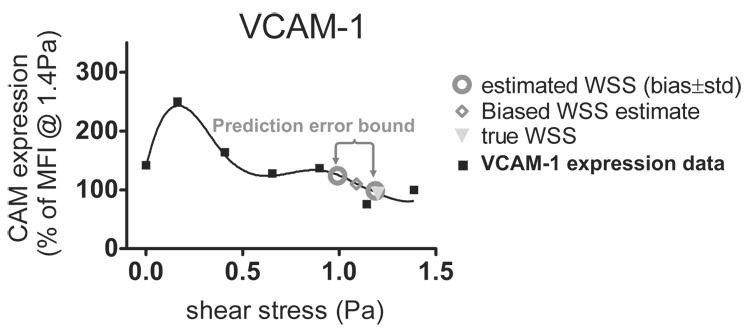
Shear-dependent WSS measurement errors (Figs. 5 (b), (c)) and shear-regulated CAM expression (Figs. 8 (b), (c)) were combined to estimate the errors in predicting CAM expression under certain ultrasonically measured WSS conditions as depicted in Fig. 9. The sensitivities of fluorescence-labeled antibodies were examined in our previous studies (Tsou et al., 2007, in press). The uncertainties from the labeling have been shown to be minimal and are therefore neglected in this analysis. CAM expression data from Figs. 8 (b), (c) are fit to a 6th order polynomial (R2 = 0.97). The CAM expression levels at the true WSS value (◊) and the biased ultrasonic WSS estimate (∇) (Fig. 5 (b)) are extracted from the fitted curve. The difference in the CAM expression is the averaged prediction error plotted in Figs. 8 (d) and (e) as the average error that reflects the prediction accuracy. The upper and lower limits of the standard deviation errors (○) in WSS estimates from Fig. 5 (c) projected on the interpolated curve of Fig. 9 reflect the prediction precision in CAM expression (error bars) in Figs. 8 (d) and (e) due to ultrasonic variability. The results for VCAM-1 and E-selectin derived from spectral Doppler estimates (labeled narrow-band) and 13-bit Optimal coded estimates are found in Fig. 8 (d) and (e), respectively.
9.
The method that estimates the errors in predicting shear-sensitive CAM expression is illustrated. The prediction errors are a result of the uncertainties in ultrasonic wall shear stress measurements.
Compared with the uncoded narrow-band Doppler pulse, the 13-bit Optimal code yields significantly lower prediction errors in both VCAM-1 and E-selectin while generating the lowest ultrasonic measurement errors. The interesting thing is that both Doppler and 13-bit Optimal code yield their respective maximum prediction errors in assessing shear-mediated VCAM-1 expression at 0.3 Pa (20 % and 8 %), where the lowest WSR Rbias and Rstd were observed in the ultrasonic phantom studies (Figs. 5 (b), (c)). In this case, the prediction errors are dominated by sensitivity of VCAM-1 expression to fluid shear. The scale of the prediction errors decreases with measured WSS for both 13-bit Optimal coded and uncoded narrow-band pulses.
The pattern of shear-mediated E-selectin is slightly different from that of VCAM-1. E-selectin expression peaked at 0.4 Pa with the biggest change in expression occurring between 0.4–0.8 Pa. E-selectin slowly drops to a basal expression level at shear stresses > 0.8 Pa. Consequently, instead of exhibiting similar prediction error profiles as VCAM-1, the prediction errors of shear-regulated E-selectin rise and then drop with increasing WSS. Combined with gradually increasing ultrasonic measurement errors, the high sensitivity of E-selectin to both magnitude and difference in WSS result in high prediction errors in the mid WSS range between 0.4 and 0.8 Pa (shown in Fig. 8 (e)).
DISCUSSION
This paper demonstrates the use of coded-pulse excitation techniques combined with a broadband regularized velocity estimator (Tsou et al., 2006) for WSR estimation on a commercial ultrasound system. Improved eSNR leads to improvements in the precision and accuracy of WSR estimates over a wide range of WSS (0.3 – 1.9 Pa). The advantages of our methods over standard Doppler techniques estimating WSR are the result of using broadband coded pulses with high time-bandwidth product, which matches or exceeds the eSNR of Doppler methods but has significantly greater bandwidth for enhanced spatial resolution. The nonstationary echo signals and decorrelation from flow distorts the codes but not sufficiently to generate range lobes during pulse decoding. A broadband velocity estimator that is regularized by a smoothness penalty obtained from color-flow information measured at the center of the blood vessel is an important element of the technique.
The FM pseudo-chirp and PM Optimal codes of similar pulse duration performed similarly. Unlike FM chirp pulses consisting of sine waves, FM pseudo-chirp pulses are composed of square waves that provide more signal energy for the same pulse length. The high pulse energy density of the pseudo-chirp is comparable to the PM Optimal coded pulse, and the high bandwidth of linear array systems allows access to the information from the harmonics. These coded pulses are able to significantly increase eSNR and bandwidth for velocity estimation before reaching a code length where range lobes generated from incomplete decoding begin to significantly degrade contrast resolution. With increase in transmission voltage, eSNR enhancement is observed for all imaging pulses. However, in this case, the error reduction in WSR estimation with the use of codes is about 50 % less than in the lower eSNR condition (Fig. 5). Pulsed excitation offers the greatest advantages in enhancing estimation accuracy and precision when eSNR < 30 dB (Tsou et al., 2006). We found it difficult to achieve eSNR > 30 dB in vivo while remaining within recommended output limits. Consequently, coded-pulse excitation is potentially advantageous in many vascular imaging situations. 2-D WSR images (Fig. 6, Fig. 7) suggest that in vivo imaging is achievable, although the preliminary images presented in this report were reconstructed offline.
Data from Fig. 5, when combined with our previous study on endothelial cell function (Tsou et al., 2007, in press), provide for a connection between uncertainties in engineering measurements and errors in vascular function predictions, Figs. 8 (d), (e). The consequences of WSR errors from ultrasound measurements now can be translated into biological terms. While the greatest estimation errors occur at the largest values of WSR (Fig. 5), the largest errors in predicting shear-mediated CAM expression occur at lower shear stress values. The maximum change in E-selectin expression occurs for WSS in the range of 0.4 – 0.8 Pa, which is the range where measurement techniques should be optimized. Ultrasonic estimates of WSR are significantly better at WSS = 0.4 Pa than at 0.8 Pa. Also, coded-pulse transmission reduces bias errors by more than a factor of 2 over the entire range when compared with narrow band Doppler methods. Similar improvement for VCAM-1 expression was found, although the biggest reduction in errors was obtained at lower shear stress values (0.3 Pa). With knowledge of errors in predicting CAM expressions under steady flow conditions, one can extend the analysis to investigate the influence of uncertainties in ultrasonic WSR measurements on endothelial cell function under unsteady flow conditions. Of particular interest in this regard is the finding that oscillatory flow with a low time-averaged shear stress correlates with the development of atheroma (Chappell et al., 1998).
In summary, ultrasonic broadband coded-pulse excitation techniques can provide WSS measurements in vitro and likely in vivo with greater accuracy and precision than current color-flow or spectral Doppler methods. Therefore, with it, one can investigate shear- mediated endothelial cell function in vivo with better confidence while monitoring the shear levels with ultrasound. The proposed error-prediction method presents a quantitative way to understand the constraint of ultrasonic imaging techniques in assessing EC function. It also suggests that the optimization step should be focused at low shear stresses (< 0.8 Pa). In addition, 2-D shear rate imaging introduces a new dimension in monitoring spatial heterogeneity in hemodynamic shear. These methods offer new tools for in vivo research on the effects of WSS during the development of atherosclerosis.
ACKNOWLEDGEMENTS
The authors gratefully acknowledge software support generously provided by Siemens Medical Solutions, Mountain View, CA and also are sincerely thankful to Dr. Scott I. Simon for his advice in the in vitro cell studies. This work is supported by the National Cancer Institute under Award No. R01 CA082497.
APPENDIX
The summary of abbreviations is listed in Table 3.
Table 3.
List of abbreviations
| BB | Broad-band |
| CAM | Cell adhesion molecule |
| CFD | Computational fluid dynamics |
| ECG | Electrocardiogram |
| E-selectin | Endothelial-leukocyte adhesion molecule-1 |
| eSNR | Echo signal-to-noise ratio |
| FM | Frequency-modulated |
| HAEC | Human aortic endothelial cell |
| MFI | Mean fluorescence intensity |
| NB | Narrow band |
| Opt | Optimal code |
| Pchirp | Pseudo-chirp |
| PDMS | Poly-dimethylsiloxane |
| PM | Phase-modulated |
| RF | Radio frequency |
| TNF | Tumor necrosis factor |
| URI | Ultrasound research interface |
| WSR | Wall shear rate |
| WSS | Wall shear stress |
| VCAM-1 | Vascular cell adhesion molecule-1 |
Footnotes
Publisher's Disclaimer: This is a PDF file of an unedited manuscript that has been accepted for publication. As a service to our customers we are providing this early version of the manuscript. The manuscript will undergo copyediting, typesetting, and review of the resulting proof before it is published in its final citable form. Please note that during the production process errors may be discovered which could affect the content, and all legal disclaimers that apply to the journal pertain.
REFERENCES
- Chappell DC, Varner SE, Nerem RM, Medford RM, Alexander RW. Oscillatory shear stress stimulates adhesion molecule expression in cultured human endothelium. Circ. Res. 1998;82:532–539. doi: 10.1161/01.res.82.5.532. [DOI] [PubMed] [Google Scholar]
- Couturier G, Voustaniouk A, Weinberger J, Fuster V. Correlation between coronary artery disease and aortic arch plaque thickness measured by non-invasive B-mode ultrasoundgraphy. Atherosclerosis. 2006;185:159–164. doi: 10.1016/j.atherosclerosis.2005.05.035. [DOI] [PubMed] [Google Scholar]
- Farmer J, Torre-Amione G. Atherosclerosis and inflammation. Current Atherosclerosis Reports. 2002;4:92–98. doi: 10.1007/s11883-002-0031-5. [DOI] [PubMed] [Google Scholar]
- Fung YC. Biomechanics. Springer; 1993. [Google Scholar]
- Giddens DP, Zarins ZK, Glagov S. The role of fluid mechanics in the localization and detection of atherosclerosis. J Biomech Eng. 1993;115:588–594. doi: 10.1115/1.2895545. [DOI] [PubMed] [Google Scholar]
- Hoeks APG, Samijo SK, Brands PJ, Reneman RS. Noninvasive determination of shear rate distribution across the arterial lumen. Hypertension. 199;526(1):26–33. doi: 10.1161/01.hyp.26.1.26. [DOI] [PubMed] [Google Scholar]
- Liu J, Insana MF. Coded pulse excitation for ultrasonic strain imaging. IEEE Trans Ultrason Ferroelec Freq Contrl. 2005;52(2):231–240. doi: 10.1109/tuffc.2005.1406549. [DOI] [PMC free article] [PubMed] [Google Scholar]
- Madsen E, Zagzebski J, Frank G. Oil-in-gelatin dispersions for use as ultrasonically tissue mimicking materials. Ultrasound Med Biol. 1982;8:277–287. doi: 10.1016/0301-5629(82)90034-5. [DOI] [PubMed] [Google Scholar]
- Malek AM, Alper SL, Izumo S. Hemodynamic shear stress and its role in atherosclerosis. JAMA. 1999;282:2035–2042. doi: 10.1001/jama.282.21.2035. [DOI] [PubMed] [Google Scholar]
- Nerem RM. Vascular fluid mechanics, the arterial wall and atherosclerosis. J Biomech Eng. 1992;114:274–282. doi: 10.1115/1.2891384. [DOI] [PubMed] [Google Scholar]
- Ramnarine KV, Nassiri DK, Hoskins PR, Lubbers J. Validation of a new blood-mimicking fluid for use in Doppler flow test objects. Ultrasound Med Biol. 1998;24:451–459. doi: 10.1016/s0301-5629(97)00277-9. [DOI] [PubMed] [Google Scholar]
- Reneman RS, Arts T, Hoeks APG. Wall shear stress - an important determinant of endothelial cell function and structure in the arterial system in vivo. J Vasc Res. 2006;43(4):251–269. doi: 10.1159/000091648. [DOI] [PubMed] [Google Scholar]
- Ruprecht J, Rupf M. On the search for good aperiodic binary invertible sequences. IEEE Trans Inform Theory. 1996;42:1604–1612. [Google Scholar]
- Tsou JK, Gower R, Ting HJ, Schaff U, Insana MF, Passerini A, Simon SI. Spatial regulation of inflammation by human aortic endothelial cells in a linear gradient of shear stress. Microcirculation. 2007 doi: 10.1080/10739680701724359. In press. [DOI] [PMC free article] [PubMed] [Google Scholar]
- Tsou JK, Liu J, Insana MF. Modeling and phantom studies of ultrasonic wall shear rate measurements using coded pulse excitation. IEEE Trans Ultrason Ferroelec Freq Contrl. 2006;53:724–734. [PMC free article] [PubMed] [Google Scholar]
- Usami S, Chen HH, Zhao Y, Chien S, Skalak R. Design and construction of a linear shear stress flow chamber. Ann Biomed Eng. 1993;21:77–83. doi: 10.1007/BF02368167. [DOI] [PubMed] [Google Scholar]


