

Abstract
Identifying the immunologic and virologic consequences of discontinuing antiretroviral therapy in HIV-infected patients is of major importance in developing long-term treatment strategies for patients with HIV-1 infection. We designed a trial to characterize these parameters after interruption of highly active antiretroviral therapy (HAART) in patients who had maintained prolonged viral suppression on antiretroviral drugs. Eighteen patients with CD4+ T cell counts ≥ 350 cells/μl and viral load below the limits of detection for ≥1 year while on HAART were enrolled prospectively in a trial in which HAART was discontinued. Twelve of these patients had received prior IL-2 therapy and had low frequencies of resting, latently infected CD4 cells. Viral load relapse to >50 copies/ml occurred in all 18 patients independent of prior IL-2 treatment, beginning most commonly during weeks 2–3 after cessation of HAART. The mean relapse rate constant was 0.45 (0.20 log10 copies) day−1, which was very similar to the mean viral clearance rate constant after drug resumption of 0.35 (0.15 log10 copies) day−1 (P = 0.28). One patient experienced a relapse delay to week 7. All patients except one experienced a relapse burden to >5,000 RNA copies/ml. Ex vivo labeling with BrdUrd showed that CD4 and CD8 cell turnover increased after withdrawal of HAART and correlated with viral load whereas lymphocyte turnover decreased after reinitiation of drug treatment. Virologic relapse occurs rapidly in patients who discontinue suppressive drug therapy, even in patients with a markedly diminished pool of resting, latently infected CD4+ T cells.
Keywords: HIV-1 infection, antiretroviral drugs, viral load, relapse, CD4
The advent of highly active antiretroviral therapy (HAART) has significantly improved the ability to maintain suppression of HIV-1 replication to very low levels for an extended period of time in patients with HIV-1 infection. Sustained control over viral propagation has translated into a dramatic reduction in the incidence of AIDS-associated opportunistic infections and deaths in those with access to these medications (1, 2). However, the benefits of HAART are often accompanied by a substantial degree of drug-related toxicity, the full spectrum of which continues to be defined (3–6). The considerable expense, inconvenience, and rigid requirement for adherence associated with the use of HAART regimens has further weakened the enthusiasm of many patients for their long-term use (7).
One of the implicit hopes accompanying strategies designed to suppress viral activity is that, at some point, the host's immune system might be able to maintain this suppression either in the absence of, or at least after a de-intensification of, the current medications (8–12). Unfortunately, with the exception of occasional anecdotal reports of sustained suppression, fairly prompt virologic relapse after discontinuation of HAART has been the predominant pattern observed thus far (13–16). Given that the process of lymphocyte recovery after institution of HAART has been projected to occur on the scale of months to years, it may be necessary to continue HAART without interruption for an extended period of time before embarking on any strategy in which direct viral suppression is withdrawn (17,18). In addition, the success rate of any withdrawal strategy may be critically dependent on preselecting individuals in whom the population of resting, latently infected CD4+ T cells, and possibly other viral reservoirs, have already been substantially depleted by using a variety of strategies (19–23).
With these precepts in mind, we instituted a prospective trial in which long-term responders to HAART were offered participation in a study in which all antiretroviral drug therapy was stopped. Included in this trial were several recipients of therapy with intermittent cycles of IL-2 plus continuous HAART, a treatment shown in a previous study to be associated with a low frequency of resting, latently infected CD4+ T cells (24). We sought to establish whether a subset of individuals could be identified in whom viral rebound either did not occur or did so to comparatively low levels or with a delayed onset. Our goal was also to determine whether baseline immunologic and/or virologic parameters were predictive of the pattern of relapse.
Methods
Study Population.
Eligible patients were asymptomatic HIV-infected adults with baseline CD4+ T cell counts ≥350 cells/μl who had been on continuous HAART for a minimum period of 1 year and who had documentation of viral loads consistently below the limits of detection for at least that period of time. HAART was defined as a minimum of a triple drug combination, including at least two licensed reverse transcriptase inhibitors and at least one licensed protease inhibitor. Viral loads below the limits of detection were defined as being those below a maximum of 500 HIV-1 RNA copies/ml on every determination for a period of at least 1 year before screening and a level below 50 copies/ml on at least two determinations immediately before enrollment. All patients provided written informed consent as approved by the National Institute of Allergy and Infectious Diseases Institutional Review Board.
Laboratory Tests.
Peripheral blood specimens were collected at baseline for determination of viral load by bDNA methodology (Bayer Diagnostics, Norwood, MA), HIV-1 gag RNA and proviral DNA quantitation by PCR (25), viral co-cultivation for frequency of resting, latently infected CD4+ cells (24, 26, 27), flow cytometry for lymphocyte phenotyping, and antigen-stimulated lymphocyte blastogenesis. Incorporation of 5-bromo-2′ deoxyuridine (BrdUrd) into lymphocytes ex vivo was measured after a 4-hour incubation of BrdUrd with whole blood, cell surface staining for CD3, CD4, and CD8 phenotypes, paraformaldehyde fixation, DNase treatment, staining with anti-BrdUrd-FITC (Becton Dickinson), and flow cytometric analysis. Lymph node biopsies for in situ studies and viral quantitation, and lumbar punctures for viral quantitation (reverse transcription–PCR) in cerebrospinal fluid (CSF) were also performed in a subset of patients.
On day 0, patients discontinued all of their antiretroviral medications simultaneously and then underwent 6 months of intensive monitoring. Repeat lymph node biopsies and lumbar punctures were performed after viral relapse in a subset of patients.
Study Intervention.
Patients were instructed to resume their original antiretroviral medications whenever any of the following three conditions were met: (i) the CD4+ T cell count declined at least 25% from the mean of three baseline determinations, (ii) viral load increased at least two log10-fold (i.e., reached 5000 HIV-1 RNA copies/ml) above baseline, or (iii) the patient elected to resume drug treatment independent of these thresholds. Patients who declined to resume antiretroviral medications were counseled, but remained eligible for continued monitoring.
Data Analysis.
Linear regression analysis of the first measurable data points was used to calculate rate constants of viral rebound and to extrapolate to the plasma virus concentration, V0, at the time of withdrawing therapy. The empirical constants, k, characterizing the rate of virus rebound, were calculated assuming an exponential dependence of the plasma virus concentration V on time t: V = Voexp(kt). Similarly, V = Vmexp(−ct) defined the plasma virus clearance rate constants, c, by using the plasma virus concentration at time of reinitiation of therapy, VM. Dependence of log10 V on t was computer-fitted (Scientist, MicroMath, Salt Lake City) by using duplicated data points.
Similar equations were used to fit the data for CD4+ and CD8+ T cell changes. For example, the number of CD4 cells, T4, was assumed to depend exponentially on time [T4 = T40exp(kT4⋅t)], and, therefore, log10 T4 = 0.434⋅kT4⋅t + const, where T40 is the number of cells at t = 0, the coefficient 0.434 is a conversion factor from rate constants to log10 cell number, and const does not depend on time. In all cases, the empirical equations described above were used in this study to describe the dynamics of HIV-1 RNA and T cells as a means of comparison between the periods after stopping HAART and its reinitiation, as well as between IL-2-treated and untreated patients. Accordingly, the constants in these equations were determined for the stated (limited) time intervals and may not accurately reflect complex viral and T cell dynamics over a longer time interval.
Results
Enrollment commenced in January 1999. Baseline characteristics of the first 18 patients are shown in Table 1. All were Caucasian males with a mean age of 45 years and a mean baseline CD4+ T cell count of 921 ± 85 cells/μl (range 454–1,868), and whose major risk factor for exposure to HIV-1 was unprotected sex with other men. Experience of this cohort with any of the licensed protease inhibitors extended back for a mean period of 137 ± 8.1 weeks (range 83–248 weeks) before study entry. The most current regimen of HAART medications had been administered for a mean period of 117 ± 12.0 weeks (range 15–248 weeks) before stopping drugs. The numbers of prestudy recipients of three-drug, four-drug, or five-drug regimens were 14, 2, and 2, respectively. Four patients included an non-nucleoside reverse transcriptase inhibitor in their current HAART regimens for a mean duration of 84 ± 4.3 weeks (range 76–96 weeks).
Table 1.
Demographics and baseline characteristics of the study population
| Patient | Age, yrs | CD4 (%) | Most recent HAART medications | Viral load <500 copies/ml, weeks | PBMC DNA PCR copies/106 cells | gag RNA PCR (per 106 cells) | Lymph node virus, per 107 cells | CSF virus, copies/ml | Prior IL-2 treatment |
|---|---|---|---|---|---|---|---|---|---|
| 1 | 41 | 1,519 (52%) | ZDV/3TC/IND | >84 | 535 | + | 217 | <50 | + |
| 2 | 63 | 667 (30%) | ddl/3TC/IND | >78 | 205 | + | 52 | <50 | + |
| 3 | 36 | 988 (40%) | D4T/3TC/SQV/NFV | >94 | 10 | + | − | <50 | + |
| 4 | 34 | 544 (36%) | ZDV/3TC/IND | >127 | 20 | Not detected | − | − | + |
| 5 | 55 | 672 (56%) | ZDV/3TC/SQV | >300 | Not detected | Not detected | <50 | <50 | + |
| 6 | 57 | 876 (46%) | D4T/3TC/NFV | >135 | 140 | + | − | <50 | − |
| 7 | 52 | 1,868 (41%) | D4T/3TC/IND | >83 | 30 | + | − | − | + |
| 8 | 36 | 741 (43%) | ZDV/3TC/IND | >87 | 285 | + | − | <50 | − |
| 9 | 30 | 956 (36%) | D4T/3TC/SQV/NFV | >116 | 50 | + | − | − | − |
| 10 | 41 | 1,124 (50%) | ZDV/3TC/IND | >75 | 95 | + | − | − | + |
| 11 | 51 | 848 (39%) | D4T/3TC/NVP/SQV/RIT | >93 | 280 | + | <50 | <50 | + |
| 12 | 39 | 915 (49%) | ZDV/3TC/NVP/IND/RIT | >59 | 25 | + | <50 | <50 | + |
| 13 | 54 | 687 (42%) | NVP/3TC/IND | >72 | 320 | + | − | − | − |
| 14 | 50 | 608 (31%) | D4T/3TC/SQV | >106 | 65 | + | − | <50 | + |
| 15 | 40 | 1,107 (33%) | D4T/3TC/IND | >126 | 30 | Not detected | − | <50 | + |
| 16 | 41 | 1,311 (44%) | D4T/3TC/IND | >124 | 105 | + | − | − | + |
| 17 | 49 | 454 (22%) | D4T/3TC/IND | >60 | 145 | + | − | − | − |
| 18 | 32 | 689 (39%) | DLV/D4T/NFV | >86 | 1 | + | − | − | − |
The mean minimum period of time before enrollment in which plasma viremia could be documented to have been consistently under 500 RNA copies/ml was 108 ± 13.3 weeks. PCR amplification of proviral DNA in peripheral blood mononuclear cells (PBMCs) was below the quantitation threshold of one copy per 106 cells in one participant. In three patients, including the one individual with proviral DNA signal below the limits of detection, gag RNA in PBMCs was not found despite using a sensitive nested PCR technique. In three of the five patients who underwent inguinal lymph node biopsies at study entry, virus levels in the excised nodes were below the limits of detection of 50 copies per 107 cells. In all 10 patients who underwent a lumbar puncture for viral quantitation at baseline, the level of CSF HIV-1 was <50 copies/ml.
Twelve (67%) participants had received prior therapy with either intermittent intravenous or subcutaneous IL-2 in combination with HAART as part of ongoing clinical trials. Of these 12, lymphocytes from two [patients 3 and 15 (Table 2)] had recently been reported as having a frequency of resting, latently infected CD4+ cells below the limits of detection (28). Three additional recipients of HAART + IL-2 in the present cohort also fulfilled this criterion, as did two recipients of HAART alone (Table 2).
Table 2.
Parameters of viral dynamics after stopping and reinitiating therapy
| Patient | k, day−1 | Vo, copies/ml | t50, days | t500, days | Vm, copies/ml | c, day−1 | N0 | N1 | CSF virus, copies/ml* |
|---|---|---|---|---|---|---|---|---|---|
| 1 | 0.57 | 2.4 | 5.4 | 9.5 | 250,000 | 0.34 | 0.31 | 1.7 | 247 |
| 2 | 0.39 | 11 | 3.8 | 9.7 | 15,000 | 0.32 | 0.10 | 3.2 | <50 |
| 3 | 0.12 | 18 | 8.9 | 29 | 71,000 | 0.30 | U | 0.87 | <50 |
| 4 | 0.67 | 0.031 | 11 | 15 | 35,000 | 0.33 | U | 3.2 | |
| 5 | 0.31 | 0.000017 | 47 | 55 | 21,000 | 0.37 | U | 0.20 | |
| 6 | 0.46 | 1.1 | 8.4 | 13 | 3,100,000 | 0.39 | U | 205 | 2,485 |
| 7 | 0.32 | 2.8 | 9.0 | 16 | 110,000 | 0.29 | 0.42 | 40 | |
| 8 | 0.47 | 0.52 | 9.8 | 15 | 70,000 | U | 7,645 | ||
| 9 | 0.23 | 14 | 5.6 | 15 | 0.18 | ||||
| 10 | 0.32 | 0.91 | 12 | 20 | 12,000 | 0.27 | 0.87 | 41 | |
| 11 | 0.39 | 1.1 | 9.8 | 16 | 120,000 | 0.43 | 1.6 | 2,500 | 3,165 |
| 12 | 0.20 | 5.7 | 11 | 23 | 1,000 | 0.32 | U | 8.1 | 16,514 |
| 13 | .24 | 3.6 | 8 | 14 | 158,000 | 0.37 | 0.85 | 143 | |
| 14 | 0.40 | 0.096 | 15 | 21 | 20,000 | 0.32 | 0.005 | 3.2 | |
| 15 | 0.61 | 0.018 | 13 | 17 | U | 7.9 | 280 | ||
| 16 | 0.91 | 0.00075 | 12 | 15 | 60,000 | 0.49 | 0.030 | 8.1 | |
| 17 | 0.91 | 0.084 | 7.0 | 9.5 | 127,000 | 0.42 | 1.1 | 747 | |
| 18 | 0.54 | 1.2 | 7.0 | 11 | 0.03 | 0.12 | |||
| Mean (log10) | 0.45 | 3.5 (−0.43) | 11 | 18 | 260,000 (4.7) | 0.36 | |||
| SD | 0.22 | 5.4 (1.6) | 9 | 11 | 760,000 (5.9) | 0.06 |
k and c are the viral relapse and viral clearance rate constants, respectively, as calculated based on the extrapolated plasma virus concentration at baseline, Vo and the measured concentration at drug resumption, VM. t50 and t500 are the time to return of plasma virus above 50 and 500 copies/ml, respectively. N0 and N1 are the numbers of resting, latently infected CD4 T cells (per 106 cells cultured) before therapy was withdrawn and at the time of restarting drug, respectively. U, below the limits of detection.
CSF viral quantitation by reverse transcription–PCR at the time of restarting drug.
Viral Dynamics.
Plasma virus rose above 50 RNA copies/ml in all participants, generally within 2–3 weeks of stopping antiretroviral medications (Figs. 1 and 2). It is noteworthy that, in some patients, plasma viremia appeared to peak quickly and then spontaneously fall to an intermediate level even before resuming drug therapy. Prior therapy with IL-2 did not influence the rate of viral rebound (Fig. 3). In the single participant (patient 5) with a baseline proviral DNA copy number below detection, absent gag RNA PCR signal, and a baseline frequency of resting, latently infected CD4 cells below the limits of measurement, viral rebound was delayed by several more weeks relative to the other patients. In an additional patient (patient 18), plasma virus rebounded quickly but only to a maximal level of several hundred RNA copies/ml despite the patient's continued abstinence from drug therapy.
Figure 1.

Three representative graphs of viral relapse after discontinuation of HAART, with linear regression lines (red) depicting back extrapolation of viral load to time zero (HAART withdrawal). bDNA results of <50 copies/ml were assigned values of 49 copies/ml before log10 transformation. Vertical black lines indicate when HAART was restarted.
Figure 2.

The viral relapse patterns observed in 18 patients in whom HAART was discontinued, color-coded as indicated.
Figure 3.
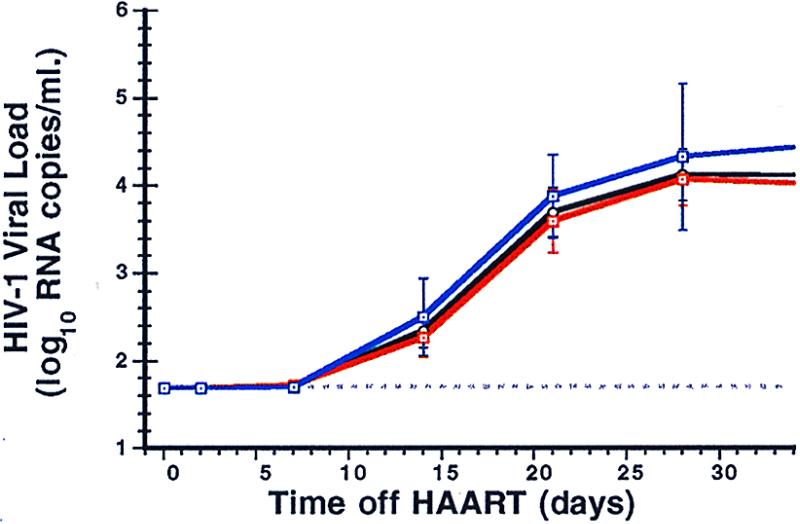
The mean viral load results (± SE) for the 18 patients (black line), separated into the 12 previous IL-2-recipients (red line) and the 6 non-IL-2 recipients (blue line).
Reinstitution of HAART after relapse was associated with a prompt reduction in plasma viral load in all patients who elected to resume treatment (Fig. 4). The mean (median) time to resuppression of plasma viremia to <50 copies/ml in the first 16 patients to resume HAART therapy was 79 (84) days (range 35–119 days).
Figure 4.
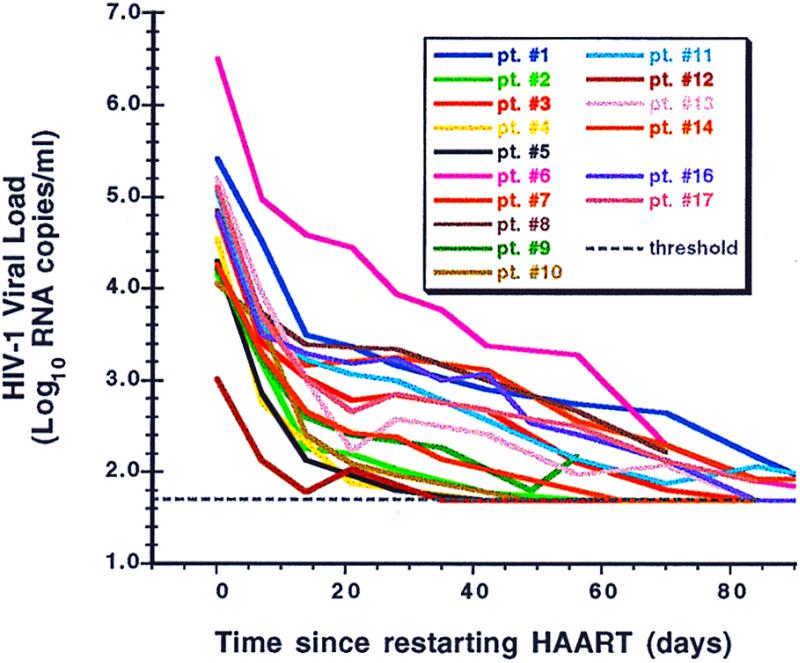
The individual patterns of viral load suppression in patients after resumption of HAART, normalized to time zero (the day HAART was restarted in each patient), color-coded as in Fig. 2.
Virus relapse kinetics were rapid, with rebound rate constants (k) ranging from 0.12 to 0.91 day−1 (Table 2). Viral clearance constants (c) after restarting drugs did not vary significantly, their mean value being approximately the same as the mean rebound rate constant (0.36 ± 0.06 vs. 0.45 ± 0.22 day−1, P = 0.28). Correlation between k and c was strong (r = 0.77, P = 0.008). The rebound and clearance rate constants also weakly correlated with the logarithm of the estimated HIV RNA concentrations before therapy was withdrawn (P = 0.046 and P = 0.084, respectively). However, no correlation was found between k and the baseline frequency of resting, latently infected CD4 cells (Table 2, column N0) in the peripheral blood. Rebound and clearance rate constants could also be calculated by fitting time points for all patients normalized to a common data point ≈1 week after the first detectable HIV RNA value or the data point at the time when therapy was reinitiated. By using this approach, the mean values of the rebound and clearance rate constants, 0.43 and 0.30 day−1, respectively, were quite similar to those presented above.
After reappearance of plasma virus, the frequency of resting, latently infected CD4 cells (Table 2, column N1) quickly increased in all participants. The logarithm of N1 correlated with the log10 plasma HIV-1 RNA concentration (P = 0.001). Eight of ten patients with baseline CSF viral quantitation also underwent a repeat lumbar puncture just before restarting drug: CSF HIV-1 in six had risen to >50 copies/ml (Table 2).
CD4 T Cell Dynamics.
The number and percentage of CD4+ T cells decreased in most patients after withdrawal of therapy and increased after reinstitution of treatment (Fig. 5). Compared with the HIV-1 RNA rebound and clearance rate constants, the absolute values of the CD4+ T cell initial decrease and increase rate constants, kT4 and cT4, respectively, were on average more than one log10 smaller (Table 3). There were statistically significant differences between kT4 and cT4 (P < 0.001). Differences between the linear rate constants characterizing the rates of change in CD4+ percentage after withdrawal and then resumption of therapy were also statistically significant (P = 0.007). Similar results were obtained when the number of CD4+ cells was normalized either to day 2 after drug cessation or at the resumption of therapy—the mean rate constants being equal to −0.015 and 0.011 day−1, respectively. No significant correlations existed between parameters characterizing the changes in CD4+ T cell numbers and the viral dynamics parameters except between cT4 and c (P = 0.002). There were no significant changes in the number of CD8+ T cells.
Figure 5.
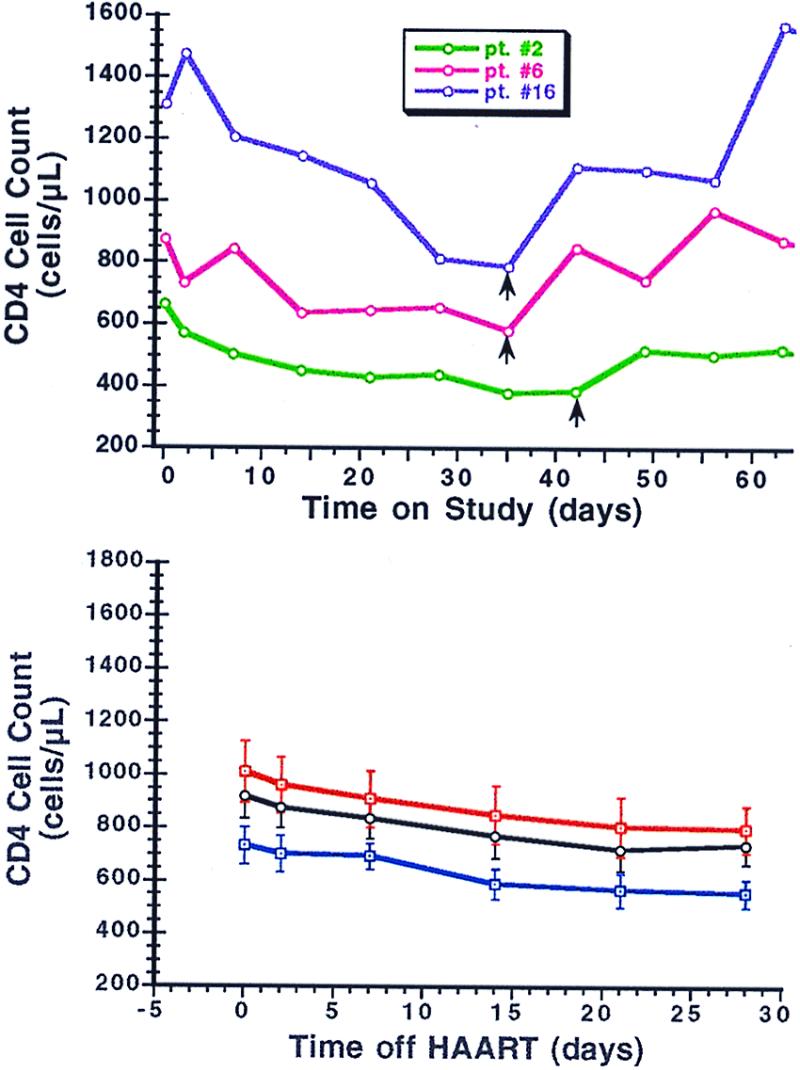
Changes in absolute CD4 cell counts experienced by patients in whom HAART was discontinued. (Upper) CD4 cell changes in three representative patients over time after discontinuation and then resumption of HAART. Vertical black arrows indicate when HAART was restarted in each patient. (Lower) The mean CD4 cell counts (± SE) for the 18 patients (black line) after discontinuation of HAART, separated into the 12 previous IL-2-recipients (red line) and the 6 non-IL-2 recipients (blue line).
Table 3.
Rate constants for CD4+ T Cell dynamics after stopping and reinitiating therapy
| −kT4 (day−1) | cT4 (day−1) | kBT4 (percent day−1) | −cBT4 (percent day−1) | kBT8 (percent day−1) | −cBT8 (percent day−1) | |
|---|---|---|---|---|---|---|
| Mean (±s.d.) | 0.015 (±0.011) | 0.026 (±0.016) | 0.018 (±0.015) | 0.020 (±0.016) | 0.047 (±0.039) | 0.043 (±0.048) |
−kT4 and cT4 are the mean rate constants for changes in CD4+ T cells after stopping therapy and on restarting drug treatment, respectively. Linear equations were used for fitting the data for the percentage of BrdUrd-labeled CD4+ or CD8+ T cells (percent BrdUrd-CD4 or percent BrdUrd-CD8 cells, respectively): percent BrdUrd-CD4 = kBT4⋅t + const1, where kBT4 is the respective constant and const1 does not depend on time. For CD8 cells, the constant is kBT8. The same equation was used for fitting the data after resuming therapy but with constants cBT4 and cBT8 for CD4 and CD8 cells, respectively.
Both CD4+ and CD8+ T cell turnover rates, as measured by BrdUrd incorporation ex vivo by fresh PBMCs, increased after termination of therapy and decreased after resumption of HAART (Table 3; Fig. 6). BrdUrd incorporation into CD8+ cells was approximately twice that observed in CD4+ cells. The respective rate constants for the percentage of labeled CD4+ cells, kBT4 and cBT4, differed significantly (P < 0.001). Interestingly, there was a correlation (P < 0.011) between the rate constant of cell proliferation after reinitiation of therapy, cBT4, and the log10 number of resting, latently infected CD4+ T cells at the time drug therapy was resumed, N1. A strong correlation (P < 0.001) also existed between the logarithmic percentage BrdUrd incorporation into both CD4+ and CD8+ T cells and log10 plasma viral RNA levels (Fig. 7).
Figure 6.
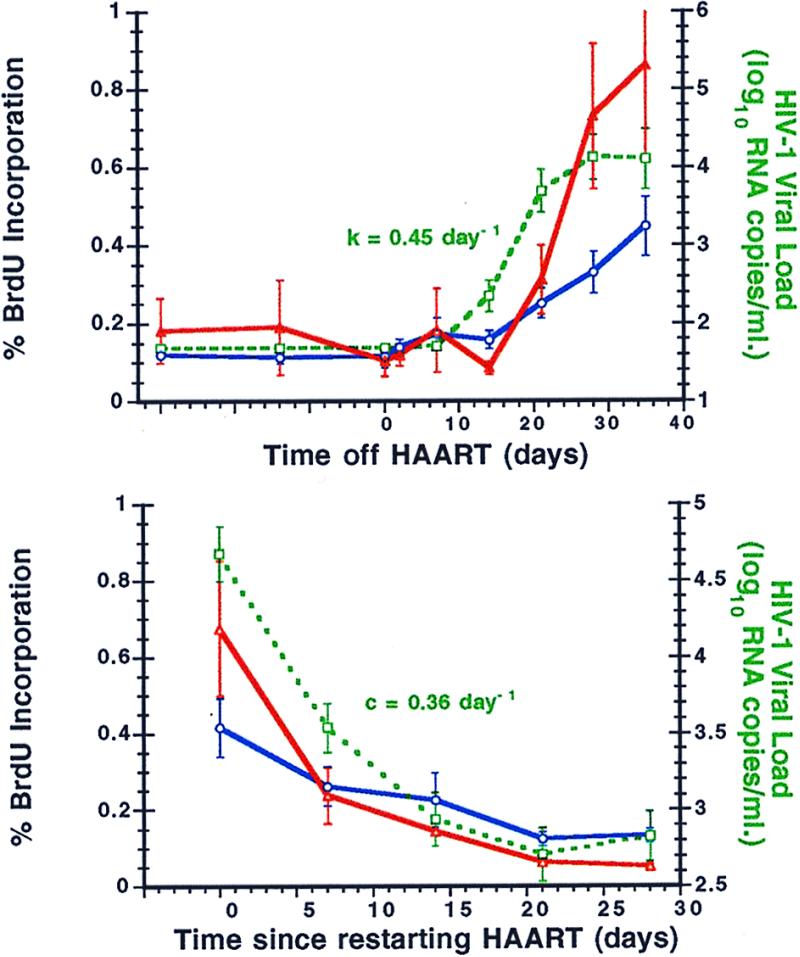
Changes in lymphocyte turnover, as measured by percent incorporation of BrdUrd, in relationship to plasma viral load before and after interruption of HAART. (Upper) Mean percent BrdUrd incorporation (±SE) into CD4+ (solid blue line) and CD8+ (solid red line) T cells at baseline and then after stopping HAART in comparison to plasma viral load (green dashed line). The mean viral relapse rate constant k is indicated. (Lower) Similar mean changes in CD4+ (solid blue line) and CD8+ (solid red line) T cells after reinitiating HAART therapy, normalized to time zero (the day HAART was restarted in each patient) and shown in comparison to the plasma viral load (green dashed line). The mean viral clearance rate constant c is indicated.
Figure 7.
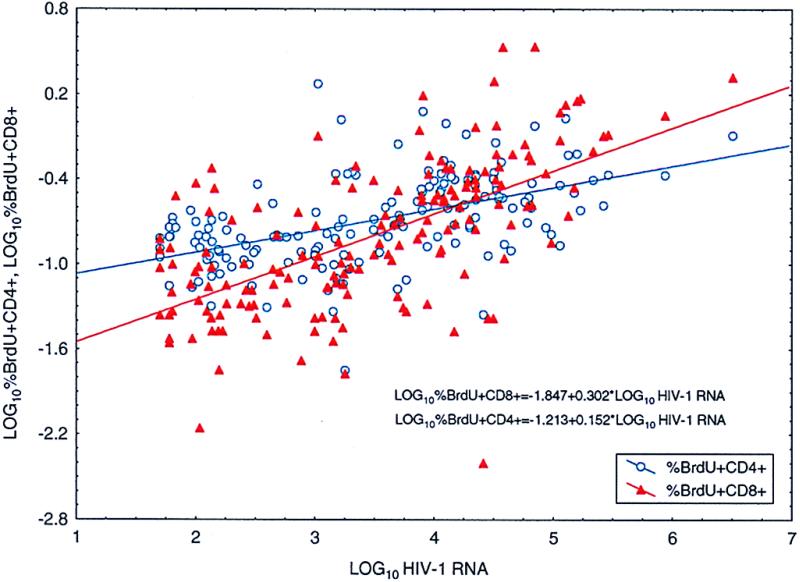
The correlation between log10 plasma RNA HIV-1 RNA levels and logarithmic percent BrdUrd incorporation into both CD4+ and CD8+ T cells (P < 0.0001). Only time points at which plasma viral RNA was in the detectable range after withdrawal of therapy are plotted.
Comparing week 8 to baseline values, four patients displayed a five-fold or greater increase in lymphocyte proliferation ex vivo to p24 antigen, five displayed increases between 1- and 5-fold, and, in the remaining nine, these values actually declined over that time period. The largest increase (28.6-fold) occurred in the patient (patient 18) whose plasma viremia rebounded only to very low copy numbers.
Discussion
We report here the results of a prospective trial of cessation of HAART in individuals chosen for their success at achieving long-term virologic control. Despite a mean period on effective suppressive therapy exceeding 2 years, varying degrees of virologic relapse occurred promptly in all individuals. These findings are especially notable not only for the consistency of HIV-1 rebound within only a few weeks of stopping drugs, but also for the apparent lack of a significant treatment effect on the kinetics of viral relapse and, by implication, viral reservoirs.
This cohort included a number of individuals in whom sensitive methods of viral quantitation identified little or no virus at baseline in the peripheral blood, lymph node tissue, CSF, or pool of resting CD4+ T cells. Some of the IL-2-treated patients, in particular, had very low, sometimes unmeasurable, burdens of infectious virus in their resting CD4+ T cell pools, a trait already distinguishing them from most recipients of HAART alone (24). These favorable conditions notwithstanding, the kinetics of HIV-1 rebound in the IL-2-treated patients generally appeared no different from those who had received HAART alone. The lack of correlation between the number of latently infected cells and the HIV-1 dynamics after stopping HAART suggests the existence of a small reservoir of actively replicating virus that could be of major importance in rekindling viral replication. These findings also underscore the results of earlier studies demonstrating persistence of HIV-1 RNA signal by PCR in PBMCs and lymph node tissue from treated patients, as well as more recent reports confirming that replication-competent HIV-1 can persist for long periods at low levels in the majority of treated individuals despite the use of maximally suppressive antiretroviral regimens (19, 25, 29, 30).
One patient (patient 18) in this study appeared capable of maintaining significant control of viral replication after discontinuation of drug therapy. Lymphocytes from this particular individual also demonstrated the greatest increase in proliferation to p24 antigen relative to baseline. It has been suggested that a key element in achieving sustained virologic control is to either preserve or to reconstitute a virus-specific CTL response in the setting of CD4 helper function, such as by inducing regeneration of CTL responses through antigenic priming in the setting of limited viral rebound (31).
The kinetics of viral relapse after withdrawal of drug therapy were similar to those reported by Harrigan et al. in a smaller cohort of patients (15). By using two separate methods, the calculated rebound rate constants (k) ranged from 0.12 to 0.91 day−1. The rate constants for viral clearance (c) on reinstitution of drug therapy were much more uniform with a mean value of 0.36 day−1. These two constants correlated not only with each other but also with the baseline log10 viral load at time zero.
On stopping drug therapy, CD4 cell numbers fell at a similar rate in both IL-2- and non-IL-2 recipients, and then began recovering shortly after reinstitution of suppressive antiviral therapy. Through longitudinal assessment of ex vivo labeling with BrdUrd, we were able to demonstrate that both CD4+ and CD8+ T cells consistently increased their rate of BrdUrd incorporation after drug cessation, and then decreased their level of incorporation back to baseline beginning shortly after resumption of therapy. These data strongly support the hypothesis that lymphocyte turnover is increased in the setting of untreated HIV-1 infection and decreased after treatment and suppression of viral replication. It is likely that active viral replication leads to increased lymphocyte activation, destruction, and turnover and that restoration of control over viral replication through resumption of HAART leads to a return to more normal levels of lymphocyte homeostasis.
In summary, we have observed that long-term suppression of HIV-1 by HAART does not confer on the host the ability to ultimately control viral replication once drug therapy is withdrawn. Laboratory surrogates indicating low or absent levels of measurable virus may provide useful comparative data on the relative potency of various therapeutic interventions, but do not as yet appear predictive of the ultimate success in maintaining control of viral replication once therapy is withdrawn. Greater attention needs to be focused on developing not only more potent antiretroviral drug regimens but also immune-enhancing strategies with greater potential for depleting virus from protected or sequestered sites throughout the body. Until such strategies are successful, it remains unclear whether the goal of being able to discontinue antiretroviral therapy permanently will ever be realized.
Abbreviations
- HAART
highly active antiretroviral therapy
- CSF
cerebrospinal fluid
- PBMC
peripheral blood mononuclear cell
References
- 1.Chiasson M A, Berenson L, Li W H, Schwartz S, Singh T, Forlenza S, Mojica B A, Hamburg M A. J Acquired Immune Defic Syndr Hum Retrovirol. 1999;21:59–64. doi: 10.1097/00126334-199905010-00008. [DOI] [PubMed] [Google Scholar]
- 2.Powderly W G, Landay A, Lederman M M. J Am Med Assoc. 1998;280:72–77. doi: 10.1001/jama.280.1.72. [DOI] [PubMed] [Google Scholar]
- 3.Carr A, Samaras K, Burton S, Law M, Freund J, Chisholm D J, Cooper D A. AIDS. 1998;12:F51–F58. doi: 10.1097/00002030-199807000-00003. [DOI] [PubMed] [Google Scholar]
- 4.Miller K D, Jones E, Yanovski J A, Shankar R, Feuerstein I, Falloon J. Lancet. 1998;351:871–875. doi: 10.1016/S0140-6736(97)11518-5. [DOI] [PubMed] [Google Scholar]
- 5.Carr A, Samaras K, Chisholm D J, Cooper D A. Lancet. 1998;351:1881–1883. doi: 10.1016/S0140-6736(98)03391-1. [DOI] [PubMed] [Google Scholar]
- 6.Notermans D W, van Leeuwen R, Lange J M. Drug Saf. 1996;15:176–187. doi: 10.2165/00002018-199615030-00003. [DOI] [PubMed] [Google Scholar]
- 7.Gallant J E, Block D S. J Int Assoc Physicians AIDS Care. 1998;4:32–35. [PubMed] [Google Scholar]
- 8.Hall D B, Montaner J G S, Reiss P, Cooper D, Vella S, Dohnanyi C, Myers M, Lange J, Conway B. AIDS. 1998;12:F41–F44. doi: 10.1097/00002030-199807000-00001. [DOI] [PubMed] [Google Scholar]
- 9.Havlir D V, Marschner I C, Hirsch M S, Collier A C, Tebas P, Bassett R L, Ioannidis J P A, Holohan M K, Leavitt R, Boone G, et al. N Engl J Med. 1998;339:1261–1268. doi: 10.1056/NEJM199810293391801. [DOI] [PubMed] [Google Scholar]
- 10.Reijers M H E, Weverling G J, Jurriaans S, Wit F W N M, Weigel H M, Ten Kate R W, Mulder J W, Frissen P H J, van Leeuwen R, Reiss P, et al. Lancet. 1998;352:185–190. doi: 10.1016/s0140-6736(98)06193-5. [DOI] [PubMed] [Google Scholar]
- 11.Pialoux G, Raffi F, Brun-Vezinet F, Meiffredy V, Flandre P, Gastaut J A, Dellamonica P, Yeni P, Delfraissy J F, Aboulker J P. N Engl J Med. 1998;339:1269–1276. doi: 10.1056/NEJM199810293391802. [DOI] [PubMed] [Google Scholar]
- 12.Cooper D A, Emery S. N Engl J Med. 1998;339:1319–1321. doi: 10.1056/NEJM199810293391810. [DOI] [PubMed] [Google Scholar]
- 13.Garcia F, Plana M, Vidal C, Cruceta A, O'Brien W A, Panteleo G, Pumarola T, Gallart T, Miro J M, Gatell J M. AIDS. 1999;13:F79–F86. doi: 10.1097/00002030-199907300-00002. [DOI] [PubMed] [Google Scholar]
- 14.Lisziewicz J, Rosenberg E, Lieberman J, Jessen H, Lopalco L, Siliciano R, Walker B, Lori F. N Engl J Med. 1999;340:1683–1684. doi: 10.1056/NEJM199905273402114. [DOI] [PubMed] [Google Scholar]
- 15.Harrigan P R, Whaley M, Montaner J S G. AIDS. 1999;13:F59–F62. doi: 10.1097/00002030-199905280-00001. [DOI] [PubMed] [Google Scholar]
- 16.Neumann A U, Tubiana R, Calvez V, Robert C, Li T S, Agut H, Autran B, Katlama C. AIDS. 1999;13:677–683. doi: 10.1097/00002030-199904160-00008. [DOI] [PubMed] [Google Scholar]
- 17.Autran B, Carcelain G, Li T S, Blanc C, Mathez D, Tubiana R, Katlama C, Debre P, Leibowitch J. Science. 1997;277:112–116. doi: 10.1126/science.277.5322.112. [DOI] [PubMed] [Google Scholar]
- 18.Pakker N G, Notermans D W, de Boer R J, Roos M T, de Wolf F, Hill A, Leonard J M, Danner S A, Miedema F, Schellekens P T. Nat Med. 1998;4:208–214. doi: 10.1038/nm0298-208. [DOI] [PubMed] [Google Scholar]
- 19.Wong J K, Hezareh M, Gunthard H F, Havlir D V, Ignacio C C, Spina C A, Richman D D. Science. 1997;278:1291–1294. doi: 10.1126/science.278.5341.1291. [DOI] [PubMed] [Google Scholar]
- 20.Finzi D, Hermankova M, Pierson T, Carruth L M, Buck C, Chaisson R E, Quinn T C, Chadwick K, Margolick J, Brookmeyer R, et al. Science. 1997;278:1295–1300. doi: 10.1126/science.278.5341.1295. [DOI] [PubMed] [Google Scholar]
- 21.Chun T W, Stuyver L, Mizell S B, Ehler L A, Mican J A, Baseler M, Lloyd A L, Nowak M A, Fauci A S. Proc Natl Acad Sci USA. 1997;94:13193–13197. doi: 10.1073/pnas.94.24.13193. [DOI] [PMC free article] [PubMed] [Google Scholar]
- 22.Chun T W, Engel D, Mizell S B, Ehler L A, Fauci A S. J Exp Med. 1998;188:83–91. doi: 10.1084/jem.188.1.83. [DOI] [PMC free article] [PubMed] [Google Scholar]
- 23.Ho D D. Science. 1998;280:1866–1867. doi: 10.1126/science.280.5371.1866. [DOI] [PubMed] [Google Scholar]
- 24.Chun T W, Engel D, Mizell S B, Hallahan C W, Fischette M, Park S, Davey R T, Jr, Dybul M, Kovacs J A, Metcalf J A, et al. Nat Med. 1999;5:651–655. doi: 10.1038/9498. [DOI] [PubMed] [Google Scholar]
- 25.Natarajan V, Bosche M, Metcalf J A, Ward D J, Lane H C, Kovacs J A. Lancet. 1999;353:119–120. doi: 10.1016/s0140-6736(05)76156-0. [DOI] [PubMed] [Google Scholar]
- 26.Chun T W, Engel D, Berrey M M, Shea T, Corey L, Fauci A S. Proc Natl Acad Sci USA. 1998;95:8869–8873. doi: 10.1073/pnas.95.15.8869. [DOI] [PMC free article] [PubMed] [Google Scholar]
- 27.Chun T W, Carruth L, Finzi D, Shen X, DiGiuseppe J A, Taylor H, Hermankova M, Chadwick K, Margolick J, Quinn T C, et al. Nature (London) 1997;387:183–188. doi: 10.1038/387183a0. [DOI] [PubMed] [Google Scholar]
- 28.Chun T W, Davey R T, Jr, Engel D, Lane H C, Fauci A S. Nature (London) 1999;401:874–875. doi: 10.1038/44755. [DOI] [PubMed] [Google Scholar]
- 29.Zhang L, Ramratnam B, Tenner-Racz K, He Y, Vesanen M, Lewin S, Talal A, Racz P, Perelson A S, Korber B T, et al. N Engl J Med. 1999;340:1605–1613. doi: 10.1056/NEJM199905273402101. [DOI] [PubMed] [Google Scholar]
- 30.Furtado M R, Callaway D C, Phair J P, Kunstman K J, Stanton J L, Macken C A, Perelson A S, Wolinsky S M. N Engl J Med. 1999;340:1614–1622. doi: 10.1056/NEJM199905273402102. [DOI] [PubMed] [Google Scholar]
- 31.Rosenberg E S, Billingsley J M, Caliendo A M, Boswell S L, Sax P E, Kalams S A, Walker B D. Science. 1997;278:1447–1450. doi: 10.1126/science.278.5342.1447. [DOI] [PubMed] [Google Scholar]