

Abstract
Poor prenatal nutrition is associated with a greater risk of adult glucose intolerance and insulin insensitivity in the offspring. Skeletal muscle is the primary tissue for glucose utilization, and insulin resistance in muscle is the earliest identifiable abnormality in the pre-diabetic patient. We investigated the effect of early and late gestation undernutrition on structure and markers of growth and glucose metabolism regulation in the fetal triceps brachii (TB, slow- and fast-twitch myofibres) and soleus (slow-twitch myofibres) muscles. Pregnant sheep were fed 100% nutrient requirements (C, n = 8) or a restricted diet peri-implantation (PI, n = 9; 40%, 1–31 days gestation (dGA) (term ∼147)) or in late gestation (L, n = 6; 50%, 104–127 dGA). At 127 ± 1 dGA we measured myofibre and capillary density in the fetal TB and soleus muscles, and mRNA levels in the TB of insulin receptor (InsR), glucose transporter-4 (GLUT-4) and type 1 insulin-like growth factor receptor (IGF-1R). Total myofibre and capillary densities were lower in the TB, but not the soleus, of PI and L fetuses. The predominant effect in the L group was on slow-twitch myofibres. In TB, InsR, GLUT-4 and IGF-1R mRNA levels were greater in L group fetuses. Our finding of reduced myofibre density is consistent with a redistribution of resources at the expense of specific peripheral tissues by early and late gestation undernutrition which may be mediated by a decrease in capillary density. The increase in key regulatory components of glucose uptake following late gestation undernutrition may constitute a short-term compensation to maintain glucose homeostasis in the face of fewer type I (insulin-sensitive) myofibres. However, together these adaptations may influence the risk of later metabolic disease and thus our findings have implications for future strategies aimed at improving maternal diet.
Epidemiological studies link small size or thinness at birth with an increased risk of metabolic diseases such as glucose intolerance (Hales et al. 1991), insulin resistance (Phillips et al. 1994) and the metabolic syndrome (Cottrell & Ozanne, 2007) in adult life. Studies also suggest that individuals born small have reduced muscle strength in adult life (Sayer et al. 2004), with a consequent increase in disability and frailty. Skeletal muscle is the primary tissue for the utilization of glucose and insulin resistance in muscle is the earliest identifiable abnormality in pre-diabetic patients (Shulman, 2000). Recently, low birth weight has been associated with defects in the expression of insulin-signalling intermediates in young adult skeletal muscle which could be a precursor of longer term altered glucose handling (Ozanne et al. 2005). The early developmental nutrient environment is implicated since the offspring of women exposed to the Dutch Winter Famine (an abrupt onset 5 month period of malnutrition from 1944 to 1945) in the first trimester of pregnancy had an increased prevalence of coronary heart disease, raised lipids and obesity (Ravelli et al. 1999; Roseboom et al. 2000a,b), while famine exposure during late gestation was associated with decreased glucose tolerance in adult life (Ravelli et al. 1998). In accordance, nutrient restriction during peri-implantation increases postnatal blood pressure in sheep (Edwards & McMillen, 2002), while a late gestational challenge from 110 days gestation (dGA) to term resulted in glucose-intolerant offspring at 1 year of age (Gardner et al. 2005).
All skeletal muscle fibres are formed prenatally (Glore & Layman, 1983; Greenwood et al. 2000) and the timing of undernutrition in gestation is likely to be important since in the sheep, as in humans, there are three distinct waves of myofibre development which allows a large muscle mass to be achieved in these mammals (Maier et al. 1992). Primary fibres develop between 32 and 38 dGA and are used as a scaffold by developing secondary fibres from ∼38 dGA, and these in turn support a third wave of myofibre formation from 62 dGA (Wilson et al. 1992; Maier et al. 1992). The immediate impact of maternal undernutrition in late gestation on myofibre formation may be mediated in part by a redistribution of cardiac output at the expense of the peripheral tissues, including skeletal muscle, as observed in the late-gestation sheep fetus during hypoxia (Cohn et al. 1974; Giussani et al. 1993) and acute hypoglycaemia in late gestation (Burrage et al. 2005). Aside from its possible immediate impact on myofibre development, early gestation undernutrition is associated with impaired vasodilatation of small arteries of the femoral bed in the mid- (Nishina et al. 2003) and late- (Ozaki et al. 2000) gestation sheep fetus and appears to modify the peripheral cardiovascular response to a subsequent nutrient (oxygen or glucose) restriction in late gestation (Hawkins et al. 2000; Burrage et al. 2005) and may have additional implications for the development of skeletal muscle. The contribution of different muscles to posture and locomotion is closely related to their ratio of fast-twitch type II to slow-twitch type I (oxidative) myofibres underpinned by the differences between the myofibre types in terms of oxidative capacity, contraction velocity and ATP utilization. Type I myofibres are supplied by more capillaries than type II myofibres to support their higher oxidative capacity. In sheep 50% maternal undernutrition from 28 to 70 dGA (term = 147 days) decreased total myofibre number and increased fast myosin type IIb isoform levels in the longissimus dorsi of 8-month-old offspring (Zhu et al. 2006), whereas in other studies a similar challenge decreased the proportion of fast-twitch myofibres in the vastus lateralis of 14-day-old sheep (Fahey et al. 2005). A peri-conceptional (−18 to 6 days post ovulation) nutrient restriction (∼50%) decreased total myofibre number in the fetal semitendinosus muscle at 75 dGA (Quigley et al. 2005). Thus it is likely that the effect of undernutrition in utero on skeletal muscle fibre composition may depend on the timing of the challenge in gestation in relation to the waves of myofibre development, and may produce specific effects on different muscles.
The aim of this study was to investigate the effect of two distinct periods of nutrient restriction, peri-implantation or late gestation, on skeletal muscle morphology and capillary density in slow-twitch myofibre (soleus) and mixed (triceps brachii) muscle of late-gestation fetal sheep. Furthermore we investigated molecular markers of growth and glucose uptake pathways associated with any changes in myofibre composition.
Methods
All procedures were carried out with local ethics approval and in accordance with the regulations of the UK Home Office Animals (Scientific Procedures) Act, 1986.
Animals and study design
Welsh Mountain ewes of uniform body condition score (BCS 2.0–3.0; Russel et al. 1969) and age were randomized to control or diet-restricted groups, housed individually on wheat straw and fed a complete pelleted diet with free access to water (89.2% dry matter as fed, and provided 10.7 MJ (kg dry matter (metabolizable energy))−1 and 14.8% protein) from –16 dGA (adjusted to gestational age; AFRC, 1993). Oestrous was synchronized by removal of a vaginal medoxyprogesterone acetate-impregnated sponge (Veramix, Upjohn Ltd, Crawley, UK) 14 days after insertion. One of two twin rams (randomly assigned) was introduced for 2 days, and 0 dGA was taken as the first day that an obvious raddle mark was observed. Maternal weight and BCS were assessed, and maternal blood samples (36 ml onto chilled EDTA tubes) were taken from the jugular vein at 29 dGA (data not reported here).
Control animals (C, n = 8: female (f) = 4, male (m) = 4) were fed 100% of nutrient requirements throughout gestation. Peri-implantation nutrient-restricted animals (PI, n = 9: f = 4, m = 5) were fed 40% of nutrient requirements from 1 to 31 dGA and 100% at all other times. Late gestation nutrient-restricted animals (L, n = 6: f = 2, m = 4) were fed 50% of nutrient requirements from 104 dGA and 100% at all other times.
Postmortem
Pre-postmortem femoral arterial blood gases and glucose were measured using a blood gas analyser (ABL 735; Radiometer, Crawley, UK). Ewes and fetuses were killed with 40 ml i.v. sodium pentobarbitone (200 mg ml−1 Pentoject, Animalcare Ltd, UK) at 127 ± 1 dGA (term ∼147 dGA). Fetal biometry and organ weights were recorded (data not reported here). Mid-belly muscle samples of the triceps brachii and soleus muscles were removed immediately after death and frozen with fibres in a vertical orientation either by immersion into freezing isopentane (histology) or liquid nitrogen (molecular biology). All samples were stored at −80°C. Variations in the sampling of the muscle section were considered during subsequent histology validation.
Immunohistochemistry
Primary antibodies were monoclonal mouse anti-skeletal fast myosin, clone MY32 (to positively identify fast myofibres; Sigma, USA) and polyclonal rabbit anti-human von Willebrand factor (to positively identify capillary endothelial cells; DakoCytomation, Denmark). In brief, 10 μm transverse cryosections from the mid-belly sample of the fetal skeletal muscle were fixed in water-free acetone at room temperature for 15 min, and endogenous peroxidase activity was inhibited by incubation in 0.5% hydrogen peroxide in methanol for 30 min. Non-specific protein interactions were blocked with DMEM containing 20% fetal calf serum and 1% bovine serum albumin for 30 min and then incubated with either anti-skeletal fast myosin antibody (1 : 100°) or anti-human von Willebrand factor antibody (1 : 300) at 4°C overnight. All antibodies were diluted in Tris-buffered saline (TBS). After rinsing with TBS, sections were incubated for 30 min with biotinylated anti-mouse (1 : 400) or anti-rabbit (1 : 400) antibody. Sections were washed and treated for 15 min with streptavidin–biotin–peroxidase complex (1 + 1 : 200) and then for 10 min in amino ethyl carbazole. Finally, sections for myofibre analysis were counterstained with Mayers haematoxylin and baked with crystal mount (AbD Serotec, Kidlington, UK) before being mounted in Pertex (Surgipath, Peterborough, UK). A negative control section was processed simultaneously (methodology as above, replacing the primary antibody with TBS). All chemicals were from Sigma (USA), unless otherwise stated.
Image analysis
The myofibre density and size in the sections was assessed by using a photomicroscope (Zeiss, Axcorkep II) and the KS-400 image analysing system (Image Associates, Bicester, UK). Five microscopic images (validated as good representation of overall myofibre density, with < 4.8% error), with × 40 objective, were selected randomly from each section and imported into the KS-400 image analysing program. In each of these fields of view the total fascicular area was calculated, and using a non-biased counting frame, all myofibres, fast-twitch myofibres (identified as the red positively stained fibres) and slow myofibres (negatively stained white fibres, Fig. 1A) were counted, and their density expressed as the number of fibres per square millimetre of fascicle. In one representative muscle, we found similar myofibre density (< 2.5% variability) at three distinct sites along the length of the muscle (top, middle, bottom) suggesting that variation in muscle sampling was unlikely to influence myofibre number. The average cross-sectional area of the myofibres was defined by manually drawing around 300 individual fast-twitch and 150 slow-twitch fibres, with the cursor. Obvious deviations from a true cross-section were excluded from the analysis.
Figure 1. Counting fields from one representative fetus.
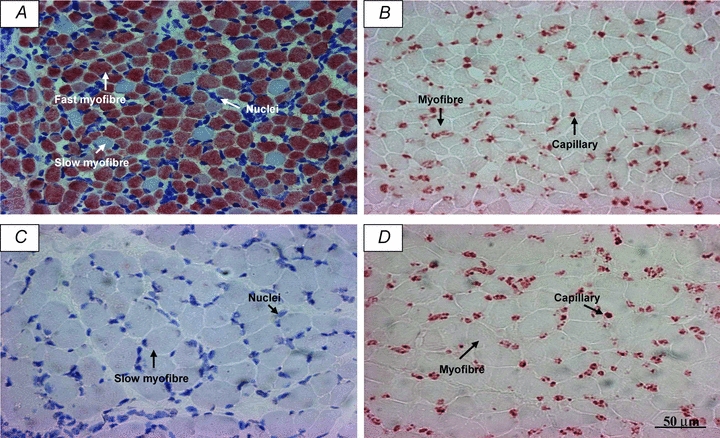
Slides were immunostained to visualize myofibres (A; red-positive staining of fast-twitch fibres and white-negative staining of slow-twitch fibres) and capillaries (B) in the triceps brachii, and myofibres (C; white-negative staining of slow-twitch fibres) and capillaries (D) in the soleus muscle. A and B also show haematoxylin staining of nuclei.
Capillaries were counted within the fascicular area of a further five random fields (validated as good representation of overall capillary density, with < 5.7% error) with a × 40 objective (Fig. 1B) and capillary density was expressed as capillary number per square millimetre of fascicle. The number of fibres from the same fields were counted and capillary/fibre ratio was calculated. In one representative muscle, we found similar capillary density (< 2.8% variability) and capillary : fibre ratio (< 4% variability) at three distinct sites along the length of the muscle (top, middle, bottom).
All measurements were made by one observer and the intraobserver variability tested by reproducing the counts from the same section, at different times. The intraobserver variability was less than 5% for all variables.
RNA isolation and real-time polymerase chain reaction
Total RNA was extracted from 127 dGA ovine fetal sheep triceps brachii muscle using TRIzol reagent (Invitrogen, UK) method. Quality and quantity of the RNA was assessed by spectrophotometry (A260 nm/A280 nm), and the integrity of the RNA was checked by formaldehyde gel electrophoresis and the visualization of intact 18S and 28S ribosomal RNA bands under ultraviolet light. Total RNA from each sample was reverse transcribed using standard protocols with random primers, RNase inhibitor and reverse transcriptase (Promega, UK). Then, real-time PCR (7500 Real-Time PCR System, Applied Biosystems, Warrington, UK) was used to evaluate the mRNA levels of InsR, GLUT-4, IGF-1R and GAPDH (internal housekeeping gene) using primers and probes designed with reference to published sequences (Table 1). Primers and probes (Eurogentec, Belgium) were designed using Primer Express Software (Applied Biosystems, USA). GAPDH expression was measured using SYBR Green, primers and reagents as designed and supplied in kit form by Primer Design, UK (http://www.primerdesign.co.uk). InsR, GLUT-4 and IGF-1R were expressed relative to total RNA concentration and GAPDH expression and the pattern of the resultant gene expression was similar in both cases. The GAPDH ratios were adopted as the s.e.m.s were smaller for group gene expression relative to GAPDH compared with total RNA and were in keeping with the use of a housekeeping gene for this type of analysis. Moreover, our recent observations in sheep liver suggested that GAPDH was the least variable compared to seven other housekeeping genes, two of them ribosomal proteins, using a sheep housekeeping gene kit (Primer Design, UK; F.W. Anthony, L. R. Green & L. Hollis, unpublished observations).
Table 1.
Primer and probe sequences (5′ to 3′) used in the measurement of mRNA levels by real-time polymerase chain reaction
| Target gene | Primers/probe | Sequence | Accession No. |
|---|---|---|---|
| Insulin receptor | Forward primer | ACC-GCC-AAG-GGC-AAG-AC | AJ844652 |
| Reverse primer | AGC-ACC-GCT-CCA-CAA-ACT-G | ||
| Probe | AAC-TGC-CCT-GCC-ACT-GTC-ATC-AAC-G | ||
| GLUT-4 | Forward primer | CCG-TGG-CAG-GAC-ATT-TGA-C | AY949177 |
| Reverse primer | TTC-CTG-CTC-CAG-AAG-AGA-AGG-T | ||
| Probe | ATC-TCA-GCC-GTC-TTC-CGC-CGG | ||
| IGF-1 receptor | Forward primer | CTG-CAG-CGC-CTC-TAA-CTT-TGT | AY162434.1 |
| Reverse primer | CAC-TGG-CCC-AGG-AAT-GTC-A | ||
| Probe | CAA-GAA-CCA-TGC-CTG-CAG-AAG-GAG-CA |
Data analysis
Data were normally distributed, are expressed as mean ±s.e.m. and were analysed by ANOVA with Bonferroni post hoc tests. Statistical significance was accepted when P < 0.05 and changes were considered as trends when 0.05 < P < 0.1.
Results
Myofibres
In the triceps brachii the density of all myofibres was reduced in both PI (P < 0.01) and L (P < 0.05) compared to C fetuses (Fig. 2A). Fast myofibre density tended to be lower in PI (P= 0.07), but not L, compared to C fetuses (Fig. 2B). Slow myofibre density was significantly lower in L (P < 0.05), but not PI, compared to C fetuses (Fig. 2C). Fast (C, 187 ± 10; PI, 209 ± 15; L, 195 ± 11 μm2) and slow (C, 307 ± 16; PI, 288 ± 13; L, 274 ± 18 μm2) fibre cross-sectional area was similar in all nutritional groups.
Figure 2. Myofibre density in the triceps brachii muscle of late gestation fetuses.
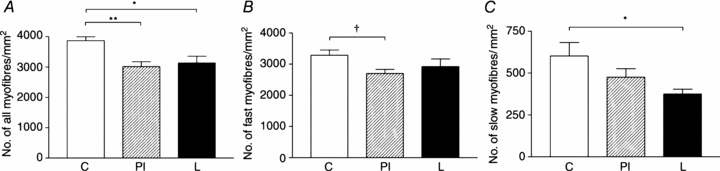
Density of all myofibres (A), fast-twitch fibres (B) and slow-twitch fibres (C) in control (C, n = 6), peri-implantation restricted (PI, n = 9) and late restricted (L, n = 6) groups. *P < 0.05; **P < 0.01; †P= 0.07.
In the soleus muscle there was no difference between groups in myofibre density (C, 1895 ± 107; PI, 1785 ± 143; L, 1734 ± 195 myofibres per mm2) or cross-sectional area (C, 463 ± 39; PI, 497 ± 47; L, 481 ± 55 μm2).
Capillaries
In the triceps brachii the density of capillaries was reduced in both the PI (P < 0.05) and L (P < 0.05) compared to C fetuses (Fig. 3A). Capillary : myofibre ratio was reduced in both the PI (P < 0.05) and L (P < 0.05) compared to C fetuses (Fig. 3B).
Figure 3. Capillary density and capillary : myofibre ratio in the triceps brachii muscle of late gestation fetuses.
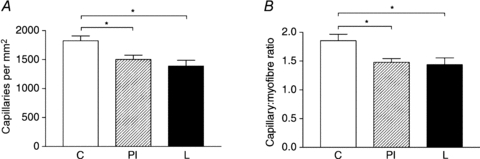
Capillary density (A) and capillary : fibre ratio (B) in control (C, n = 6), peri-implantation restricted (PI, n = 9) and late restricted (L, n = 6) groups. *P < 0.05.
In the soleus muscle there was no difference between groups in capillary density (C, 2975 ± 187; PI, 2962 ± 216; L, 2767 ± 261 capillaries per mm2) or capillary : myofibre ratio (C, 1.74 ± 0.13; PI, 1.70 ± 0.10; L, 1.67 ± 0.15).
Gene expression in triceps brachii muscle
Insulin receptor mRNA levels were greater in the triceps brachii muscle of L compared to C (P < 0.001) and PI (P < 0.001) fetuses (Fig. 4A). GLUT-4 mRNA levels tended to be higher in L compared to C fetuses (P= 0.1), and were significantly higher compared to PI fetuses (P < 0.05; Fig. 4B). Type 1 IGF receptor mRNA levels were significantly higher in L compared to C fetuses (P < 0.001) and PI (P < 0.001) fetuses (Fig. 4C). There were no significant correlations between myofibre density (total, type I or type II) and insulin receptor, type 1 IGF receptor and GLUT-4 gene expression.
Figure 4. Insulin receptor, glucose transporter 4 and type 1 insulin-like growth factor receptor mRNA levels of the triceps brachii muscle in late gestation fetuses.
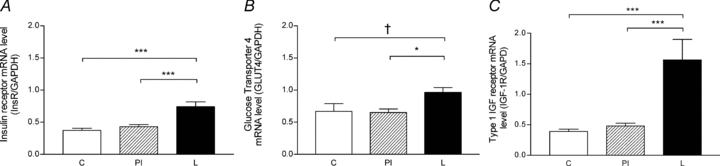
Insulin receptor (A), GLUT-4 (B) and type 1 IGF receptor (C) mRNA levels in control (C, n = 8), peri-implantation restricted (PI, n = 9) and late restricted (L, n = 6) groups. *P < 0.05; ***P < 0.001; †P = 0.1.
There was no difference between groups in glucose and blood gases just prior to postmortem (for all fetuses, pH, 7.378 ± 0.011;  , 42.02 ± 0.81 mmHg;
  , 15.96 ± 0.57 mmHg; glucose, 0.77 ± 0.03 mmol l−1).
Discussion
A suboptimal in utero nutrient environment is implicated in an increased risk of glucose intolerance and insulin resistance in adulthood. Skeletal muscle is the primary tissue for glucose utilization and this study has shown for the first time that both peri-implantation and late gestation undernutrition reduced myofibre density, capillary density and capillary : myofibre ratio in the triceps brachii, but not the soleus muscle, of late gestation fetuses. The decrease in myofibre density in the late restricted group was predominantly due to a decrease in type I (slow-twitch) fibres and was associated with increased insulin receptor, GLUT-4 and the type-1 IGF receptor gene expression.
Our finding that a peri-implantation nutritional challenge decreased the myofibre density is consistent with other studies (Quigley et al. 2005; Zhu et al. 2006). Muscle weights were not available in the current study; however, previous studies suggest that myofibre density can change without a change in muscle weight (Maxfield et al. 1998; Quigley et al. 2005). The peri-implantation challenge (1–31 dGA) coincides with the formation of the pool of myogenic cells and may therefore have decreased myoblast proliferation, and hence reduced the available pool of myoblasts and subsequent number of myofibres. The switch back to control nutrition in these animals at 32 dGA and the subsequent period of nutritional ‘catch-up’ may have encroached on the period during which primary (32 dGA) and secondary (38 dGA) myofibres emerge, although this cannot be confirmed by the current study. Placental growth is maximal during the first half of gestation (Schneider, 1996) and while not investigated in this study the peri-implantation undernutrition may have had additional effects on primary/secondary myofibre development through altered placental structure/function. Indeed treatment with somatotropin from 10 to 27 dGA has been shown to improve placental function (Rehfeldt et al. 2001a) and increase total myofibre number in the neonatal pig semitendinosus muscle (Rehfeldt et al. 2001b). Our late gestation challenge targeted part of the third wave of myogenesis and its effect on myofibre density in the triceps brachii muscle is probably through a reduction in this tertiary fibre formation. There was no change in the cross-sectional area of the myofibres with undernutrition and therefore it is not likely that our observed reduction in myofibre density was due to larger myofibres distorting the results (larger myofibres resulting in fewer counts), although we cannot rule out the contribution of increased extracellular tissue. While not assessed here, we speculate that any space created by the decrease in muscle fibre number may have been filled by connective tissue such as the endomysium which surrounds each individual myofibre.
Interestingly, there was no change in myofibre density or size in the slow-twitch soleus muscle, in agreement with previous studies using 40% maternal undernutrition throughout gestation in the neonatal guinea pig (Ward & Stickland, 1991). The soleus muscle may be less susceptible to prenatal undernutrition since it has a higher proportion of primary myofibres and previous studies have shown that, unlike secondary fibres, they are resistant to undernutrition (Ward & Stickland, 1991; Dwyer et al. 1994). Low birth weight is associated with reduced muscle mass in early childhood (Hediger et al. 1998) and impaired muscle strength in later life (Kuh et al. 2002; Sayer et al. 2004). In sheep, as in humans, the vast majority of myofibres are formed prenatally, and our findings suggest that undernutrition within critical windows of gestation is important in determining myofibre number in a muscle-specific manner. Such processes could contribute to poor muscle function in addition to the natural decline in muscle mass with advancing age.
In the L, but not the PI, group the proportion of type I (slow-twitch) fibres was reduced in the triceps brachii muscle. Previously, a 50% maternal undernutrition from 28 to 78 dGA increased the proportion of the myosin IIb isoform in the longissimus dorsi muscle in 8-month-old sheep (Zhu et al. 2006). However, maternal undernutrition of 50% between 30 and 70 dGA decreased the fast-twitch, and increased the slow-twitch, myofibres in the vastus lateralis of the ovine neonate (Fahey et al. 2005). The differences between these studies and our current findings is likely to be due to the timing of the nutritional challenge in relation to the waves of muscle development but may also be due in part to the different muscle beds that were studied. It was beyond the scope of this study to determine the impact of the observed changes in slow-twitch fibres on muscle function in later life. Slow-twitch fibres make up a small proportion of total fibres in the triceps brachii, and future studies could involve the measurement of fast myosin isoforms. Energy consumption due to movement is lower in the fetus than the adult, but the observed changes in myofibre composition could still impact on fetal energy requirements in the face of a poor in utero nutrient supply since slow-twitch fibres have a higher oxidative capacity, slower rate of ATP utilization and slower contraction velocity compared to fast-twitch fibres. We also observed, in the L group triceps brachii muscle, an increase in IGF type 1 receptor mRNA, a well-characterized regulator of fetal growth (Florini et al. 1996) and while this appears to be inconsistent with fewer myofibres it may reflect a compensatory increase in the expression of this gene in response to decreased growth.
Skeletal muscle has a rich blood supply to cope with the high energy demands of contraction. Capillary density was reduced in the triceps brachii of PI and L fetuses. Previous studies in sheep indicate that early gestation undernutrition alters peripheral blood flow in late gestation fetuses (Hawkins et al. 2000; Nishina et al. 2003), and that reduced substrate (oxygen and other nutrients) availability in late gestation causes a decrease in fetal peripheral blood flow (Giussani et al. 1993; Burrage et al. 2005). Thus we speculate that a reduced flow-mediated angiogenesis may mediate in part our observation of reduced capillary density. The absence of a difference between groups in pre-postmortem baseline blood glucose does not allow us to tell if any blood flow reduction was sustained in the peri-implantation undernutrition group. Each myofibre is served by several capillary vessels, slow-twitch fibres having more than the fast-twitch fibres to sustain their higher oxidative function (Andersen, 1975; Green et al. 1981). Indeed, capillary density and type I (slow-twitch) myofibre density are reduced in men and women with type II diabetes (Marin et al. 1994). Our observation of reduced capillary : fibre ratio in PI and L fetuses suggests that each fibre was supplied by fewer capillaries. Together with the lack of effect on capillary or myofibre density in the soleus muscle, these findings suggest a link between local blood flow and skeletal muscle growth during periods of undernutrition. It was beyond the scope of the present study to determine the mechanisms underlying the link between capillary and myofibre density, but future investigations may take direction from studies on the effects of hypoxia (Adair, 2005) and exercise (Prior et al. 2004).
Insulin receptor and GLUT-4 receptor mRNA levels were greater in the triceps brachii muscle from the L group. GLUT-4 is the major glucose transporter isoform in skeletal muscle and is the rate-limiting step in glucose utilization. Skeletal muscle is the major site for insulin-stimulated glucose uptake, and from the pattern of responses we speculate that the increase in density of two of the key components in this process may constitute a compensatory mechanism aimed at maintaining skeletal muscle glucose homeostasis in the face of the decrease in myofibres (particularly slow-twitch/insulin-sensitive myofibres) in the L group. We do not know if the altered mRNA levels were reflected in protein expression, and it was beyond the scope of the present study to determine the impact of such adaptations on postnatal glucose handling of the offspring. Increased expression of insulin receptor and improved GLUT-4 translocation in skeletal muscle of suckling rats from maternal protein restriction dams is associated with normal glucose tolerance (Gavete et al. 2005). However, previous studies in humans and sheep show that undernutrition in late gestation results in glucose intolerance in adulthood (Ravelli et al. 1998; Gardner et al. 2005). In humans, type II diabetes is associated with a shift towards a higher proportion of the type II (fast-twitch) fibres, at the expense of the type I (slow-twitch) (Marin et al. 1994) and in light of the fact that the proportion of slow/fast myofibres is largely determined prenatally we speculate that our observed changes in muscle fibre composition may precede longer term changes in glucose handling.
In conclusion our results have shown that decreased maternal nutrient intake in early and late gestation reduces fetal muscle fibre density in a muscle-specific manner and may be mediated by reduced capillary density. The increase in key regulatory components of glucose uptake following late gestation undernutrition may constitute a short-term compensation to maintain glucose homeostasis in the face of fewer type I (insulin-sensitive) myofibres. However, in the longer term the effects on fibre and capillary density may have ramifications for adult metabolic function, particularly if the postnatal nutrient environment is plentiful (Gluckman & Hanson, 2004). Our novel findings are therefore important for understanding the mechanisms by which poor maternal diet in specific windows of fetal development may impact on later risk of metabolic disease and muscle strength.
Acknowledgments
This work was funded by a Biotechnology and Biosciences Research Council project grant (D17858) to L.R.G. and M.A.H. and The Gerald Kerkut Trust. M.A.H. is supported by the British Heart Foundation. We are grateful to staff at the Biological Services Unit, Royal Veterinary College and the Biological Research Facility, University of Southampton for their expert animal care, and to staff at the Histochemistry Research Unit, Southampton General Hospital. We thank Drs Burrage and Braddick for their support.
References
- Adair TH. Growth regulation of the vascular system: an emerging role for adenosine. Am J Physiol Regul Integr Comp Physiol. 2005;289:R283–R296. doi: 10.1152/ajpregu.00840.2004. [DOI] [PubMed] [Google Scholar]
- AFRC. An Advisory Manual Prepared by the AFRC Technical Committee on Responses to Nutrients. Wallingford, UK: CAB International; 1993. Energy and protein requirements of ruminants. [Google Scholar]
- Andersen P. Capillary density in skeletal muscle of man. Acta Physiol Scand. 1975;95:203–205. doi: 10.1111/j.1748-1716.1975.tb10043.x. [DOI] [PubMed] [Google Scholar]
- Burrage D, Braddick L, Noakes D, Hanson M, Green L. Fetal cardiovascular responses to acute hypoglycaemia are modified by early gestation nutrient restriction in sheep. J Soc Gynecol Investig. 2005;12 [Google Scholar]
- Cohn H, Sacks E, Heymann M, Rudolph A. Cardiovascular responses to hypoxemia and acidemia in fetal lambs. Am J Obstetrics Gynecol. 1974;15:817–824. doi: 10.1016/0002-9378(74)90587-0. [DOI] [PubMed] [Google Scholar]
- Cottrell E, Ozanne S. Developmental programming of energy balance and the metabolic syndrome. Proc Nutr Soc. 2007;66:198–206. doi: 10.1017/S0029665107005447. [DOI] [PubMed] [Google Scholar]
- Dwyer CM, Stickland NC, Fletcher JM. The influence of maternal nutrition on muscle fiber number development in the porcine fetus and on subsequent postnatal growth. J Anim Sci. 1994;72:911–917. doi: 10.2527/1994.724911x. [DOI] [PubMed] [Google Scholar]
- Edwards LJ, McMillen IC. Periconceptional nutrition programs development of the cardiovascular system in the fetal sheep. Am J Physiol Regul Integr Comp Physiol. 2002;283:R669–R679. doi: 10.1152/ajpregu.00736.2001. [DOI] [PubMed] [Google Scholar]
- Fahey AJ, Brameld JM, Parr T, Buttery PJ. The effect of maternal undernutrition before muscle differentiation on the muscle fiber development of the newborn lamb. J Anim Sci. 2005;83:2564–2571. doi: 10.2527/2005.83112564x. [DOI] [PubMed] [Google Scholar]
- Florini JR, Ewton DZ, Coolican SA. Growth hormone and the insulin-like growth factor system in myogenesis. Endocr Rev. 1996;17:481–517. doi: 10.1210/edrv-17-5-481. [DOI] [PubMed] [Google Scholar]
- Gardner DS, Tingey K, Van Bon BWM, Ozanne SE, Wilson V, Dandrea J, Keisler DH, Stephenson T, Symonds ME. Programming of glucose-insulin metabolism in adult sheep after maternal undernutrition. Am J Physiol Regul Integr Comp Physiol. 2005;289:R947–R954. doi: 10.1152/ajpregu.00120.2005. [DOI] [PubMed] [Google Scholar]
- Gavete ML, Martin MA, Alvarez C, Escriva F. Maternal food restriction enhances insulin-induced GLUT-4 translocation and insulin signaling pathway in skeletal muscle from suckling rats. Endocrinology. 2005;146:3368–3378. doi: 10.1210/en.2004-1658. [DOI] [PubMed] [Google Scholar]
- Giussani D, Spencer J, Moore P, Bennet L, Hanson M. Afferent and efferent components of the cardiovascular reflex responses to acute hypoxia in term fetal sheep. J Physiol. 1993;461:431–449. doi: 10.1113/jphysiol.1993.sp019521. [DOI] [PMC free article] [PubMed] [Google Scholar]
- Glore S, Layman D. Cellular growth of skeletal muscle in weanling rats during dietary restrictions. Growth. 1983:403–410. [PubMed] [Google Scholar]
- Gluckman PD, Hanson MA. Developmental origins of disease paradigm: a mechanistic and evolutionary perspective. Pediatr Res. 2004;56:311–317. doi: 10.1203/01.PDR.0000135998.08025.FB. [DOI] [PubMed] [Google Scholar]
- Green H, Daub B, Houston M, Thomson J, Fraser I, Ranney D. Human vastus lateralis and gastrocnemius muscles. A comparative histochemical and biochemical analysis. J Neurol Sci. 1981;52:201–210. doi: 10.1016/0022-510x(81)90005-8. [DOI] [PubMed] [Google Scholar]
- Greenwood PL, Hunt AS, Hermanson JW, Bell AW. Effects of birth weight and postnatal nutrition on neonatal sheep. II. Skeletal muscle growth and development. J Anim Sci. 2000;78:50–61. doi: 10.2527/2000.78150x. [DOI] [PubMed] [Google Scholar]
- Hales CN, Barker DJ, Clark PM, Cox LJ, Fall C, Osmond C, Winter PD. Fetal and infant growth and impaired glucose tolerance at age 64. BMJ. 1991;303:1019–1022. doi: 10.1136/bmj.303.6809.1019. [DOI] [PMC free article] [PubMed] [Google Scholar]
- Hawkins P, Steyn C, Ozaki T, Saito T, Noakes DE, Hanson MA. Effect of maternal undernutrition in early gestation on ovine fetal blood pressure and cardiovascular reflexes. Am J Physiol Regul Integr Comp Physiol. 2000;279:R340–R348. doi: 10.1152/ajpregu.2000.279.1.R340. [DOI] [PubMed] [Google Scholar]
- Hediger ML, Overpeck MD, Kuczmarski RJ, McGlynn A, Maurer KR, Davis WW. Muscularity and fatness of infants and young children born small- or large-for-gestational-age. Pediatrics. 1998;102:e60. doi: 10.1542/peds.102.5.e60. [DOI] [PubMed] [Google Scholar]
- Kuh D, Bassey J, Hardy R, Aihie Sayer A, Wadsworth M, Cooper C. Birth weight, childhood size, and muscle strength in adult life: evidence from a birth cohort study. Am J Epidemiol. 2002;156:627–633. doi: 10.1093/aje/kwf099. [DOI] [PubMed] [Google Scholar]
- Maier A, McEwan JC, Dodds KG, Fischman DA, Fitzsimons RB, Harris AJ. Myosin heavy chain composition of single fibres and their origins and distribution in developing fascicles of sheep tibialis cranialis muscles. J Muscle Res Cell Motility. 1992;13:551–572. doi: 10.1007/BF01737997. [DOI] [PubMed] [Google Scholar]
- Marin P, Andersson B, Krotkiewski M, Bjorntorp P. Muscle fiber composition and capillary density in women and men with NIDDM. Diabetes Care. 1994;17:382–386. doi: 10.2337/diacare.17.5.382. [DOI] [PubMed] [Google Scholar]
- Maxfield EK, Sinclair KD, Dunne LD, Broadbent PJ, Robinson JJ, Stewart E, Kyle DG, Maltin CA. Temporary exposure of ovine embryos to an advanced uterine environment does not affect fetal weight but alters fetal muscle development. Biol Reprod. 1998;59:321–325. doi: 10.1095/biolreprod59.2.321. [DOI] [PubMed] [Google Scholar]
- Nishina H, Green LR, McGarrigle HHG, Noakes DE, Poston L, Hanson MA. Effect of nutritional restriction in early pregnancy on isolated femoral artery function in mid-gestation fetal sheep. J Physiol. 2003;553:637–647. doi: 10.1113/jphysiol.2003.045278. [DOI] [PMC free article] [PubMed] [Google Scholar]
- Ozaki T, Hawkins P, Nishina H, Steyn C, Poston L, Hanson MA. Effects of undernutrition in early pregnancy on systemic small artery function in late-gestation fetal sheep. Am J Obstetrics Gynecol. 2000;183:1301–1307. doi: 10.1067/mob.2000.107463. [DOI] [PubMed] [Google Scholar]
- Ozanne S, Jensen C, Tingey K, Storgaard H, Madsbad S, Vaag A. Low birthweight is associated with specific changes in muscle insulin-signalling protein expression. Diabetologia. 2005;48:547–542. doi: 10.1007/s00125-005-1669-7. [DOI] [PubMed] [Google Scholar]
- Phillips DI, Barker DJ, Hales CN, Hirst S, Osmond C. Thinness at birth and insulin resistance in adult life. Diabetologia. 1994;37:150–154. doi: 10.1007/s001250050086. [DOI] [PubMed] [Google Scholar]
- Prior BM, Yang HT, Terjung RL. What makes vessels grow with exercise training? J Appl Physiol. 2004;97:1119–1128. doi: 10.1152/japplphysiol.00035.2004. [DOI] [PubMed] [Google Scholar]
- Quigley SP, Kleemann DO, Kakar MA, Owens JA, Nattrass GS, Maddocks S, Walker SK. Myogenesis in sheep is altered by maternal feed intake during the peri-conception period. Anim Reprod Sci. 2005;87:241–251. doi: 10.1016/j.anireprosci.2004.11.005. [DOI] [PubMed] [Google Scholar]
- Ravelli ACJ, van der Meulen JHP, Michels RPJ, Osmond C, Barker DJP, Hales CN, Bleker OP. Glucose tolerance in adults after prenatal exposure to famine. Lancet. 1998;351:173–177. doi: 10.1016/s0140-6736(97)07244-9. [DOI] [PubMed] [Google Scholar]
- Ravelli ACJ, van der Meulen JHP, Osmond C, Barker DJP, Bleker OP. Obesity at the age of 50 y in men and women exposed to famine prenatally. Am J Clin Nutr. 1999;70:811–816. doi: 10.1093/ajcn/70.5.811. [DOI] [PubMed] [Google Scholar]
- Rehfeldt C, Kuhn G, Nurnberg G, Kanitz E, Schneider F, Beyer M, Nurnberg K, Ender K. Effects of exogenous somatotropin during early gestation on maternal performance, fetal growth, and compositional traits in pigs. J Anim Sci. 2001a;79:1789–1799. doi: 10.2527/2001.7971789x. [DOI] [PubMed] [Google Scholar]
- Rehfeldt C, Kuhn G, Vanselow J, Fürbass R, Fiedler I, Nürnberg G, Clelland A, Stickland N, Ender K. Maternal treatment with somatotropin during early gestation affects basic events of myogenesis in pigs. Cell Tissue Res. 2001b;306:429–440. doi: 10.1007/s00441-001-0475-x. [DOI] [PubMed] [Google Scholar]
- Roseboom TJ, van der Meulen JH, Osmond C, Barker DJ, Ravelli AC, Bleker OP. Plasma lipid profiles in adults after prenatal exposure to the Dutch famine. Am J Clin Nutr. 2000a;72:1101–1106. doi: 10.1093/ajcn/72.5.1101. [DOI] [PubMed] [Google Scholar]
- Roseboom TJ, van der Meulen JHP, Osmond C, Barker DJP, Ravelli ACJ, Schroeder-Tanka JM, van Montfrans GA, Michels RPJ, Bleker OP. Coronary heart disease after prenatal exposure to the Dutch famine, 1944–45. Heart. 2000b;84:595–598. doi: 10.1136/heart.84.6.595. [DOI] [PMC free article] [PubMed] [Google Scholar]
- Russel A, Doney J, Gunn R. Subjective assessment of body fat in live sheep. J Agric Sci. 1969;72:451–454. [Google Scholar]
- Sayer AA, Syddall HE, Gilbody HJ, Dennison EM, Cooper C. Does sarcopenia originate in early life? Findings from the Hertfordshire cohort study. J Gerontol A Biol Sci Med Sci. 2004;59:M930–M934. doi: 10.1093/gerona/59.9.m930. [DOI] [PubMed] [Google Scholar]
- Schneider H. Ontogenic changes in the nutritive function of the placenta. Placenta. 1996;17:15–26. doi: 10.1016/s0143-4004(05)80639-3. [DOI] [PubMed] [Google Scholar]
- Shulman GI. Cellular mechanisms of insulin resistance. J Clin Invest. 2000;106:171–176. doi: 10.1172/JCI10583. [DOI] [PMC free article] [PubMed] [Google Scholar]
- Ward S, Stickland N. Why are slow and fast muscles differentially affected during prenatal undernutrition? Muscle Nerve. 1991;14:259–267. doi: 10.1002/mus.880140310. [DOI] [PubMed] [Google Scholar]
- Wilson SJ, McEwan JC, Sheard PW, Harris AJ. Early stages of myogenesis in a large mammal: formation of successive generations of myotubes in sheel tibialis cranialis muscle. J Muscle Res Cell Motility. 1992;13:534–550. doi: 10.1007/BF01737996. [DOI] [PubMed] [Google Scholar]
- Zhu MJ, Ford SP, Means WJ, Hess BW, Nathanielsz PW, Du M. Maternal nutrient restriction affects properties of skeletal muscle in offspring. J Physiol. 2006;575:241–250. doi: 10.1113/jphysiol.2006.112110. [DOI] [PMC free article] [PubMed] [Google Scholar]