

Abstract
Calmodulin (CaM) binds to KCNQ2–4 channels within their carboxy termini, where it regulates channel function. The existing data have not resolved the Ca2+ dependence of the interaction between the channels and CaM. We performed glutathione S-transferase (GST)-pull-down assays between purified KCNQ2–4 carboxy termini and CaM proteins to determine the Ca2+ dependence of the interaction in vitro. The assays showed substantial Ca2+ dependence of the interaction of the channels with wild-type (WT) CaM, but not with dominant-negative (DN) CaM. To demonstrate CaM–channel interactions in individual living cells, we performed fluorescence resonance energy transfer (FRET) between ECFP-tagged KCNQ2–4 channels and EYFP-tagged CaM expressed in CHO cells, performed under total internal reflection fluorescence (TIRF) microscopy, in which excitation light only penetrates several hundred nanometres into the cell, thus isolating membrane events. FRET was assayed between the channels and either WT or DN CaM, performed under conditions of normal [Ca2+]i, low [Ca2+]i or high [Ca2+]i induced by empirically optimized bathing solutions. The FRET data suggest a strong Ca2+ dependence for the interaction between WT CaM and KCNQ2, but less so for KCNQ3 and KCNQ4. FRET between all KCNQ2–4 channels and DN CaM was robust, and not significantly Ca2+ dependent. These data show interactions between CaM and KCNQ channels in living cells, and suggest that the interactions between KCNQ2–4 channels and CaM are likely to have Ca2+-dependent and Ca2+-independent components.
Calmodulin (CaM) is the prototypic Ca2+-binding protein that has four EF hand-type Ca2+ binding sites and ion channels are among the numerous target proteins regulated by CaM binding (Saimi & Kung, 2002). CaM is constitutively tethered to Ca2+-activated K+ channels of the SK and IK classes, where it acts as the Ca2+ sensor mediating activation of the channels (Fanger et al. 1999; Joiner et al. 2001; Maylie et al. 2004). Similar Ca2+ sensing by CaM for a number of different voltage-gated Ca2+ channels (VGCCs) is now well established (Liang et al. 2003; Halling et al. 2006). Other examples of CaM-mediated regulation of channels are ‘ether-à-go-go’ (EAG) and cyclic nucleotide-gated (CNG) channels, for which CaM inhibits activity in a Ca2+-dependent manner (Schonherr et al. 2000; Trudeau & Zagotta, 2002; Bradley et al. 2004). Among the earliest descriptions of CaM action are some that involve its constitutive association with phosphorylase kinase, with Ca2+-dependent re-arrangements of the complex mediating regulation of the enzyme (Brushia & Walsh, 1999).
M-type currents, produced by the KCNQ (Kv7) family of voltage-gated subtypes (Wang et al. 1998; Shapiro et al. 2000), are found throughout the nervous system (Cooper et al. 2001; Cooper & Jan, 2003) where they play dominant roles in control of excitability and neuronal discharge (Jentsch, 2000; Robbins, 2001). Named M currents for their suppression by stimulation of muscarinic acetylcholine receptors in sympathetic neurons (Brown & Adams, 1980; Constanti & Brown, 1981), they are strongly modulated by receptors coupled to the Gq/11 family of G proteins by two intracellular mechanisms (reviewed in Delmas & Brown, 2005). The first is underlaid by the sensitivity of M channels to plasmalemmal levels of phosphatidylinositol 4,5-bisphosphate (PIP2) (Suh & Hille, 2002; Ford et al. 2003; Zhang et al. 2003; Li et al. 2005; Suh et al. 2006) and depletion of PIP2 in neurons upon muscarinic stimulation (Suh et al. 2004; Winks et al. 2005). The second exploits the high sensitivity of M channels to [Ca2+]i (Selyanko & Brown, 1996), which is mediated by CaM as their Ca2+ sensor (Gamper & Shapiro, 2003; Gamper et al. 2005a). Among the four Gq/11-coupled receptors in sympathetic neurons, the bradykinin B2 and purinergic P2Y types selectively release Ca2+ from internal stores and inhibit M channels not by depletion of PIP2, but rather by signals and Ca2+/CaM action on the channels (Cruzblanca et al. 1998; Bofill-Cardona et al. 2000; Gamper & Shapiro, 2003; Zaika et al. 2007).
Although interactions between CaM and M channels have been demonstrated using cell-free in vitro assays, they have not yet been demonstrated in living mammalian cells. The biochemistry and mutagenesis puts the locus of CaM binding to KCNQ1–5 channels within their carboxy termini (Wen & Levitan, 2002; Yus-Najera et al. 2002; Gamper & Shapiro, 2003; Gamper et al. 2005a; Ghosh et al. 2006; Shamgar et al. 2006). Of prime importance is whether CaM is constitutively ‘pretethered’ to KCNQ channels, as for SK K+ and voltage-gated Ca2+ channels, or not bound to the channels in the Ca2+-free or ‘apo’ form, as is the case for EAG and CNG channels (Schonherr et al. 2000; Trudeau & Zagotta, 2002; but cf. Bradley et al. 2004). For the case of M channels, there is wide discrepancy among the existing data regarding the Ca2+ dependence of the interaction between the C-termini of KCNQ channels and CaM. Our group showed over-expression in neurons of dominant-negative (DN) CaM (which cannot bind Ca2+) to block bradykinin and purinergic inhibition of M current, suggesting that apoCaM must bind to the channels; on the other hand, over-expression of wild-type (WT) CaM augmented tonic Ca2+–CaM inhibition of the channels, suggesting that such apoCaM binding is weak (Gamper & Shapiro, 2003; Gamper et al. 2005a; Zaika et al. 2007). Yus-Najera et al. (2002) found an unexpected inverse Ca2+ dependence, in which apoCaM was suggested to bind to the channels better than Ca2+–CaM (Yus-Najera et al. 2002). The Levitan lab has put forth a role for CaM in KCNQ trafficking and assembly, rather than Ca2+ sensing (Wen & Levitan, 2002; Shahidullah et al. 2005). In experiments performed by this group, the channel–CaM interactions showed little Ca2+ dependence.
We first sought to demonstrate CaM interactions with KCNQ channels in the milieu of living cells. Then, since it cannot be resolved from the existing data whether CaM binding to the channels is constitutive (the ‘pretethering’ model), or if CaM binding occurs only upon [Ca2+]i rises (the ‘dissociative’ model), we addressed this question by performing two types of assays. The first was glutathione S-transferase (GST) pull-down between purified KCNQ channel carboxy termini and CaM (WT or DN), performed under conditions of high or low [Ca2+]. The second was fluorescence resonance energy transfer (FRET) studies between enhanced cyan fluorescent protein (ECFP)-tagged KCNQ2–4 channels and enhanced yellow fluorescent protein (EYFP)-tagged CaM (WT or DN), performed under total internal reflection fluorescence (TIRF) microscopy, in which only events within the first several hundred nanometres into the cell are observed. Our results suggest significant association of non-calcified CaM with KCNQ2–4 channels, with generally stronger interactions at higher Ca2+ levels.
Methods
cDNA constructs
KCNQ2 (human), KCNQ3 (rat) and KCNQ4 (human) were subcloned into pECFP-N1 vector (Clontech, Mountain View, CA, USA) by EcoRI/Age I, SalI/Age I and SalI/AgeI restriction sites, respectively. Plasmids containing wild-type (WT) or dominant-negative (DN) vertebrate CaM (given to us by Trisha Davis, University of Washington) were subcloned into the pEYFP-C1 vector (Clonetech) using XmalI/SalI sites. DN CaM has an alanine substitution in each of the four Ca2+-binding EF hands (D20A, D56A, D93A and D129A). The C-termini of KCNQ2 (amino acids 319–650), KCNQ3 (324–621), KCNQ4 (328–695) and CaM (WT and DN) were subcloned into pGEX-KG (Pharmacia). The membrane-localized ECFP–EYFP tandem construct (Rho-pYC) was kindly given to us by Paul Slesinger (Salk Institute, La Jolla, CA, USA). It consists of the C-terminal prenylation site of Rho (RQKKRRGCLLL) appended to the C-terminus of a EYFP–ECFP fusion (Fowler et al. 2007). ECFP-tagged calnexin was kindly given to us by Patricia Camacho (UTHSCSA, San Antonio, TX). pECFP-Mem and pEGFP-Mem plasmids were purchased from Clonetech.
Cell culture and transfections
Chinese hamster ovary (CHO) cells were grown in 100 mm tissue culture dishes (Falcon) in Dulbecco's modified Eagle's medium (DMEM) with 10% heat-inactivated fetal bovine serum plus 0.1% penicillin–streptomycin in a humidified incubator at 37°C (5% CO2) and passaged about every 4 days. Cells were discarded after about 30 passages. For TIRF/FRET experiments, cells were first passaged onto 35 mm plastic tissue-culture dishes and transfected 24 h later with Polyfect reagent (Qiagen) according to the manufacturer's instructions and as previously described (Gamper et al. 2005b). The next day, cells were plated onto poly l-lysine coated glass-bottomed 35 mm tissue-culture dishes (MatTek, Ashland, MA, USA) and experiments performed over the following 1–2 days.
TIRF/FRET studies
TIRF microscopy
Fluorescence emission from enhanced cyan fluorescent protein (ECFP)-tagged KCNQ2–4 channels and enhanced yellow fluorescent protein (EYFP)-tagged WT or DN CaM was collected from transiently transfected CHO cells at room temperature using total internal reflection fluorescence (TIRF) (also called evanescent field) microscopy. TIRF generates an evanescent field that declines exponentially with increasing distance from the interface between the cover glass and the cytoplasm, illuminating only a thin section (300 nm) of the cell in contact with the cover glass, including the plasma membrane (Axelrod, 2003). All TIRF experiments were performed in the total internal reflection fluorescence microscopy core facility housed within the Department of Physiology at the UTHSCSA (http://physiology.uthscsa.edu/core_facilities/tirf_core_facility.asp). Fluorescence emissions were collected using an inverted TE2000 microscope with through-the-lens (prismless) TIRF imaging (Nikon). This system is equipped with a vibration isolation system (Technical Manufacturing Corp., Peabody, MA, USA) to minimize drift and noise. Samples were viewed through a plane Apo TIRF 60× oil immersion high resolution (1.45 numerical aperture) TIRF objective. Coupled to the microscope is a laser light delivery system (Prairie Technologies, Middleton, WI, USA) consisting of a 40 mW argon laser outputting 488 and 514 nm lines and a 442 nm diode pumped solid-state laser. The excitation light was selected with an acoustic optical tunable filter, controlled by Metamorph software (Molecular Devices, Downingtown, PA, USA) running on a PC. ECFP and EYFP emission was simultaneously collected using the Dual-View chip splitter (Optical Insights, Photometrics, Tucson, AZ, USA), equipped with a filter cube containing HQ470 nm/30 m and HQ550 nm/30 m emission filters for ECFP and EYFP emission, respectively, and a 505 nm dichroic mirror for separation of emission wavelengths. In this configuration, the microscope uses only a dual-bandpass TIRF dichroic mirror to separate the excitation and emission light, with no excitation filters used. The TIRF angle was adjusted by eye to give the signature TIRF illumination to the experimental chamber. Fluorescence images were collected and processed with a 16-bit, cooled charge-coupled device camera (Cascade 512F; Photometric, Tucson, AZ, USA) interfaced to a PC running MetaMorph software. This camera uses a front-illuminated EMCCD with on-chip multiplication gain. Images were collected (200–600 ms exposure time) immediately before and after photobleaching. Images were not binned or filtered, with pixel size corresponding to a square of 122 nm × 122 nm.
Fluorescence resonance energy transfer (FRET)
We used the acceptor photobleaching method of evaluating FRET efficiency, in which the emission of the donor fluorophore is compared before and after photobleaching of the acceptor (Centonze et al. 2003). EYFP photobleaching was performed using the 100 W mercury lamp of the microscope, using a standard YFP filter cube. All image acquisition was computer-controlled by MetaMorph software. We find that a 5–7 min excitation by the mercury lamp using the YFP cube is sufficient to photobleach > 80% of the EYFP fluorophores, yet results in negligible photobleaching of the ECFP fluorophores. The following protocol was used. The media in the glass-bottomed dishes was exchanged with Ringer solution that contained (mm): 160 NaCl, 5 KCl, 1 MgCl2, 10 Hepes, pH 7.4 with NaOH to which was added either 2 mm CaCl2 (‘normal [Ca2+]i’), 10 mm EGTA (‘low [Ca2+]i’) or a cocktail of 2 mm Ca2++ 1.15 mm HEDTA + 5 μm ionomycin (‘[Ca2+]i-raising solution’). This latter solution was empirically found to most optimally raise intracellular [Ca2+]i of CHO cells in a sustained manner, suitable for FRET analysis. Cells were first examined using the mercury lamp and CFP or YFP filter cubes to find a suitable cell robustly expressing both ECFP-tagged channels and EYFP-tagged CaM. Under TIRF illumination, the focal plane used is critical, and was adjusted if necessary immediately before each image acquisition to obtain a sharp TIRF image. The focusing and cell-centring protocol resulted in ECFP photobleaching of < 1%. TIRF images using 442 and 514 laser lines were acquired before and after photobleaching of the EYFP fluorophores. Percentage FRET (%FRET) was calculated as the percentage increase in ECFP emission after EYFP photobleaching by using the formula:
where ECFPpost and ECFPpre are the ECFP emissions after and before EYFP photobleaching, respectively. The %FRET was calculated by drawing regions of interest around the cell and subtracting the background in a cell-free region for each image. In experiments designed to estimate the degree of membrane isolation achieved by TIRF illumination, cells transfected with ECFP- or EGFP-tagged proteins were illuminated by either the 100 W mercury lamp under standard wide-field epi-fluorescence, using standard CFP or GFP filter cubes, or by the 442 or 488 argon laser lines under TIRF illumination. The camera exposure used in both the cases was 500 ms.
GST pull-downs
Pellets of BL-21 bacteria transformed with the indicated GST-tagged domain of KCNQ2–4 C-termini were lysed in 10 ml lysis buffer (100 mm KCl, 50 mm Tris, pH 7.6) with a 60 Sonic Dimembrator (Fisher Scientific) 5X (1 min on, 1 min off) on ice. Before each sonication, 20 μl of each of the following protease inhibitors was added to the cultures: pepstatin (1.4 mg/10 ml, Sigma) and leupeptin, 0.95 mg/10 ml, Sigma) made fresh in methanol, PMSF (17 mg ml−1, Sigma) made fresh in acetone, for a total for each inhibitor of 100 μl per 10 ml of bacterial culture. After lysing with the sonicator, triton X-100 (1%, Sigma) was added. Proteins were collected by spinning down at 10 000 g for 45 min at RT, and the supernatant containing the proteins titrated to pH 7.6. Supernatants were incubated with 2 ml of immobilized glutathione beads (Pierce) on a rotator at 4°C overnight. Beads were spun down at 4000 r.p.m. for 5 min, the supernatant discarded, and beads washed 3 times with lysis buffer. Protein expression and protein-bound glutathione beads were confirmed using a 10% SDS-PAGE gel. GST pull-down experiments were performed using 30 μl of the protein/bead slurry, to which was added 0.5 μg of purified calmodulin (prepared using standard techniques) in 400 μl of pull-down buffer (50 mm Hepes, 50 mm NaCl, 10% glycerol, 1 mm EDTA, 2 mm CaCl2). Samples were rotated for 2–3 h at 4°C. The beads were rinsed 3 times with pull-down buffer (containing either Ca2+ or EGTA), and run on a 15% SDS-PAGE gel, transferred to nitrocellulose, and immunoblotted with mouse anti-calmodulin (Research Diagnostics, Concord, MA, USA).
Ca2+ imaging
Experiments were performed with an inverted Nikon (Tokyo, Japan) Eclipse TE300 microscope with an oil-immersion 40×/1.30 numerical aperture objective. A Polychrome IV monochromator (T.I.L.L. Photonics, Martinsreid, Germany) was used as the excitation light source, and a FURA271000 filter cube (Chroma Technology, Brattleboro, VT) was used for fura-2 imaging. CHO cells were bath loaded with fura-2 AM (2 μm) for 30 min at 37°C in the presence of pluronic acid (0.01%). Cells were excited alternately at 340 and 380 nm (50–200 ms every 3 s), the fluorescence emission collected by an IMAGO 12-bit cooled CCD camera, and images were stored/analysed with TILLvisION 4.0 software.
Analysis
All values are reported as means ±s.e.m. Statistical significance was assessed using Student's t test. The results obtained were considered significant at P < 0.05.
Results
Pull-down of CaM by purified C-termini of KCNQ2–4 channels is Ca2+ dependent
To test the Ca2+ dependence of the interaction between CaM and KCNQ2–4 channels, we expressed KCNQ2 (319–650), KCNQ3 (324–621), and KCNQ4 (328–695) as GST fusion proteins for use in pull-down assays. Assays were first performed between the GST-tagged KCNQ2–4 domains immobilized on glutathione agarose beads and WT CaM, in the presence of Ca2+ or EGTA (both 2 mm) (Fig. 1). As expected, strong binding was observed in the presence of Ca2+ between WT CaM and the carboxy-termini GST fusion proteins of KCNQ2–4. Slightly reduced, but still robust, binding was detected between WT CaM and glutathione beads immobilized with the GST–KCNQ2 C-terminal protein incubated in the 0 Ca2+ EGTA-containing buffer. For the KCNQ3 and KCNQ4 proteins, Ca2+-independent binding was more modest, but still clearly detectable. GST itself did not pull down any WT CaM, either in the presence or absence of Ca2+. Thus, the in vitro interaction between WT CaM and the purified KCNQ C-termini shows a clear, but not overwhelming, Ca2+ dependence (Fig. 1A). We then assayed the Ca2+ dependence of the interaction of the KCNQ2–4 C-termini and dominant-negative (DN) CaM, in which all four EF-hands have the aspartate-to-alanine mutation, rendering it unable to bind Ca2+ (Geiser et al. 1991). DN CaM was similarly incubated with the GST fusion channel C-termini immobilized on glutathione agarose beads in the presence of Ca2+ or EGTA. The interaction between DN CaM and the KCNQ2–4 C-terminal fusion proteins was strong and showed no significant Ca2+ dependence (Fig. 1A). GST itself did not pull down any DN CaM as well, in either the presence or the absence of Ca2+. Using image densitometry, we semiquantified the Ca2+ dependence of the interaction between the channels and CaM by calculating the ratio of the immunolabelled CaM bands on the gels in the presence to those in the absence of Ca2+ (Fig. 1B). For WT CaM, those ratios for KCNQ2, KCNQ3 and KCNQ4 were 1.4 ± 0.1- (n = 5), 2.4 ± 0.7- (n = 3) and 2.1 ± 0.7-fold (n = 3), respectively. For DN CaM, the ratios were all nearer to unity (1.3 ± 0.3-, 1.0 ± 0.3- and 1.20 ± 0.4-fold, respectively, n = 4, 4, 5).
Figure 1. The interaction between purified C-termini of KCNQ2–4 and WT CaM, but not DN CaM, is Ca2+ dependent.
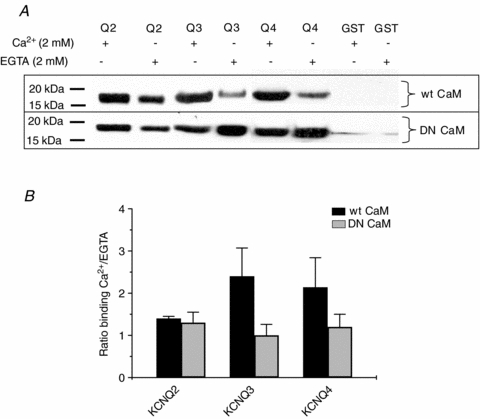
A, representative pull-down assays between the C-termini of KCNQ2–4 channels and wild-type (WT) or dominant-negative (DN) CaM. Beads were immobilized with GST–KCNQ2 (319–650), KCNQ3 (324–621) or KCNQ4 (328–695), incubated with WT or DN CaM under either 2 mm Ca2+ or 2 mm EGTA in PBS buffer, the proteins separated under SDS-PAGE and immunoblotted with anti-CaM antibodies. B, quantification of pull-down assays for WT CaM or DN CaM. The bands as in A were quantified by densitometry. Bars indicate the ratio of band intensities in 2 mm Ca2+ to those in EGTA.
These pull-down results suggest that the interaction between the C-termini of KCNQ2–4 and WT CaM is modestly Ca2+ dependent, but that apoCaM can still bind to the channel proteins. They also suggest that the interaction between the channels and DN CaM is also pronounced and, as one might expect, not Ca2+ dependent. We should note that the data in Fig. 1 cannot be use to quantitatively compare the binding of apo WT CaM and DN CaM to the channels, since the cellular lysates come from different dishes of cells that were used for separate transfections. However, the blots are reasonable indicators of Ca2+ dependence, since for each channel the pull-downs in the presence or absence of Ca2+ use the same lysates. As discussed below, the significant but modest Ca2+ dependence of WT CaM binding, and the significant binding of DN CaM are all consistent with our previous electrophysiological and imaging experiments (Gamper & Shapiro, 2003; Gamper et al. 2005a; Zaika et al. 2007). However, the pull-down experiments, in which protein–protein interactions are assayed in a test tube, have the inherent limitations intrinsic to non-cellular conditions.
FRET between ECFP-tagged KCNQ2–4 and EYFP-tagged CaM under TIRF microscopy
Since the behaviour of protein–protein interactions in vitro may be considerably different from that in vivo, we sought to perform assays in the native intracellular environment of the cell. As such a method, we chose fluorescence resonance energy transfer (FRET), in which interactions are monitored as non-radiative energy transfer between two fluorophores for which the emission spectrum of one (the ‘donor’) overlaps with the excitation spectrum of the other (the ‘acceptor’). FRET has the very steep dependence on distance between the fluorophores, with an efficiency that falls off with the sixth power of the distance between the fluorophores, relative to the Förster distance (which is typically ∼50 Å). If a pair of fluorophores is attached to two proteins, then only if they are in very close proximity, such as when bound together, will there be appreciable FRET (Sekar & Periasamy, 2003). We employed the widely used FRET pair of enhanced cyan fluorescent protein (ECFP) and enhanced yellow fluorescent protein (EYFP), fused to KCNQ2–4 channels and CaM, respectively. FRET was measured in Chinese hamster ovary (CHO) cells transiently transfected with the ECFP-tagged channels and EYFP-tagged WT or DN CaM, visualized under total internal reflection fluorescence (TIRF) microscopy (Axelrod, 2003). TIRF illumination involves directing a laser beam at the interface between two transparent media of differing refractive indices at a glancing angle. By the laws of optics, at an angle greater than the critical angle determined by the ratio of the two refractive indices, the light beam is not primarily transmitted to the second medium, but is instead reflected; however, not all the light energy is reflected – a component penetrates into the second medium as an ‘evanescent wave’ (EW) that decays exponentially in intensity over a distance of only several hundred nanometers. In this case, the two refractive media are the glass coverslip and the cytoplasm. Thus, we can selectively excite only fluorophores located within ∼300 nm of the plasma membrane of the cell by directing laser light at such a glancing angle through a special TIRF objective (Steyer & Almers, 2001).
Although earlier TIRF control experiments comparing emission from membrane-anchored or cytoplasmic fluorescent proteins suggest that our TIRF set-up offers selective visualization of plasma membrane fluorophores without contamination from fluorophores in the cytoplasm (Staruschenko et al. 2004), we decided to test the degree of such isolation of membrane proteins in a more quantitative way. We were especially motivated by the recent literature documenting the mechanism of store-operated (also known as Ca2+ release-activated) Ca2+ currents as involving the intimate association of ER membrane-resident Ca2+ sensors, the STIM proteins, with plasma-membrane Ca2+ channels called Orai (Liou et al. 2005; Wu et al. 2006). In our first test, CHO cells were transfected with either ECFP-tagged calnexin, an ER membrane-resident protein (Ellgaard & Frickel, 2003), or membrane-targeted ECFP (ECFP-Mem), and the cells imaged under either wide-field epi-fluorescence or TIRF illumination. The cells expressing ECFP-Mem were used to calibrate the relative emission that is induced between the two types of illumination for a known membrane protein. As expected, bright emission from ECFP-Mem was obtained under either wide-field or TIRF (Fig. 2A, right). By comparison, emission from ECFP-tagged calnexin was much dimmer under TIRF than under wide-field, indicating that relatively little incident EW radiation penetrates to the ER. However, because the level of expression of ECFP-calnexin in CHO cells was relatively low, and to confirm these results using another protein, we performed the same comparison for ER-localized EGFP (EGFP-ER) and EGFP-Mem. Those results were even more striking. Indeed, the emission from EGFP-ER under TIRF illumination was much weaker than under wide-field (Fig. 2B, left), confirming the lack of appreciable illumination of the ER under TIRF. As for ECFP-Mem, the emission from EGFP-Mem was bright under both types of illumination. These experiments are summarized in Fig. 2C. Since the absolute values obtained are dependent on the relative brightness of the laser line or the mercury lamp used, the filter cubes employed and other factors, the pertinent comparisons are the relative ratios between wide-field and TIRF, as plotted. These control experiments suggest that TIRF is indeed a good technique for observing plasma membrane events in relative isolation, with only minor illumination of submembrane molecules, such as those in the ER membrane.
Figure 2. TIRF microscopy isolates events in the plasma membrane of CHO cells.
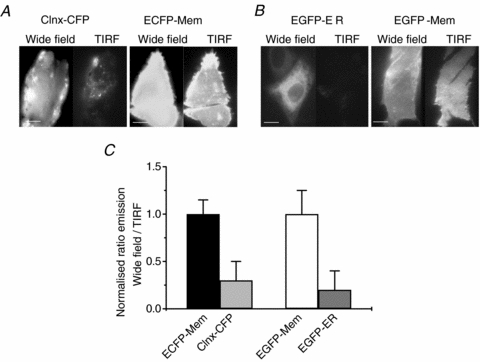
A, images of ECFP-tagged endoplasmic reticulum protein calnexin and membrane-targeted ECFP (ECFP-Mem). Note that under TIRF, much less signal is obtained from ECFP-tagged calnexin compared with membrane-targeted ECFP. B, images of endoplasmic reticulum-targeted EGFP (EGFP-ER) and membrane-targeted EGFP (EGFP-Mem). Scale bars in A and B are 5 μm. C, summarized data showing the normalized intensities from both proteins under wide field or under TIRF (n = 15, 21).
In our TIRF/FRET experiments, we sought to compare FRET under the conditions of normal, low, or high [Ca2+]i. For normal [Ca2+]i we used a bathing solution containing 2 mm Ca2+; to obtain low [Ca2+]i we used a bathing solution containing 0 added Ca2+ plus EGTA (10 mm), which we have found in control experiments to substantially lower [Ca2+]i to ≤ 30 nm within 10 min. Various conditions were tested to find a suitable protocol in order to substantially increase [Ca2+]i for a time sufficient to perform TIRF/FRET experiments, but without killing the cells. Using fura-2 imaging experiments, in which cells were loaded with fura-2 dye as the AM ester (Gamper et al. 2005a), we empirically found a solution containing 2 mm Ca2++ 1.15 mm HEDTA + 5 μm ionomycin to be optimal. This solution will be referred to as the ‘[Ca2+]i-raising solution’. Figure 3 summarizes the results of these experiments, showing the ability to substantially raise [Ca2+]i for a sustained period in a reversible manner consistent with continued cell viability. Although the calibration of esterified [Ca2+]i-reporter dyes is inherently difficult (Zhou & Neher, 1993), our previous work suggests the values of normal, low and raised [Ca2+]i observed in these experiments to be about 120 nm, 30 nm and 400 nm, respectively. We will refer to the three solutions as producing normal, low or high [Ca2+]i conditions. In the experiments below in which FRET was measured under low or high [Ca2+]i, cells were incubated with the EGTA-containing or the [Ca2+]i-raising solution, respectively, for at least 10–15 min before images were acquired. The high [Ca2+]i measurements were made for any test involving WT CaM, for which the possibility of greater Ca2+ saturation seems possible.
Figure 3. Optimization of raising intracellular [Ca2+] in CHO cells.
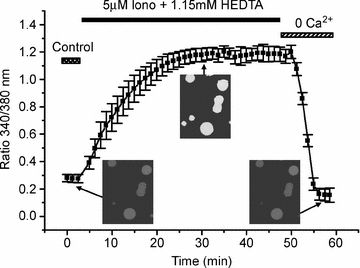
Summarized fura-2 emission data plotted as a function of time during the experiment as the ratio of 340/380 excitation from CHO cells under normal Ca2+ (control), in [Ca2+]i-raising solution containing 2 mm Ca2++ 1.15 mm HEDTA + 5 μm ionomycin, or with 0 added Ca2+ and 10 mm EGTA. The data have been binned in 75 s increments. Shown in the insets are representative ratiometric images taken at the indicated times, shown in pseudo-greyscale.
We initially performed control experiments using the Rho-pYC construct consisting of a membrane-targeted fusion of ECFP and EYFP to assess the suitability of the method for our requirements (Fowler et al. 2007). FRET efficiency was calculated using the formula as described (Methods). The FRET efficiency for this fusion construct was 26.0 ± 1.2% (n = 18) under normal [Ca2+]i and 28.7 ± 2.2% (n = 18) under low [Ca2+]i (Fig. 4A and C). For these experiments, the percentage EYFP photobleach was 83.1 ± 0.6% (n = 36). As a negative FRET control, we coexpressed ECFP-Mem with EYFP-tagged CaM (WT or DN). The FRET efficiency between ECFP-Mem and EYFP-tagged WT CaM was 9.4 ± 1.2% (n = 31) in normal [Ca2+]i, 5.5 ± 4% in high [Ca2+]i and 5.2 ± 0.7% (n = 29) in low [Ca2+]i. For EYFP-tagged DN CaM, the FRET efficiency was 8.1 ± 2.8% (n = 30) and 6.5 ± 0.9% (n = 30), respectively (Fig. 4B and C). For these experiments, the percentage EYFP photobleach was 78.4 ± 0.6% (n = 60). We used these negative FRET controls as an upper limit to the ‘spurious FRET’ in our experiments arising from incidental proximity of the two fluorophores (Erickson et al. 2003). Thus, all of the subsequent FRET values obtained had these ‘spurious FRET’ control values subtracted from them.
Figure 4. Positive and negative controls for FRET under TIRF microscopy.
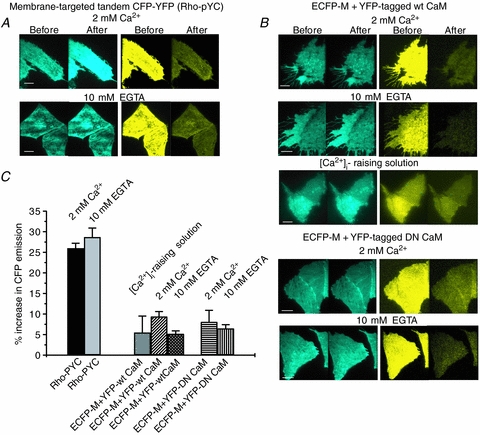
A, images of ECFP (left panels) and EYFP (right panels) emissions from cells expressing a membrane targeted tandem construct of ECFP and EYFP (Rho-pYC), before and after selective photobleaching of EYFP. Experiments were conducted with either 2 mm Ca2+ or 10 mm EGTA, in the bath. Note the substantial increase in ECFP emission after the effective EYFP photobleaching in both cases, indicating robust FRET. B, images of ECFP (left panels) and EYFP (right panels) emissions from cells coexpressing membrane-targeted ECFP and either EYFP tagged WT (upper) or DN (lower) CaM, before and after selective photobleaching of EYFP. For WT CaM, experiments were conducted with either 2 mm Ca2+, 10 mm EGTA or the [Ca2+]i-raising solution in the bath. For DN CaM, experiments were performed with either 2 mm Ca2+ or 10 mm EGTA in the bath. Note the lack of increase in ECFP emission after the effective EYFP photobleaching in all cases, indicating minimal FRET. Scale bars in A and B are 5 μm. C, bars showing the summarized FRET efficiency, calculated as the percentage increase in ECFP emission after EYFP photobleaching, under the indicated conditions.
Satisfied with the robustness of our TIRF/FRET paradigm, we evaluated the FRET between ECFP-tagged KCNQ2–4 channels and EYFP-tagged CaM (WT or DN) heterologously expressed in CHO cells. For KCNQ2, strong FRET was observed with WT CaM under normal and high [Ca2+]i that was considerably less under low [Ca2+]i conditions. Strong FRET was also observed between the channels and DN CaM, either under normal or low [Ca2+]i. Shown in Fig. 5A are representative ECFP and EYFP images before and after EYFP photobleaching, and the data are summarized in Fig. 5C. In cells expressing ECFP-tagged KCNQ2 and EYFP-tagged WT CaM, the FRET signal was 16.9 ± 3.8% (n = 12) under normal [Ca2+]i, which was not significantly greater under high [Ca2+]i, 15.5 ± 2.2% (n = 10), but was significantly reduced to 7.5 ± 2.2% (n = 11, P < 0.05) under low [Ca2+]i. For cells expressing ECFP-tagged KCNQ2 and EYFP-tagged DN CaM, there was robust FRET under normal [Ca2+]i (18.8 ± 2.7%, n = 12), which was marginally, but not significantly, less for cells tested under low [Ca2+]i (13.5 ± 2.5%, n = 12). For the experiments on KCNQ2, the percentage EYFP photobleach was 80.1 ± 1.0% (n = 47).
Figure 5. FRET/TIRF between ECFP-tagged KCNQ2 and EYFP-tagged CaM.
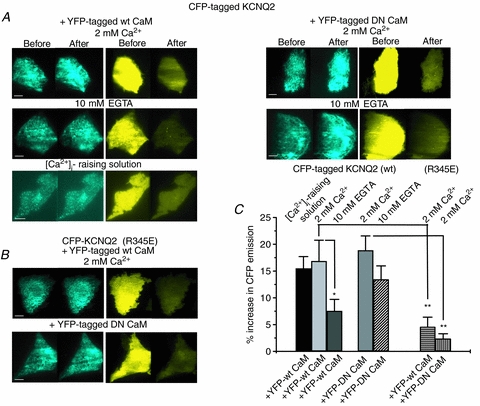
Images of ECFP (left panels) and EYFP (right panels) emission from cells expressing ECFP-tagged WT KCNQ2 (A) or KCNQ2 (R345E) (B) together with either WT CaM or DN CaM, before and after selective photobleaching of EYFP. For cells transfected with WT KCNQ2 and WT CaM, experiments were conducted with either 2 mm Ca2+, 10 mm EGTA, or the [Ca2+]-raising solution in the bath. For cells transfected with WT KCNQ2 and DN CaM, experiments were conducted with either 2 mm Ca2+ or 10 mm EGTA in the bath. Note the Ca2+ dependence of the FRET between WT KCNQ2 and WT, but not DN, CaM and the minimal FRET for KCNQ2 (R345E). Scale bars in A and B are 5 μm. C, bars showing summarized data for these experiments, under the indicated conditions. *P < 0.05, **P < 0.005.
Previous work has identified specific mutations within the CaM binding sites within KCNQ2 that abolish CaM interactions with the channels (Wen & Levitan, 2002; Shahidullah et al. 2005). We took advantage of this finding to validate the observed FRET between KCNQ2 and CaM by performing FRET between CaM and KCNQ2 (R345E), one such mutant reported to lack CaM binding. Figure 5B shows representative experiments on cells transfected with ECFP-tagged KCNQ2 (R345E) and EYFP-tagged CaM. In such cells studied under normal [Ca2+]i, the FRET was only 4.6 ± 1.6% (n = 12; P < 0.005) for WT CaM and 2.4 ± 0.9% (n = 9; P < 0.005) for DN CaM (Fig. 5C). This suggests that the FRET detected between WT KCNQ2 channels and CaM (WT or DN) is specific. For these experiments, the percentage EYFP photobleach was 77.6 ± 1.3% (n = 21).
We then analysed FRET between ECFP-tagged KCNQ3 and EYFP-tagged CaM (WT or DN), using the paradigm similar to above (Fig. 6A and B). More modest, but still significant, FRET was detected between ECFP-tagged KCNQ3 and EYFP-tagged WT CaM in normal [Ca2+]i (12.6 ± 2.6%, n = 11) that was not significantly higher in high [Ca2+]i (17.1 ± 5.2%, n = 9). Under low [Ca2+]i the FRET efficiency was 9.8%± 3.0 (n = 11), which is not significantly different from the values under high or low [Ca2+]i. The interaction was also analysed between ECFP-tagged KCNQ3 and EYFP-tagged DN CaM, which again revealed a modest, but significant, interaction. For normal or low [Ca2+]i, the values were 7.8 ± 1.8% (n = 11) and 12.1 ± 2.6% (n = 11), respectively (Fig. 6A and B). For the experiments on KCNQ3, the percentage EYFP photobleach was 81.3 ± 0.9% (n = 44). These data do not show a significant Ca2+-dependent difference in the interaction between KCNQ3 and either WT or DN CaM, suggesting that the interaction between KCNQ3 and CaM is Ca2+ independent inside the cell.
Figure 6. FRET between KCNQ3 and CaM (WT) or CaM (DN).
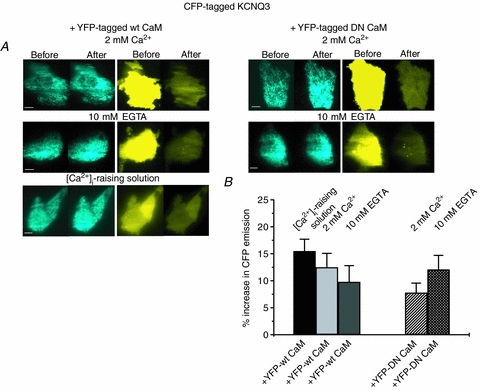
A, images of ECFP (left panels) and EYFP (right panels) emission from cells expressing ECFP-tagged KCNQ3 together with either WT CaM or DN CaM, before and after selective photobleaching of EYFP. For WT CaM, experiments were conducted with either 2 mm Ca2+, 10 mm EGTA or the [Ca2+]-raising solution in the bath. For DN CaM, experiments were performed with either 2 mm Ca2+ or 10 mm EGTA in the bath. Scale bars are 5 μm. B, bars showing summarized data from these experiments under the indicated conditions. The interaction between KCNQ3 and CaM (WT or DN) was significant, but did not show significant Ca2+ dependence.
Finally, we investigated the interaction between KCNQ4 and CaM. CHO cells were transfected with ECFP-tagged KCNQ4 and EYFP-tagged CaM (WT or DN), and experiments performed as above under high, normal or low [Ca2+]i. For the interaction with WT CaM, there was strong FRET that was not different among high, normal and low [Ca2+]i. Under high [Ca2+]i, the FRET was 15.5 ± 3.1% (n = 10), under normal [Ca2+]i, it was 17.6 ± 1.7% (n = 12), and under low [Ca2+]i, it was 20.1 ± 1.7% (n = 10) (Fig. 7A and B). The interaction between ECFP-tagged KCNQ4 and EYFP-tagged DN CaM was similarly robust and also not dependent on [Ca2+]i. Under normal [Ca2+]i, the FRET was 17.8 ± 3.0% (n = 13) and under low [Ca2+]i, it was 17.0 ± 1.7% (n = 10), respectively (Fig. 7A and B). For the experiments on KCNQ4, the percentage EYFP photobleach was 81.7 ± 0.5% (n = 45). These data suggest robust interaction between KCNQ4 and either WT or DN CaM that is not Ca2+ dependent.
Figure 7. FRET between KCNQ4 and CaM (WT) or CaM (DN).
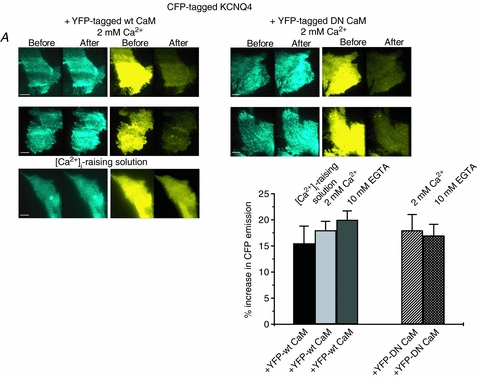
A, images of ECFP (left panels) and EYFP (right panels) emission from cells expressing ECFP-tagged KCNQ4 together with either WT CaM or DN CaM, before and after selective photobleaching of EYFP. For WT CaM, experiments were conducted with either 2 mm Ca2+, 10 mm EGTA or the [Ca2+]-raising solution in the bath. For DN CaM, experiments were performed with either 2 mm Ca2+ or 10 mm EGTA in the bath. Scale bars are 5 μm. B, bars showing summarized data from these experiments, under the indicated conditions. The interaction between KCNQ4 and CaM (WT or DN) was robust, but did not show significant Ca2+ dependence.
Discussion
We have previously demonstrated that CaM serves as the Ca2+ sensor of M-type K+ channels in both heterologous systems and sympathetic superior cervical ganglion (SCG) neurons (Gamper & Shapiro, 2003; Gamper et al. 2005a; Zaika et al. 2007). In addition, other labs have suggested a secondary, more structural role of CaM involved in channel trafficking or functional assembly (Wen & Levitan, 2002; Shahidullah et al. 2005; Etxeberria et al. 2008). Added to the biochemical and yeast 2-hybrid data indicating association between M-type channels and CaM is our work here showing the interaction in individual living cells. We here do not discuss the role of CaM in the physiology of KCNQ1-containing channels, for which recent work also suggests involves intriguing dual mechanisms (Ghosh et al. 2006; Roden, 2006; Shamgar et al. 2006). An advantage of the present work is that observations were made under TIRF microscopy, meaning that the FRET data report events in the membrane, where functional channels reside. Both these FRET data and the GST pull-downs indicate that apo WT CaM as well as DN CaM bind well to KCNQ2–4 channels, at least in heterologous or in vitro systems. As must be the case since it cannot bind Ca2+, in none of the assays did the binding of DN CaM depend on the presence of Ca2+. In the FRET experiments there was not increased channel–CaM association under the high [Ca2+]i conditions, relative to normal [Ca2+]i, suggesting that when both are heterologously expressed in CHO cells, most channels are tonically bound by CaM. How do these results compare with the wealth of physiological data?
In SCG cells, bradykinin B2 and purinergic P2Y6 receptor stimulation uses IP3-mediated signals to suppress M current, which is mostly blocked by heterologous expression of DN CaM (Cruzblanca et al. 1998; Gamper & Shapiro, 2003; Zaika et al. 2007). Since this blockade is assumed to be due to displacement of endogenous CaM from the channels by the expressed DN CaM, the latter must bind to the channels with an affinity high enough to take the place of the former when over-expressed. The present work is wholly consistent with that notion. However, we find that over-expression of WT CaM induces strong tonic inhibition of both M channels in SCG neurons and KCNQ2/3, KCNQ2, KCNQ4 and KCNQ5 channels in CHO cells at resting [Ca2+]i (Gamper & Shapiro, 2003; Gamper et al. 2005a; Zaika et al. 2007), suggesting that many M-type channels are not bound by endogenous CaM at low [Ca2+]i and that the affinity of apoCaM for the channels is not high. Taking the available data together, we conclude that the affinity of apoCaM for M channels is lower than calcified CaM, leaving many endogenous M channels without a Ca2+ sensor in native cells, but the affinity is sufficient to result in near-saturating binding of channels by CaM if over-expression of the latter drives such binding by mass action.
An intriguing result was the higher Ca2+ dependence of CaM binding to KCNQ2 than to KCNQ3 or KCNQ4 seen in our TIRF/FRET measurements. To further evaluate the specificity of this interaction, we tested the association between CaM and KCNQ2 (R345E), a mutant which is shown to have little interaction with CaM (Wen & Levitan, 2002; Shahidullah et al. 2005). This mutant exhibited little FRET with either WT or DN CaM. In our previous work, we found CaM to have little effect on current amplitudes of KCNQ3 homomers, but to potently regulate KCNQ4 (Gamper et al. 2005a), although the present work suggests a similar degree of association between CaM and the channels, and a similar lack of significant Ca2+ dependence to the binding, as assayed by the FRET signals. Thus, it is likely that Ca2+-induced structural rearrangements of the CaM–channel complex underlie modulation of channel activity, as seen for CaM-sensitive Ca2+ channels (Halling et al. 2006), and that the changes in proximity that can be monitored by FRET cannot report such rearrangement events. This concept of Ca2+-independent pretethering and Ca2+-dependent re-arrangement could underlie the dual roles for M-type channels suggested for CaM, with the former interaction perhaps involved in trafficking or assembly, and the latter mediating Ca2+-mediated modulation. As for SK-type K+ channels (Maylie et al. 2004), the N-lobe of CaM mediates Ca2+ sensing for KCNQ channels (Gamper et al. 2005a). If the C-lobe of CaM is responsible for pretethering to KCNQ channels, it will be interesting to demonstrate whether Ca2+ is involved, which is not the case for SK channels, for which the constitutive binding of CaM to the channels is mediated by the C-lobe via a mechanism that does not involve any C-lobe binding by Ca2+ ions (Keen et al. 1999).
The seeming complexity of Ca2+/CaM regulation of channels is probably an inevitable consequence of the need for specificity in signal transduction. The canonical motif of CaM signalling usually supposes a limitless supply of cytoplasmic apoCaM molecules that stand ready to interact with intermediary signalling proteins, such as CaM kinase, upon intracellular rises in [Ca2+]. The past decade has seen an important change in this paradigm, in which CaM itself is shown to directly interact with signalling targets, such as ion channels, either via constitutive association with the channels, followed by structural re-arrangements following Ca2+ binding, or via dynamic binding of the Ca2+–CaM complex to the channels (Saimi & Kung, 2002). Two new themes have emerged that give further insight to how CaM signalling achieves specificity. The first alters the concept of limitless CaM, and describes an intense intracellular competition in which the hierarchy of CaM targets as [Ca2+]i rises is governed by the order of calcified CaM–protein affinities (Tran et al. 2003; Black et al. 2004). Thus, the new picture describes much available apoCaM at low [Ca2+]i and most CaM molecules sequestered away by high-affinity target proteins at high [Ca2+]i, with little CaM available to act on the lowest-affinity CaM effectors. Consequently, over-expression experiments disrupt that order, since they produce a non-physiological over-abundance of CaM (either WT or DN) that makes it available to all partners. The second mechanism of CaM specificity arises by the use of scaffolding proteins that physically recruit CaM to its target, and thus raise its local concentration. For KCNQ channels, the A-kinase anchoring protein (AKAP) AKAP79/150 may serve that role, as it binds CaM (at least), KCNQ2, phosphatidylinositol 4,5-bisphosphate (PIP2) and the M1 muscarinic acetylcholine receptor (Hoshi et al. 2003; 2005). The AKAP79/150 protein is especially interesting in this system, since M1 receptor-mediated suppression of M current is widely thought to be through depletion of PIP2, whereas the action on M channels of the bradykinin receptor (which does not bind to AKAP79/150) involves Ca2+–CaM (Delmas & Brown, 2005). We look forward to more detailed analyses of the interlocking associations between KCNQ channels, CaM, receptors and scaffolding proteins that may illuminate the interplay of intracellular signals that allow neurons to define directed signalling pathways.
Acknowledgments
We thank Giselle Fernandez and S. Katherine Boyd for expert technical assistance. This work was supported by NIH grant R01 NS043394 and American Heart Assoc. grant-in-aid 0755071 to M.S.S.
References
- Axelrod D. Total internal reflection fluorescence microscopy in cell biology. Methods Enzymol. 2003;361:1–33. doi: 10.1016/s0076-6879(03)61003-7. [DOI] [PubMed] [Google Scholar]
- Black DJ, Tran QK, Persechini A. Monitoring the total available calmodulin concentration in intact cells over the physiological range in free Ca2+ Cell Calcium. 2004;35:415–425. doi: 10.1016/j.ceca.2003.10.005. [DOI] [PubMed] [Google Scholar]
- Bofill-Cardona E, Vartian N, Nanoff C, Freissmuth M, Boehm S. Two different signaling mechanisms involved in the excitation of rat sympathetic neurons by uridine nucleotides. Mol Pharmacol. 2000;57:1165–1172. [PubMed] [Google Scholar]
- Bradley J, Bonigk W, Yau KW, Frings S. Calmodulin permanently associates with rat olfactory CNG channels under native conditions. Nat Neurosci. 2004;7:705–710. doi: 10.1038/nn1266. [DOI] [PMC free article] [PubMed] [Google Scholar]
- Brown DA, Adams PR. Muscarinic suppression of a novel voltage-sensitive K+ current in a vertebrate neurone. Nature. 1980;283:673–676. doi: 10.1038/283673a0. [DOI] [PubMed] [Google Scholar]
- Brushia RJ, Walsh DA. Phosphorylase kinase: the complexity of its regulation is reflected in the complexity of its structure. Front Biosci. 1999;4:D618–D641. doi: 10.2741/brushia. [DOI] [PubMed] [Google Scholar]
- Centonze VE, Sun M, Masuda A, Gerritsen H, Herman B. Fluorescence resonance energy transfer imaging microscopy. Methods Enzymol. 2003;360:542–560. doi: 10.1016/s0076-6879(03)60127-8. [DOI] [PubMed] [Google Scholar]
- Constanti A, Brown DA. M-Currents in voltage-clamped mammalian sympathetic neurones. Neurosci Lett. 1981;24:289–294. doi: 10.1016/0304-3940(81)90173-7. [DOI] [PubMed] [Google Scholar]
- Cooper EC, Harrington E, Jan YN, Jan LY. M channel KCNQ2 subunits are localized to key sites for control of neuronal network oscillations and synchronization in mouse brain. J Neurosci. 2001;21:9529–9540. doi: 10.1523/JNEUROSCI.21-24-09529.2001. [DOI] [PMC free article] [PubMed] [Google Scholar]
- Cooper EC, Jan LY. M-channels: neurological diseases, neuromodulation, and drug development. Arch Neurol. 2003;60:496–500. doi: 10.1001/archneur.60.4.496. [DOI] [PubMed] [Google Scholar]
- Cruzblanca H, Koh DS, Hille B. Bradykinin inhibits M current via phospholipase C and Ca2+ release from IP3-sensitive Ca2+ stores in rat sympathetic neurons. Proc Natl Acad Sci U S A. 1998;95:7151–7156. doi: 10.1073/pnas.95.12.7151. [DOI] [PMC free article] [PubMed] [Google Scholar]
- Delmas P, Brown DA. Pathways modulating neural KCNQ/M (Kv7) potassium channels. Nat Rev Neurosci. 2005;6:850–862. doi: 10.1038/nrn1785. [DOI] [PubMed] [Google Scholar]
- Ellgaard L, Frickel EM. Calnexin, calreticulin, and ERp57: teammates in glycoprotein folding. Cell Biochem Biophys. 2003;39:223–247. doi: 10.1385/CBB:39:3:223. [DOI] [PubMed] [Google Scholar]
- Erickson MG, Moon DL, Yue DT. DsRed as a potential FRET partner with CFP and GFP. Biophys J. 2003;85:599–611. doi: 10.1016/S0006-3495(03)74504-4. [DOI] [PMC free article] [PubMed] [Google Scholar]
- Etxeberria A, Aivar P, Rodriguez-Alfaro JA, Alaimo A, Villace P, Gomez-Posada JC, Areso P, Villarroel A. Calmodulin regulates the trafficking of KCNQ2 potassium channels. FASEB J. 2008 doi: 10.1096/fj.07-9712com. in press. [DOI] [PubMed] [Google Scholar]
- Fanger CM, Ghanshani S, Logsdon NJ, Rauer H, Kalman K, Zhou J, Beckingham K, Chandy KG, Cahalan MD, Aiyar J. Calmodulin mediates calcium-dependent activation of the intermediate conductance KCa channel, IKCa1. J Biol Chem. 1999;274:5746–5754. doi: 10.1074/jbc.274.9.5746. [DOI] [PubMed] [Google Scholar]
- Ford CP, Stemkowski PL, Light PE, Smith PA. Experiments to test the role of phosphatidylinositol 4,5-Bbisphosphate in neurotransmitter-induced M-channel closure in bullfrog sympathetic neurons. J Neurosci. 2003;23:4931–4941. doi: 10.1523/JNEUROSCI.23-12-04931.2003. [DOI] [PMC free article] [PubMed] [Google Scholar]
- Fowler CE, Aryal P, Suen KF, Slesinger PA. Evidence for association of GABAB receptors with Kir3 channels and regulators of G protein signalling (RGS4) proteins. J Physiol. 2007;580:51–65. doi: 10.1113/jphysiol.2006.123216. [DOI] [PMC free article] [PubMed] [Google Scholar]
- Gamper N, Li Y, Shapiro MS. Structural requirements for differential sensitivity of KCNQ K+ channels to modulation by Ca2+/calmodulin. Mol Biol Cell. 2005a;16:3538–3551. doi: 10.1091/mbc.E04-09-0849. [DOI] [PMC free article] [PubMed] [Google Scholar]
- Gamper N, Shapiro MS. Calmodulin mediates Ca2+-dependent modulation of M-type K+ channels. J Gen Physiol. 2003;122:17–31. doi: 10.1085/jgp.200208783. [DOI] [PMC free article] [PubMed] [Google Scholar]
- Gamper N, Stockand JD, Shapiro MS. The use of Chinese hamster ovary (CHO) cells in the study of ion channels. J Pharmacol Toxicol Methods. 2005b;51:177–185. doi: 10.1016/j.vascn.2004.08.008. [DOI] [PubMed] [Google Scholar]
- Geiser JR, van Tuinen D, Brockerhoff SE, Neff MM, Davis TN. Can calmodulin function without binding calcium? Cell. 1991;65:949–959. doi: 10.1016/0092-8674(91)90547-c. [DOI] [PubMed] [Google Scholar]
- Ghosh S, Nunziato DA, Pitt GS. KCNQ1 assembly and function is blocked by long-QT syndrome mutations that disrupt interaction with calmodulin. Circ Res. 2006;98:1048–1054. doi: 10.1161/01.RES.0000218863.44140.f2. [DOI] [PubMed] [Google Scholar]
- Halling DB, Aracena-Parks P, Hamilton SL. Regulation of voltage-gated Ca2+ channels by calmodulin. Sci STKE 2006. 2006:er1. doi: 10.1126/stke.3182006er1. [DOI] [PubMed] [Google Scholar]
- Hoshi N, Langeberg LK, Scott JD. Distinct enzyme combinations in AKAP signalling complexes permit functional diversity. Nat Cell Biol. 2005;7:1066–1073. doi: 10.1038/ncb1315. [DOI] [PMC free article] [PubMed] [Google Scholar]
- Hoshi N, Zhang JS, Omaki M, Takeuchi T, Yokoyama S, Wanaverbecq N, Langeberg LK, Yoneda Y, Scott JD, Brown DA, Higashida H. AKAP150 signaling complex promotes suppression of the M-current by muscarinic agonists. Nat Neurosci. 2003;6:564–571. doi: 10.1038/nn1062. [DOI] [PMC free article] [PubMed] [Google Scholar]
- Jentsch TJ. Neuronal KCNQ potassium channels: physiology and role in disease. Nat Rev Neurosci. 2000;1:21–30. doi: 10.1038/35036198. [DOI] [PubMed] [Google Scholar]
- Joiner WJ, Khanna R, Schlichter LC, Kaczmarek LK. Calmodulin regulates assembly and trafficking of SK4/IK1 Ca2+-activated K+ channels. J Biol Chem. 2001;276:37980–37985. doi: 10.1074/jbc.M104965200. [DOI] [PubMed] [Google Scholar]
- Keen JE, Khawaled R, Farrens DL, Neelands T, Rivard A, Bond CT, Janowsky A, Fakler B, Adelman JP, Maylie J. Domains responsible for constitutive and Ca2+-dependent interactions between calmodulin and small conductance Ca2+-activated potassium channels. J Neurosci. 1999;19:8830–8838. doi: 10.1523/JNEUROSCI.19-20-08830.1999. [DOI] [PMC free article] [PubMed] [Google Scholar]
- Liang H, DeMaria CD, Erickson MG, Mori MX, Alseikhan BA, Yue DT. Unified mechanisms of Ca2+ regulation across the Ca2+ channel family. Neuron. 2003;39:951–960. doi: 10.1016/s0896-6273(03)00560-9. [DOI] [PubMed] [Google Scholar]
- Liou J, Kim ML, Heo WD, Jones JT, Myers JW, Ferrell JE, Jr, Meyer T. STIM is a Ca2+ sensor essential for Ca2+-store-depletion-triggered Ca2+ influx. Curr Biol. 2005;15:1235–1241. doi: 10.1016/j.cub.2005.05.055. [DOI] [PMC free article] [PubMed] [Google Scholar]
- Maylie J, Bond CT, Herson PS, Lee WS, Adelman JP. Small conductance Ca2+-activated K+ channels and calmodulin. J Physiol. 2004;554:255–261. doi: 10.1113/jphysiol.2003.049072. [DOI] [PMC free article] [PubMed] [Google Scholar]
- Robbins J. KCNQ potassium channels: physiology, pathophysiology, and pharmacology. Pharmacol Ther. 2001;90:1–19. doi: 10.1016/s0163-7258(01)00116-4. [DOI] [PubMed] [Google Scholar]
- Roden DM. A new role for calmodulin in ion channel biology. Circ Res. 2006;98:979–981. doi: 10.1161/01.RES.0000221822.22971.8c. [DOI] [PubMed] [Google Scholar]
- Saimi Y, Kung C. Calmodulin as an ion channel subunit. Annu Rev Physiol. 2002;64:289–311. doi: 10.1146/annurev.physiol.64.100301.111649. [DOI] [PubMed] [Google Scholar]
- Schonherr R, Lober K, Heinemann SH. Inhibition of human ether à go-go potassium channels by Ca2+/calmodulin. EMBO J. 2000;19:3263–3271. doi: 10.1093/emboj/19.13.3263. [DOI] [PMC free article] [PubMed] [Google Scholar]
- Sekar RB, Periasamy A. Fluorescence resonance energy transfer (FRET) microscopy imaging of live cell protein localizations. J Cell Biol. 2003;160:629–633. doi: 10.1083/jcb.200210140. [DOI] [PMC free article] [PubMed] [Google Scholar]
- Selyanko AA, Brown DA. Regulation of M-type potassium channels in mammalian sympathetic neurons: action of intracellular calcium on single channel currents. Neuropharmacology. 1996;35:933–947. doi: 10.1016/0028-3908(96)00135-9. [DOI] [PubMed] [Google Scholar]
- Shahidullah M, Santarelli LC, Wen H, Levitan IB. Expression of a calmodulin-binding KCNQ2 potassium channel fragment modulates neuronal M-current and membrane excitability. Proc Natl Acad Sci U S A. 2005;102:16454–16459. doi: 10.1073/pnas.0503966102. [DOI] [PMC free article] [PubMed] [Google Scholar]
- Shamgar L, Ma L, Schmitt N, Haitin Y, Peretz A, Wiener R, Hirsch J, Pongs O, Attali B. Calmodulin is essential for cardiac IKS channel gating and assembly. Impaired function in long-QT mutations. Circ Res. 2006;98:1055–1063. doi: 10.1161/01.RES.0000218979.40770.69. [DOI] [PubMed] [Google Scholar]
- Shapiro MS, Roche JP, Kaftan EJ, Cruzblanca H, Mackie K, Hille B. Reconstitution of muscarinic modulation of the KCNQ2/KCNQ3 K+ channels that underlie the neuronal M current. J Neurosci. 2000;20:1710–1721. doi: 10.1523/JNEUROSCI.20-05-01710.2000. [DOI] [PMC free article] [PubMed] [Google Scholar]
- Staruschenko A, Medina JL, Patel P, Shapiro MS, Booth RE, Stockand JD. Fluorescence resonance energy transfer analysis of subunit stoichiometry of the epithelial Na+ channel. J Biol Chem. 2004;279:27729–27734. doi: 10.1074/jbc.M404169200. [DOI] [PubMed] [Google Scholar]
- Steyer JA, Almers W. A real-time view of life within 100 nm of the plasma membrane. Nat Rev Mol Cell Biol. 2001;2:268–275. doi: 10.1038/35067069. [DOI] [PubMed] [Google Scholar]
- Suh B, Hille B. Recovery from muscarinic modulation of M current channels requires phosphatidylinositol 4,5-bisphosphate synthesis. Neuron. 2002;35:507–520. doi: 10.1016/s0896-6273(02)00790-0. [DOI] [PubMed] [Google Scholar]
- Suh BC, Horowitz LF, Hirdes W, Mackie K, Hille B. Regulation of KCNQ2/KCNQ3 current by G-protein cycling: The kinetics of receptor-mediated signaling by Gq. J Gen Physiol. 2004;123:663–683. doi: 10.1085/jgp.200409029. [DOI] [PMC free article] [PubMed] [Google Scholar]
- Suh BC, Inoue T, Meyer T, Hille B. Rapid chemically induced changes of PtdIns(4,5)P2 gate KCNQ ion channels. Science. 2006;314:1454–1457. doi: 10.1126/science.1131163. [DOI] [PMC free article] [PubMed] [Google Scholar]
- Tran QK, Black DJ, Persechini A. Intracellular coupling via limiting calmodulin. J Biol Chem. 2003;278:24247–24250. doi: 10.1074/jbc.C300165200. [DOI] [PubMed] [Google Scholar]
- Trudeau MC, Zagotta WN. Mechanism of calcium/calmodulin inhibition of rod cyclic nucleotide-gated channels. Proc Natl Acad Sci U S A. 2002;99:8424–8429. doi: 10.1073/pnas.122015999. [DOI] [PMC free article] [PubMed] [Google Scholar]
- Wang HS, Pan Z, Shi W, Brown BS, Wymore RS, Cohen IS, Dixon JE, McKinnon D. KCNQ2 and KCNQ3 potassium channel subunits: molecular correlates of the M-channel. Science. 1998;282:1890–1893. doi: 10.1126/science.282.5395.1890. [DOI] [PubMed] [Google Scholar]
- Wen H, Levitan IB. Calmodulin is an auxiliary subunit of KCNQ2/3 potassium channels. J Neurosci. 2002;22:7991–8001. doi: 10.1523/JNEUROSCI.22-18-07991.2002. [DOI] [PMC free article] [PubMed] [Google Scholar]
- Winks JS, Hughes S, Filippov AK, Tatulian L, Abogadie FC, Brown DA, Marsh SJ. Relationship between membrane phosphatidylinositol-4,5-bisphosphate and receptor-mediated inhibition of native neuronal M channels. J Neurosci. 2005;25:3400–3413. doi: 10.1523/JNEUROSCI.3231-04.2005. [DOI] [PMC free article] [PubMed] [Google Scholar]
- Wu MM, Buchanan J, Luik RM, Lewis RS. Ca2+ store depletion causes STIM1 to accumulate in ER regions closely associated with the plasma membrane. J Cell Biol. 2006;174:803–813. doi: 10.1083/jcb.200604014. [DOI] [PMC free article] [PubMed] [Google Scholar]
- Yus-Najera E, Santana-Castro I, Villarroel A. The identification and characterization of a non-continuous calmodulin binding site in non-inactivating voltage-dependent KCNQ potassium channels. J Biol Chem. 2002;277:28545–28553. doi: 10.1074/jbc.M204130200. [DOI] [PubMed] [Google Scholar]
- Zaika O, Tolstykh GP, Jaffe DB, Shapiro MS. Inositol triphosphate-mediated Ca2+ signals direct purinergic P2Y-receptor regulation of neuronal ion channels. J Neurosci. 2007;27:8914–8926. doi: 10.1523/JNEUROSCI.1739-07.2007. [DOI] [PMC free article] [PubMed] [Google Scholar]
- Zhang H, Craciun LC, Mirshahi T, Rohacs T, Lopes CM, Jin T, Logothetis DE. PIP2 activates KCNQ channels, and its hydrolysis underlies receptor-mediated inhibition of M currents. Neuron. 2003;37:963–975. doi: 10.1016/s0896-6273(03)00125-9. [DOI] [PubMed] [Google Scholar]
- Zhou Z, Neher E. Mobile and immobile calcium buffers in bovine adrenal chromaffin cells. J Physiol. 1993;469:245–273. doi: 10.1113/jphysiol.1993.sp019813. [DOI] [PMC free article] [PubMed] [Google Scholar]