Abstract
DNA-based two-dimensional and three-dimensional arrays have been used as templates for the synthesis of functional polymers and proteins. Hydrophobic or amphiphilic DNA arrays would be useful for the synthesis of hydrophobic molecules. The objective of this study was to design a modified amphiphilic double crossover DNA molecule that would insert into a water-chloroform interface, thus showing an amphiphilic character. Since experiments for such designs are tedious, we used molecular-dynamics simulations to identify and optimize the functional groups to modify the DNA backbone that would enable insertion into the water-chloroform interface before synthesis. By methylating the phosphates of the backbone to make phosphonates, in combination with placing a benzyl group at the 2′ position of the deoxyribose rings in the backbone, we observed that the simple B-DNA structure was able to insert into the water-chloroform interface. We find that the transfer free energy of methylated benzylated DNA is better than that of either just methylated or benzylated DNA. The driving force for this insertion comes from the entropic contribution to the free energy and the favorable van der Waals interaction of the chloroform molecules with the methyl and benzyl groups of the DNA.
INTRODUCTION
Much progress made in the synthesis of DNA-based nanostructures, such as double-crossover (DX) molecules (1), triple crossover (TX) molecules (2), and paranemic crossover (PX and JX) molecules (3,4), has paved the way for generating self-assemblies of two-dimensional and three-dimensional arrays of DNA (5–7). These two-dimensional and three-dimensional arrays serve as templates for the synthesis of organic molecules (8), polymers (e.g., polyaniline) (9), proteins, metal nanowires (10), and carbon nanotube field-effect transistors (11). DNA, being a highly programmable structure, has the distinct advantage of being useful as a template for the nanoscale synthesis of polymers. However, to achieve DNA-based template synthesis of hydrophobic functional organic molecules with desirable optical, electrical, and magnetic properties (12), the DNA template must be amphipathic. Such an amphipathic DNA template can also be used in nonaqueous or mixed solvents. For example, DNA nanostructures with hydrophobic regions on the outside could be inserted into membranes. A system such as the DNA 6-helix bundle (13) could function as a large pore and, with a hydrophobic or aromatic section on the inside, could bind to carbon nanotubes. In the same manner as helical peptides, DNA nanostructures with half-hydrophobic surfaces might be able to self-associate into larger well-defined units.
The first step toward making an amphiphilic DNA template is to neutralize the polyanionic character of the backbone of DNA. Therefore, to make the DNA amphiphilic, the DNA backbone needs to be modified by the addition of suitable chemical functionalities to the phosphate or sugar moieties. Neutral DNA analogs, such as backbone-modified peptide nucleic acids, have been created and optimized for binding to double-stranded DNA (14). However, to exploit the use of demonstrated template architectures based on DX, TX, and PX motifs, it is necessary to neutralize the DNA backbone.
The phosphate group in the DNA backbone can be neutralized by anionic methyl phosphonate linkage or methyl phosphotriester linkage. Methylation of the phosphate backbone leading to methyl phosphonates is synthetically viable, as shown by Ding (15). Egli et al. (16) have shown that modifications at the 2′-O-ribonucleic acid position in sugar result in many nucleotide analogs, among which 2′-O-(2-benzyloxy)ethyl ribonucleic acid extends a benzyl group for possible hydrophobic interaction.
The goal of this study was to redesign the backbone of the DX-DNA structure to have amphiphilic properties. Since this process is synthetically tedious, as a first step we used atomistic molecular-dynamics (MD) simulations to identify and optimize functional groups to be attached to the backbone of polynucleotides that would neutralize B-DNA and facilitate its insertion into a hydrophobic/neutral solvent, such as chloroform. We found that modifications such as methyl phosphonates along with benzylation of the 2′ position of the deoxyribose ring facilitated insertion of the DNA into chloroform, whereas neither methyl phosphonate nor benzyl deoxyribose exhibited favorable levels of insertion. Using the optimized functional groups resulting from our MD studies on the B-DNA, we also performed MD simulations on a modified DX structure with methyl phosphonates on all nucleotides, along with benzylation of the 2′ position of the deoxyribose ring of certain thymines, which showed ready insertion into a water-chloroform interface.
COMPUTATIONAL METHODS
Building the modified nucleotides
In the study presented here, we tested two chemical modifications to the backbone of the DNA that would facilitate insertion of the modified DNA into the water-chloroform interface. The two modifications made on the individual nucleotides were as follows:
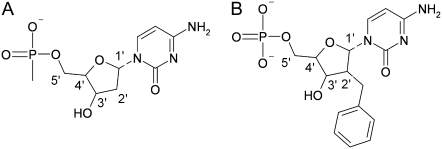
The charged phosphate groups on the DNA backbone were neutralized by replacing one of the oxygens by a methyl group, as shown in Fig. 1 A. Methylation of the phosphate backbone leading to methyl phosphonates is feasible experimentally, as shown by Ding (15).
The other modification was to place a benzyl group at the 2′ position of the deoxyribose ring in the backbone of B-DNA, as shown in Fig. 1 B.
FIGURE 1.
(A) Methylated phosphonate to neutralize the charged backbone of the DNA. (B) Benzylated deoxyribose to make the backbone amphiphilic.
DNA sequence
We built the simple B-DNA and the DX-DNA structures using the DNA builder program NAMOT (17). The sequence of the basepairs (bp) used for the B-DNA is TCTGTAGGACG. The following four modified B-DNA systems were generated and tested:
B-DNA with all the phosphates in the backbone methylated (me-DNA).
B-DNA with the 2′ position of all the deoxyribose rings benzylated (bz-DNA).
B-DNA with all the backbone sugars benzylated and phosphates methylated (me-bz-DNA).
B-DNA with no modification—natural DNA (n-DNA).
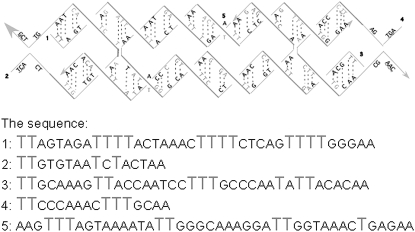
In systems 2 and 3, the molecules or their analogs are readily prepared 2′-O-benzyl derivatives. Fig. 2 shows the sequence used for the DX molecule. The DX-DNA was built by aligning two DNA double helices and then applying nick and link commands to build the crossover in NAMOT (17). Fig. 2 shows the sequence of DX-DNA used in the experiments.
FIGURE 2.
The sequence of DX-DNA designed from experiments and used for simulations. The sticky ends for the DX-DNA structure were excluded in the structures for simulations. Thymines shown in gray are 2′ benzylated and all phosphates are methylated.
Details of the MD simulations
Maiti et al. (18,19) have shown that MD simulations can be used to assess the relative stabilities of crossover molecules, such as the paranemic crossover molecule PX. Similarly, in this study we used MD simulations in explicit water-chloroform and NaCl, using the NAMD (20) program, to investigate the insertion of modified DNA molecules into the water-chloroform interface. All of the MD simulations were done using NAMD version 2.6, and VMD version 1.8.6 was used for preparation of the input files and trajectory analysis (21). NAMD simulations were performed using the Blue Gene computers at the San Diego Supercomputing Center and our group's Intel Xeon 3.6 computer cluster.
Topology and parameters
We used the Charmm27 force field (22) parameters for the n-DNA. The parameters for the benzylated deoxyribose moiety were generated by comparison with similar groups from the Charmm27 force field (22). The parameters for the methylated phosphonate moiety were not available in Charmm27, and hence the charges, force constants for bonds and angles, and nonbond parameters were obtained from Vishnyakov, A., and A. V. Neimark (23). Similarly, since no force-field parameters for chloroform were available in Charmm27, we adopted similar parameters (charges, force constants of bonds and angles, and nonbonded parameters) from frcmod.chcl3 and chcl3.in from AMBER8 (24). The TIP3P (25) model was used for water.
Building the starting structures, water-chloroform interface, and equilibration
As described above, the starting structures of the three modified DNAs, along with n-DNA and DX-DNA, were all built with NAMOT (17). We used the NPT ensemble, periodic boundaries, and particle-mesh Ewald (PME) full electrostatics calculations (26). Sodium and chloride counter-ions were added to neutralize the system using VMD (21). The water box was added using “solvate plugin” in VMD (21). As for the chloroform box, we first used Packmol (27) to build a 60Å × 60Å × 60Å chloroform box with 1612 chloroform molecules (according the density of chloroform, 1.48 g/cm3 [28]). We then equilibrated the chloroform box for 100 ps at 300 K using NAMD (20). Using this chloroform box as a template, we modified the VMD (21) plugin, solvate.tcl, to add the chloroform solvation box to the water solvation box, thus generating an interface of water and chloroform.
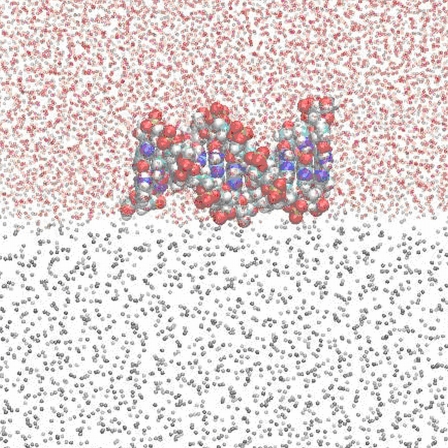
Fig. 3 shows the initial snapshot of n-DNA in the water phase of the water-chloroform interface. The DNA was placed parallel to the interface at ∼3 Å distance above the water-chloroform interface in the water phase. We also tried a different starting conformation in which the me-bz-DNA was perpendicular to the water-chloroform interface, as shown in Fig. S1 in Supplementary Material, Data S1. Fig. S1 B in Data S1 shows that after 10 ns of MD simulations, the me-bz-DNA becomes parallel to the interface. For the rest of the simulations, therefore, we chose the DNA conformation that is parallel to the water-chloroform interface as the starting conformation. Initially, conjugate gradient minimization was performed with fixed DNA, and the solvent was minimized at 0 K temperature for 1000 steps. Subsequently the whole system was heated to 300 K (increased 1 K temperature per five steps) with DNA fixed, within 100 ps. The equilibration step was run for the whole system for 10 ns for n-DNA, and 20 ns each for bz-DNA, me-DNA, me-bz-DNA, and DX-DNA. Snapshots from the MD runs were saved every 2.5 ps. For those modified DNA systems that showed insertion into the chloroform phase, the MD simulations were continued further, and thus for the me-bz-DNA we have 60 ns of MD simulations. The total numbers of atoms, including the two solvents and counter ions, were 37,966 for n-DNA, 38,085 for me-DNA, 44,263 for bz-DNA, 44,336 for me-bz-DNA, and 107,401 for DX-DNA.
FIGURE 3.
Initial snapshot of n-DNA placed in the water phase of the water-chloroform interface. The oxygen atom of water is in the red-point representation, DNA is in the van der Waals representation, and the carbon atom of chloroform is in the gray-point representation.
Calculation of properties
Calculation of the solute–solvent interaction energy
To investigate the insertion of the modified DNA into the water-chloroform interface, we calculated the interaction energy between DNA and water-chloroform, which is the sum of the van der Waals and electrostatic energies between the DNA and water molecules or chloroform molecules. For bz-DNA, the interaction energy also includes the interaction energy between DNA and counter ions. For each MD trajectory from our simulations, we used the NAMD energy plugin in VMD (21) to calculate the interaction energies between DNA and water, and between DNA and chloroform for each snapshot of the MD trajectory, using the PME method (26).
Calculation of the solute entropy and free energy
The total free energy of the modified DNA, including its entropy, is an important quantity for estimating the driving force for the insertion into the water-chloroform interface. We calculated the internal energy of the modified DNA solute (Einter), and the entropy (S) of the modified DNA to obtain the free energy (G). Hence, the free energies of modified DNA (G) (for the NPT system) are given by:
 |
(1) |
where T is the temperature. Einter was calculated using the NAMD energy plugin in VMD (21) for the modified DNA. Einter was calculated for every 125 ps of the MD trajectories. The time evolution of the solute entropies for me-DNA, bz-DNA, and me-bz-DNA along the MD trajectories was calculated from the covariance matrix using the Schlitter method (29) coded in CARMA (30), where the entropy is given by:
 |
(2) |
Here k is the Boltzman constant, T is the temperature, e is the charge of the electron, ℏ is Plank's constant divided by 2π, M is the mass matrix that contains masses on the diagonal, and σ is the covariance matrix generated from MD trajectories. The entropies were calculated for time series at an interval of 125 ps.
Radial distribution function
We calculated the radial distribution function (RDF) to understand the DNA–solvent interactions. The RDF calculated in this work is a correlation function that gives the ratio of the actual density of the solvent around a defined point in the solute to the mean density of the solvent molecules averaged over the whole volume. Here, we calculated the RDF from the solute, which is the modified DNA, to chloroform to verify whether there is any preferred ordering of chloroform around the modified DNA. The script RDF.tcl in VMD (21) was used to calculate the RDF from modified DNA to chloroform.
The RDFs were calculated as the average over pairwise RDFs calculated for selected atoms in the solute. For me-bz-DNA, we chose the methyl and benzyl groups from five modified nucleotides that are located toward the water-chloroform interface as points of reference in the solute to the whole chloroform molecule. For n-DNA, we chose O1P and O2P atoms, the oxygens attached to the phosphates from five nucleotides that are located toward the water-chloroform interface. We tested the convergence and fluctuations in the RDF by calculating the averages over the last 250 ps, 500 ps, and 1 ns of the respective trajectories. We observed that the RDF values converged and were similar for the averaging over 250 ps, 500 ps, and 1 ns, as shown in Fig. S2 in Data S1. Hence we adopted the averaging over the last 250 ps of the trajectory for all the other cases. The sampling error of the RDFs was calculated using the “blocking” method (31), which showed the standard deviations of our error estimates.
RESULTS AND DISCUSSION
In this section we discuss the results of the MD simulations for the three modified DNA systems and the DX-DNA molecules in the water-chloroform system. We present and discuss the 1), time variation of the distance of the modified DNA from the water-chloroform interface; 2), time variation of the solute–solvent interaction energies, the total internal energies of the modified DNA, and the entropies leading to the total free energies; and 3), RDF of the modified DNA with respect to chloroform.
Dipping of the me-bz-DNA into the water-chloroform interface
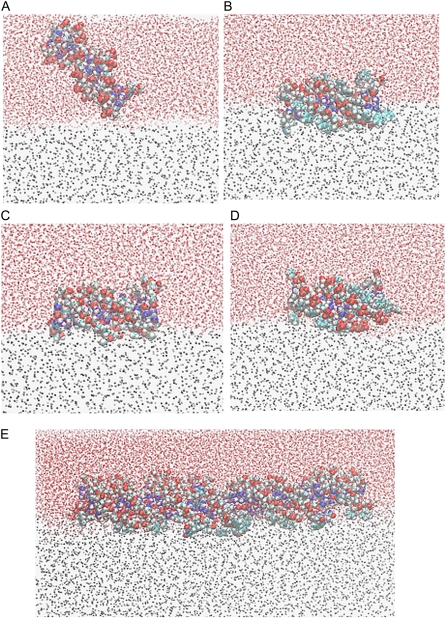
Fig. 4, A–E shows the final snapshots of the MD simulations of n-DNA, me-bz-DNA, me-DNA, bz-DNA, and DX-DNA, respectively. As expected, n-DNA that is polyanionic becomes perpendicular to the water-chloroform interface and exhibits more affinity for the water phase (Fig. 4 A). Fig. 4 B shows that me-bz-DNA penetrates the water-chloroform interface, and the bottom half of the DNA remains dipped into the chloroform phase, whereas the top part of the DNA is still dipped into the water phase. During the whole simulation time of 60 ns, the structure of me-bz-DNA remains intact, and the RMSD in coordinates of the backbone and basepairs of DNA is 1.6 Å from the initial conformation after simulation. Fig. 4, C and D show that both me-DNA and bz-DNA enter the water-chloroform interface but remain more in contact with the water phase than with the chloroform phase, and do not dip into chloroform. During the whole simulation time of 20 ns, the structure of me-DNA also stays intact with the RMSD in coordinates of the backbone and basepairs of DNA after simulation, being 2.3 Å from the initial conformation. The overall double helical structure of the bz-DNA stays intact, but with a larger deviation of 3.7Å RMSD from the initial conformation.
FIGURE 4.
(A) Last snapshot of n-DNA after 10 ns. (B) Last snapshot of me-bz-DNA after 60 ns. (C) Last snapshot of me-DNA after 20 ns. (D) Last snapshot of bz-DNA after 20 ns. (E) Last snapshot of DX-DNA after 20 ns. DNA is represented in the sphere model, the oxygen atom of water is in the CPK representation, and the carbon atom of chloroform is in the gray CPK representation.
Time variation of the distance of the modified DNA from chloroform
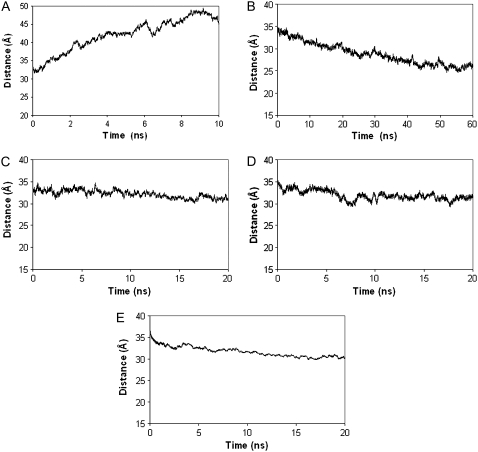
To quantify the extent of insertion of the modified DNA, we calculated the time evolution of the distance between the center of mass of DNA and the center of mass of chloroform. Fig. 5 A shows that this distance increases with time for n-DNA, and that the n-DNA is moving away from the chloroform phase of the water-chloroform interface. However, Fig. 5 B shows that the center-to-center distance between me-bz-DNA and chloroform decreases almost linearly during the first 40 ns of simulation, indicating stable insertion of the me-bz-DNA into the chloroform phase. The me-bz-DNA remains at this distance after 40 ns, and up to 60 ns, interacting with both the water and chloroform phases. The me-bz-DNA still has both a polar character from the oxygens on the phosphate and sugars, and a hydrophobic character from the methyl and benzyl groups. Therefore, there is a balance between the favorable electrostatics of the polar atoms with water and the favorable van der Waals interaction with the chloroform, as we will show later in this work. Fig. 5 C shows that the center-to-center distance for me-DNA fluctuates within 5Å of the starting distance from the chloroform phase, which is consistent with the snapshot in Fig. 4 C, and the fact that me-DNA stays near the hydrophobic interface and does not dip into chloroform. It is seen that the methylation of the phosphates to neutralize the charges facilitates the interaction with chloroform, but is not strong enough to insert into the chloroform phase. Fig. 5 D shows that the bz-DNA also fluctuates within 6 Å from the starting distance to the chloroform phase, but demonstrates greater variations in the distance than me-DNA. The larger fluctuations in the center-to-center distance could be due to the balance between the hydrophobic interaction of the benzyl group with chloroform, opposed by the electrostatic interaction between the negatively charged phosphates and water. However, both methyl phosphonates and benzylated sugars together lead to a favorable pull toward the chloroform phase.
FIGURE 5.
Distance between the center of mass between DNA and the center of chloroform versus time. (A) n-DNA. (B) me-bz-DNA. (C) me-DNA. (D) bz-DNA. (E) DX-DNA .
RDF
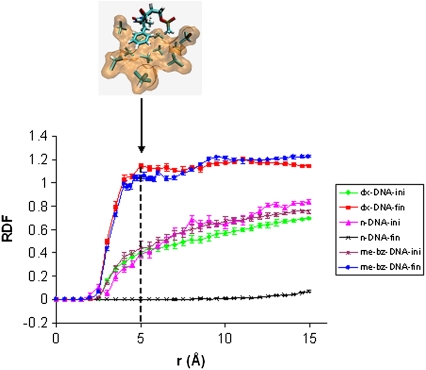
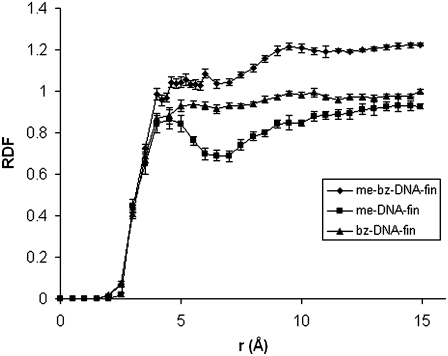
The RDFs for n-DNA, me-bz-DNA, and DX-DNA are shown in Fig. 6 along with the sampling error calculated for each of these RDF curves. The sampling error ranges from 0 to 0.05, which is very low. The curve for n-DNA shows no measurable density of chloroform molecules around itself, which is consistent with the fact that n-DNA becomes almost perpendicular to the water-chloroform interface during the simulation. For me-bz-DNA, the RDF shows an increase in the correlated density of the chloroform molecules around me-bz-DNA compared to the mean density of chloroform, averaged over the whole volume. There are two peaks—one at 5.0 Å and another at 10Å—for the me-bz-DNA when compared with the fluctuations in the sampling error. We believe that the peak at 5Å is significant and shows close solvent interactions of the DNA with chloroform, as shown in the inset in Fig. 6. The inset in Fig. 6 shows the first solvation shell around the modified backbone of the DNA due to the favorable van der Waals interaction of chloroform with both the methyl and benzyl groups of the me-bz-DNA. We also calculated the standard deviations in RDF, which range from 0.01 to 0.17 for me-bz-DNA, as shown in Fig. S3 in Data S1. Figs. 7 and S4 in Data S1 show the comparison of RDFs for me-DNA, bz-DNA, and me-bz-DNA. The RDF of me-bz-DNA is larger than those of me-DNA and bz-DNA, which indicates that there are more chloroform molecules surrounding the me-bz-DNA compared to me-DNA and bz-DNA. The me-DNA shows a definite peak at 4.8 Å, but the value of the RDF is less than 1.0, which shows no substantial density of correlated solvent molecules around me-DNA. The interaction between methyl/benzyl and chloroform is not strong enough for either me-DNA or bz-DNA to partition into the chloroform phase. Both me-DNA and bz-DNA stay close to the water-chloroform interface but do not dip into the chloroform phase.
FIGURE 6.
RDF calculated for n-DNA, me-bz-DNA, and DX-DNA from the initial and last 250 ps of the simulation; “ini” means the average over the initial 250 ps of simulation, whereas “fin” means the average over the final 250 ps of simulation. The peak at 5.0 Å is the first solvation shell of chloroform shown in orange surface; the methyl and benzyl groups are shown as a stick representation in element color. The method used for the sampling error bar is from Flyvberg and Pertersen (31).
FIGURE 7.
RDF of me-DNA, bz-DNA of 20 ns simulation, and me-bz-DNA of 60 ns simulation (averaged over the last 250 ps). The error bars are from sampling error (31).
Interaction energy of DNA with solvent
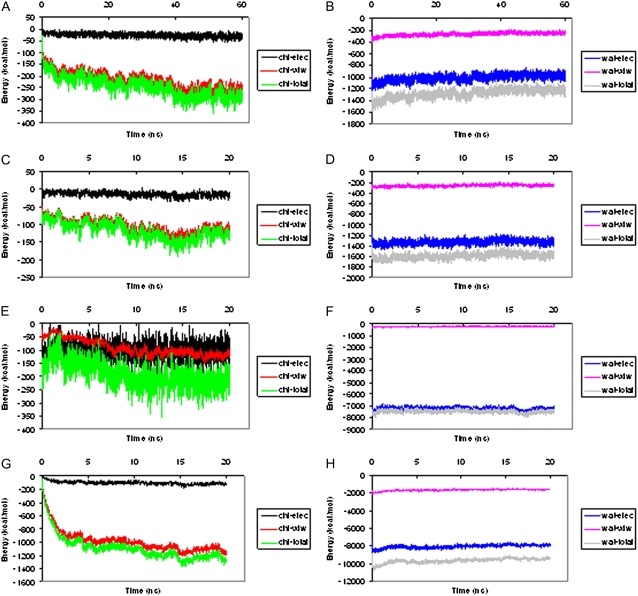
The calculated interaction energy between me-bz-DNA and chloroform is shown in Fig. 8 A. The favorable decrease in van der Waals interaction energy between me-bz-DNA and chloroform, and the unfavorable electrostatic energy between me-bz-DNA and water (Fig. 8 B) stabilize the me-bz-DNA in the water-chloroform interface toward the chloroform phase. Fig. 8, C and D show the interaction energy between chloroform/water and me-DNA, and Fig. 8, E and F show the interaction energy between chloroform/water and bz-DNA. There is no significant decrease in van der Waals energy between me-DNA or bz-DNA and chloroform, and therefore both me-DNA and bz-DNA stay near the chloroform/water interface without further dipping into the chloroform phase. For the polyanionic n-DNA, the strong electrostatic interactions with water keep it in the water phase.
FIGURE 8.
Interaction energy between each modified DNA and chloroform/water. (A) me-bz-DNA and chloroform. (B) me-bz-DNA and water. (C) me-DNA and chloroform. (D) me-DNA and water. (E) bz-DNA and chloroform. (F) bz-DNA and water. (G) DX-DNA and chloroform. (H) DX-DNA and water. In this figure, chl-elec represents electrostatic interaction energy between DNA and chloroform, chl-vdw represents van der Waals interaction energy between DNA and chloroform, chl-total represents electrostatic interaction energy plus van der Waals energy between DNA and chloroform, wat-elec represents electrostatic interaction energy between DNA and water, wat-vdw represents van der Waals interaction energy between DNA and water, and wat-total represents electrostatic interaction energy plus van der Waals energy between DNA and water.
Entropy and free energy of modified DNA
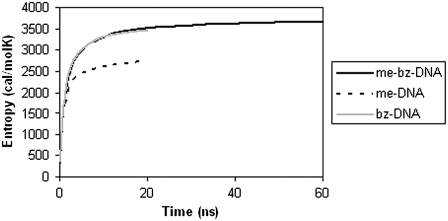
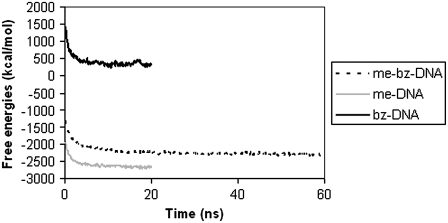
The calculated time evolutions of entropy for me-DNA, bz-DNA, and me-bz-DNA from the covariance matrix are shown in Fig. 9. The entropy of bz-DNA is similar in magnitude to that of me-bz-DNA, as can be seen from Fig. 9, but the entropy of me-DNA is lower than that of both bz-DNA and me-bz-DNA. Fig. 10 shows the total free energies calculated as the sum of internal energy of the DNA and the solute entropy for me-DNA, bz-DNA and me-bz-DNA. The free energy for me-DNA is favorable and more negative than that of me-bz-DNA, and the free energy of bz-DNA is unfavorable compared to that of me-bz-DNA. Although the entropy of me-DNA is not as favorable, the nonbond interaction energy of me-DNA is more favorable, making the free energy better than that of me-bz-DNA. For me-bz-DNA and me-DNA, the free energies are negative and decrease with time, which indicates that me-bz-DNA and me-DNA prefer to stay near the neutral interface. The free energy of bz-DNA is unfavorable despite the favorable entropy because of the strain in the internal energy of bz-DNA. The strain in the internal energy is also reflected in the change in structure of bz-DNA. The RMSD in coordinates of the bz-DNA conformation after MD is 3.7 Å from the starting conformation. We calculated the structural parameters of the double helix using Curves 5.1 (32,33). The average twist angle for the basepair in bz-DNA is 32°, compared with 35° for me-bz-DNA and me-DNA. This result along with the RMSD value of 3.7 Å from the starting conformation for bz-DNA shows that the structure may be distorted from the B-form.
FIGURE 9.
Entropies calculated for modified DNA versus time from MD simulations.
FIGURE 10.
Calculated solute free energies of modified DNA versus time from the MD simulations.
The free energy of transfer of the modified DNA from water to chloroform, as shown by the time progression of the free energy in Fig. 10, is most favorable (−877 ± 99 kcal/mol for me-bz-DNA compared to −595 ± 129 kcal/mol for me-DNA and −867 ± 204 kcal/mol for bz-DNA). Thus the favorable transfer free energy for me-bz-DNA comes initially from the favorable van der Waals interaction with the chloroform combined with favorable entropic contributions that increase when the me-bz-DNA inserts into the chloroform phase. However, the entropic contribution to the transfer free energy is not so favorable for me-DNA, which keeps it near the interface without further dipping into the chloroform phase. These results indicate that the van der Waals interaction between me-bz-DNA and chloroform is an important initial driving force for the insertion of DNA into the chloroform phase, and the entropic contributions favor further dipping of me-bz-DNA into chloroform.
Modified DX-DNA with chemical modifications at optimized positions dips into chloroform
Using the optimized chemical modification strategies from the n-DNA studies, we built a DX-DNA crossover molecule in the B-form with all methylated phosphonates and benzylation of the deoxyribose of only certain thymines (shown in green in Fig. 2), to correspond to an experimentally feasible molecule. The DX-DNA dips into the chloroform phase during the 20 ns of simulation and stays in the chloroform-water interface, as shown in Fig. 4 E. Fig. 5 E, shows a linear decrease in the center-to-center distance between DX-DNA and chloroform, which also verifies the dipping of the modified DX-DNA into the chloroform-water interface. The RDF shows a peak at 5.0 Å, demonstrating the favorable accumulation of chloroform around the methylated and benzylated groups (Fig. 6). The time evolution of the interaction energy (Fig. 8 G) also shows the decrease of the van der Waals interaction energy between DX-DNA and chloroform, and the increase of electrostatic energy between DX-DNA and water (Fig. 8 H).
CONCLUSIONS
In summary, methylation and benzylation of the backbone can make DNA amphiphilic, attenuating its hydrophilic character and enabling it to insert into chloroform while still interacting with water. Methylated and benzylated B-DNA and DX-DNA are capable of partitioning into the chloroform phase and thus can be transported to the hydrophobic phase. The driving force for this insertion comes from the favorable van der Waals interaction energy of the methyl and benzyl groups of me-bz-DNA and DX-DNA with the chloroform molecules, and the entropic contribution to the free energy when it dips into chloroform. Cui et al. (34) used atomic force microscopy combined with steered MD simulation studies to show that a double-stranded DNA when dragged from water to a hydrophobic solvent unwinds the double-helix structure. The results of the simulations presented here show that modified me-bz-DNA dips into the chloroform phase. However, it is important to note that an understanding of the structural transitions of me-bz-DX-DNA when it is pulled into a hydrophobic environment from water will require MD simulations on a longer time scale than the 60 ns afforded by this study.
The strategies tested in this study include the neutralization of phosphates and the addition of hydrophobic groups to the DNA backbone. Alternatively, the size and character (for example, aromatic or aliphatic) of the substitution of the hydrophobic groups could also be varied to optimize the hydrophobicity of the DNA nanostructures.
SUPPLEMENTARY MATERIAL
To view all of the supplemental files associated with this article, visit www.biophysj.org.
Acknowledgments
We thank Prof. William A. Goddard III for letting us use the computer cluster at the Materials and Process Simulation Center, Caltech. We also thank Prof. David N. Beratan (Duke University) for allowing us to use scripts to analyze the sampling error of the MD trajectories. We also thank Dr. S.R. Narayan (Jet Propulsion Laboratory) for valuable discussions, and Mr. Tod Pascal for helping us to build the DX structures. Dr. David Hart and the staff of the San Diego Supercomputer facility were helpful in allocating computational time on the San Diego supercomputers, and understanding of the needs of new faculty members.
This work was funded by the Beckman Research Institute of the City of Hope.
Editor: José Onuchic.
References
- 1.Fu, T.-J., and N. C. Seeman. 1993. DNA double-crossover molecules. Biochemistry. 32:3211–3220. [DOI] [PubMed] [Google Scholar]
- 2.LaBean, T. H., H. Yan, J. Kopatsch, F. R. Liu, E. Winfree, J. H. Reif, and N. C. Seeman. 2000. Construction, analysis, ligation, and self-assemble of DNA triple crossover complexes. J. Am. Chem. Soc. 122:1848–1860. [Google Scholar]
- 3.Zhang, X. P., H. Yan, Z. Y. Shen, and N. C. Seeman. 2002. Paranemic cohesion of topologically-closed DNA molecules. J. Am. Chem. Soc. 124:12940–12941. [DOI] [PubMed] [Google Scholar]
- 4.Shen, Z., H. Yan, T. Wang, and N. C. Seeman. 2004. Paranemic crossover DNA: a generalized Holiday structure with application in nanotechnology. J. Am. Chem. Soc. 126:1666–1674. [DOI] [PMC free article] [PubMed] [Google Scholar]
- 5.Seeman, N. C. 2003. DNA in a material world. Nature. 421:427–431. [DOI] [PubMed] [Google Scholar]
- 6.Seeman, N. C. 2003. At the crossroads of chemistry, biology, and materials: structural DNA nanotechnology. Chem. Biol. 10:1151–1159. [DOI] [PubMed] [Google Scholar]
- 7.Seeman, N. C., and P. S. Lukeman. 2005. Nucleic acid nanostructures: bottom-up control of geometry on the nanoscale. Rep. Prog. Phys. 68:237–270. [DOI] [PMC free article] [PubMed] [Google Scholar]
- 8.Gartner, Z. J., B. N. Tse, R. Grubina, J. B. Doyon, T. M. Snyder, and D. R. Liu. 2004. DNA-templated organic synthesis and selection of a library of macrocycles. Science. 305:1601–1605. [DOI] [PMC free article] [PubMed] [Google Scholar]
- 9.Nickels, P., W. U. Dittmer, S. Beyer, J. P. Kotthaus, and F. C. Simmel. 2004. Polyaniline nanowire synthesis templated by DNA. Nanotechnology. 15:1524–1529. [Google Scholar]
- 10.Lund, K., B. Williams, Y. Ke, Y. Liu, and H. Yan. 2006. DNA nanotechnology: a rapidly evolving field. Current Nanoscience 2:113–122. [Google Scholar]
- 11.Keren, K., R. S. Berman, E. Buchstab, U. Sivan, and E. Braun. 2003. DNA-templated carbon nanotube field-effect transistor. Science. 302:1380–1382. [DOI] [PubMed] [Google Scholar]
- 12.Miller, J. S. 1990. Molecular materials mimic inorganic network solids. Adv. Mater. 2:98–99. [Google Scholar]
- 13.Mathieu, F., S. Liao, C. Mao, J. Kopatsch, T. Wang, and N. C. Seeman. 2005. Six-helix bundles designed from DNA. Nano Lett. 5:661–665. [DOI] [PMC free article] [PubMed] [Google Scholar]
- 14.Nielsen, P. E., and M. Egholm. 1999. An introduction to peptide nucleic acid. Curr. Issues Mol. Biol. 1:89–104. [PubMed] [Google Scholar]
- 15.Ding, L. 2006. Structural DNA nanotechnology with novel components: nylon-DNA and hydrophobic DNA. PhD thesis. New York University, New York.
- 16.Egli, M., G. Minasov, V. Tereshko, P. S. Pallan, M. Teplova, G. B. Inamati, E. A. Lesnik, S. R. Owens, B. S. Ross, T. P. Prakash, and M. Manoharan. 2005. Probing the influence of stereoelectronic effects on the biophysical properties of oligonucleotides: comprehensive analysis of RNA affinity, nuclease resistance, and crystal structure of ten 2'-O-ribonucleic acid modifications. Biochemistry. 44:9045–9057. [DOI] [PubMed] [Google Scholar]
- 17.Tung, C.-S., and E. S. Carter II. 1994. Nucleic acid modeling tool (NAMOT): an interactive graphic tool for modeling nucleic acid structures. Comput. Appl. Biosci. 10:427–433. [DOI] [PubMed] [Google Scholar]
- 18.Maiti, P. K., T. A. Pascal, N. Vaidehi, and W. A. Goddard III. 2004. The stability of Seeman JX DNA toposiomers of paranemic crossover (PX) molecules as a function of crossover number. Nucleic Acids Res. 32:6047–6056. [DOI] [PMC free article] [PubMed] [Google Scholar]
- 19.Maiti, P. K., T. A. Pascal, N. Vaidehi, J. Heo, and W. A. Goddard III. 2006. Atomic level simulations of Seeman DNA nanostructures: the paranemic crossover in salt solution. Biophys. J. 90:1463–1479. [DOI] [PMC free article] [PubMed] [Google Scholar]
- 20.Phillips, J. C., R. Braun, W. Wang, J. Gumbat, E. Tajkhorshid, E. Villa, C. Chipot, R. D. Skeel, L. Kale, and K. Schulten. 2005. Scalable molecular dynamics with NAMD. J. Comput. Chem. 26:1781–1802. [DOI] [PMC free article] [PubMed] [Google Scholar]
- 21.Humphrey, W., A. Dalke, and K. Schulten. 1996. VMD: visual molecular dynamics. J. Mol. Graph. 14:33–38. [DOI] [PubMed] [Google Scholar]
- 22.MacKerell, A. D., Jr., D. Bashford, M. Bellott, R. L. Dunbrack, Jr., J. D. Evanseck, M. J. Field, S. Fischer, J. Gao, H. Guo, S. Ha, D. Joseph-McCarthy, L. Kuchnir, K. Kuczera, F. T. K. Lau, C. Mattos, S. Michnick, T. Ngo, D. T. Nguyen, B. Prodhom, W. E. Reiher III, B. Roux, M. Schlenkrich, J. C. Smith, R. Stote, J. Straub, M. Watanabe, J. Wiórkiewicz-Kuczera, D. Yin, and M. Karplus. 1998. All-atom empirical potential for molecular modeling and dynamics studies of proteins. J. Phys. Chem. B. 102:3586–3616. [DOI] [PubMed] [Google Scholar]
- 23.Vishnyakov, A., and A. V. Neimark. 2004. Molecular model of dimethylmethylphosphonate and its interactions with water. J. Phys. Chem. A. 108:1435–1439. [Google Scholar]
- 24.Case, D. A., T. A. Darden, T. E. Cheatham III, C. L. Simmerling, J. Wang, R. E. Duke, R. Luo, K. M. Merz, B. Wang, D. A. Pearlman, M. Crowley, S. Brozell, V. Tsui, H. Gohlke, J. Mongan, V. Hornak, G. Cui, P. Beroza, C. Schafmeister, J. W. Caldwell, W. S. Ross, and P. A. Kollman. 2004. AMBER 8, University of California, San Francisco.
- 25.Jorgensen, W. L., J. Chandrasekhar, J. D. Madura, R. W. Impey, and M. L. Klein. 1983. Comparison of simple potential functions for simulating liquid water. J. Chem. Phys. 79:926–935. [Google Scholar]
- 26.Darden, T., D. York, and L. Pedersen. 1993. Particle mesh Ewald: an N-log(N) method for Ewald sums in large systems. J. Chem. Phys. 98:10089–10092. [Google Scholar]
- 27.Martínez, J. M., and L. Martínez. 2003. Packing optimization for automated generation of complex system's initial configurations for molecular dynamics and docking. J. Comput. Chem. 24:819–825. [DOI] [PubMed] [Google Scholar]
- 28.O'Neil, M. J., A. Smith, P. E. Heckelman, J. R. Obenchain, Jr., J. A. R. Gallipeau, M. A. D'Arecca, and S. Budavari, eds. 2001. Chloroform. Merck index. 13th ed. Merck, Whitehouse Station, NJ. 369.
- 29.Schlitter, J. 1993. Estimation of absolute and relative entropies of macromolecules using the covariance matrix. Chem. Phys. Lett. 215:617–621. [Google Scholar]
- 30.Glykos, N. M. 2006. CARMA: a molecular dynamics analysis program. J. Comput. Chem. 27:1765–1768. [DOI] [PubMed] [Google Scholar]
- 31.Flyvberg, H., and H. G. Pertersen. 1989. Error estimates on averages of correlated data. J. Chem. Phys. 91:461–466. [Google Scholar]
- 32.Lavery, R., and H. Sklenar. 1989. Defining the structure of irregular nucleic acids: conventions and priciples. J. Biomol. Struct. Dyn. 6:655–667. [DOI] [PubMed] [Google Scholar]
- 33.Lavery, R., and H. Sklenar. 1989. The defining of generalized helicodal parameters and of axis curvature for irregular nucleic acids. J. Biomol. Struct. Dyn. 6:63–91. [DOI] [PubMed] [Google Scholar]
- 34.Cui, S., J. Yu, F. Kuhner, K. Schulten, and H. E. Gaub. 2007. Double-stranded DNA dissociates into single strands when dragged into a poor solvent. J. Am. Chem. Soc. 129:14710–14716. [DOI] [PubMed] [Google Scholar]


