Abstract
Cytochrome c oxidase (CcO) from Paracoccus denitrificans was immobilized in a strict orientation via a his-tag attached to subunit I on a gold film and reconstituted in situ into a protein-tethered bilayer lipid membrane. In this orientation, the cytochrome c (cyt c) binding site is directed away from the electrode pointing to the outer side of the protein-tethered bilayer lipid membrane architecture. The CcO can thus be activated by cyt c under aerobic conditions. Catalytic activity was monitored by impedance spectroscopy, as well as cyclic voltammetry. Cathodic and anodic currents of the CcO with cyt c added to the bulk solution were shown to increase under aerobic compared to anaerobic conditions. Catalytic activity was considered in terms of repeated electrochemical oxidation/reduction of the CcO/cyt c complex in the presence of oxygen. The communication of cyt c bound to the CcO with the electrode is discussed in terms of a hopping mechanism through the redox sites of the enzyme. Simulations supporting this hypothesis are included.
INTRODUCTION
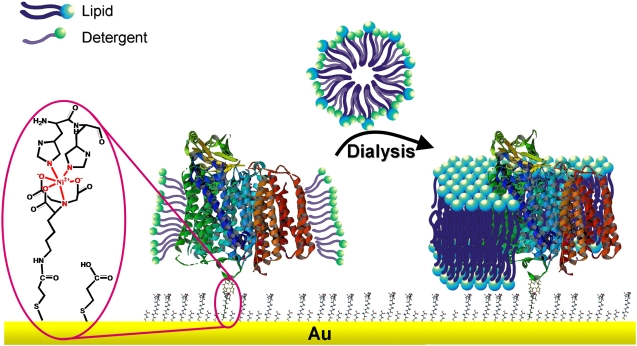
Much effort has been directed toward the design of model systems of the bilayer lipid membrane, such as tethered (tBLMs) (1,2) and pore-spanning bilayer lipid membranes (nano-BLMs) (3), to investigate membrane proteins in a functionally active state. The motivation for these studies was to obtain a deeper understanding of ion transport mechanisms across lipid membranes by membrane proteins. Channel peptides, such as mellitin and gramicidin, and ion carriers, such as valinomycin, were successfully incorporated (4–8). They were shown to transport ions with similar ion transfer rates as in classical bilayer or black lipid membranes (BLMs) (6). Larger and more complex enzymes such as cytochrome c oxidase (CcO) were incorporated as well. However, catalytic currents were measured by cyclic voltammetry (CV) only at low scan rates (9–13). Similar results were obtained for CcO immobilized in a complex with cytochrome c (cyt c) (14). In an attempt to preserve, in the best possible way, the catalytic activity of such proteins immobilized on surfaces, we developed a biomimetic membrane system in which the proteins are immobilized on a planar electrode using the histidine (his)-tag technology. A lipid bilayer is then reconstituted by in situ dialysis around the bound proteins to form the protein-tethered bilayer lipid membrane (ptBLM) (15) (Fig. 1). The most obvious advantage of this system is the strict control over the orientation of the protein.
FIGURE 1.
Schematic representation of CcO embedded into a ptBLM. The protein is attached to the TSG film on the NTA-Ni+ complex-modified surface by a his-tag attached to SU I. The lipid bilayer is assembled around the protein by in situ dialysis of micelles made from detergent-solubilized lipid.
Recently, it was shown that the CcO from Rhodobacter sphaeroides, embedded in such a system with the his-tag attached to subunit (SU) II, can be effectively activated by direct electron transfer (ET). This was demonstrated by electrochemical methods in combination with surface-enhanced resonance Raman spectroscopy (SERRS) (16,17). On the other hand, when the CcO from Paracoccus denitrificans is immobilized with the his-tag attached to SU I, the cyt c binding site is directed away from the electrode to the outer side of the tBLM architecture (Fig. 1). The protein can then be activated by cyt c to actively transport protons across the lipid bilayer structure (15). These processes will be investigated in greater detail in this work.
MATERIALS AND METHODS
Di-thio-bis(N-succinimidyl propionate) (DTSP), di-thio-bis(propionic acid) (DTP), N-(5-amino-1-carboxypentyl) iminodiacetic acid (ANTA), dodecyl-β-D-maltoside (DDM), cyt c from bovine heart, glucose oxidase, and catalase were purchased from Sigma (St. Louis, MO). Biobead adsorbents from Bio-Rad Laboratories (Munich, Germany) were washed with ethanol and deionized water from a MilliQ water purification system (18.2 MΩ cm; Millipore, Bedford, MA). 1,2-Diphytanoyl-sn-glycero-3-phosphocholine (DPhyPC) was provided by Avanti Polar Lipids (Alabaster, AL). All other chemicals were of analytical grade.
The stock solution of reduced cyt c was prepared by adding 10 mg of sodium dithionite to an aqueous solution of 40 mg cyt c in 1 ml water, after which the reductive was removed by gel filtration utilizing a Sephadex column (G-25 M, GE Healthcare Bio-Science AB, Uppsala, Sweden).
CcO from P. denitrificans with a his-tag at the C-terminus of SU I was prepared according to Lucioli et al. (18).
Sample preparation
Template stripped gold (TSG) electrodes (19) were used for surface plasmon resonance (SPR) and electrochemistry measurements. Slides were immersed for 120 min in a solution of DTSP and DTP with a 60:40 molar ratio in dry dimethylsulfoxide (2 mg/ml). After rinsing, the slides were functionalized for 48 h in a 0.15 M solution of ANTA buffered to pH 9.8 by adding 0.5 M K2CO3. Finally, the glass slides were immersed for 30 min in 40 mM NiSO4 in acetate buffer 50 mM, pH 5.5. The excess Ni was removed by thorough rinsing with the same acetate buffer without Ni. Immobilization of the protein to the Ni-chelated NTA surface was performed in a solution of 100 nM CcO in detergent containing phosphate buffer (K2HPO4 0.1 M, KCl 0.05 M, pH = 8, 0.1% DDM) (15). Biobeads were added to the lipid detergent containing phosphate buffer (DiPhyPC 0.05 mg/ml, K2HPO4 0.1 M, KCl 0.05 M, pH = 8, 0.1% DDM) to remove the detergent and to form a lipid bilayer.
Electrochemical measurements
Electrochemical measurements were performed using an Autolab instrument (PGSTAT302; Eco Chemie, Utrecht, The Netherlands) equipped with a FRA2-module for impedance measurements, an ECD-module amplifier for low currents, an ADC750 module for rapid scan measurements, and a SCAN-GEN module for analog potential scanning as well as the frequency response analyzer software provided by Eco Chemie. CV experiments were conducted with current times resistance (IR) drop compensation, particularly at high scan rates. Measurements under anaerobic conditions were done in a buffer solution containing K2HPO4 0.1 M, KCl 0.05 M, pH = 8 and the oxygen trap glucose (0.3% w/w), glucose oxidase (75 μg/ml), and catalase (12.5 μg/ml) (20). This solution was flushed with Ar for 1 or 2 h before the measurements to assure a completely deoxygenated solution. The Ar was purged from oxygen using a washing flask containing the oxygen trap buffer solution. Impedance spectra were recorded in a frequency ranging from 50 kHz to 3 mHz with an excitation amplitude of 10 mV. Data were subsequently analyzed by the complex nonlinear fitting algorithm supplied in the data processing software ZVIEW (Version 2.6, Scribner Associates, Southern Pines, NC). All electrochemical measurements were taken in a three-electrode configuration with the TSG as the working electrode, an Ag/AgCl,KClsat reference, and a platinum wire as the counterelectrode. All electrode potentials are quoted versus normal hydrogen electrode (NHE) taken at pH = 8, with no difference found for pH = 7.
Surface plasmon resonance spectroscopy
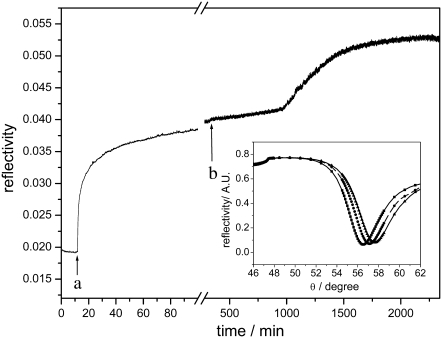
SPR spectroscopy was performed in a setup using the Kretschmann configuration with a measuring cell designed for use of SPR in combination with electrochemistry. The glass slide (LaSFN9 from Hellma Optik, Jena, Germany, refractive index n = 1.85 at λ = 633 nm) was optically matched to the base of a 90° glass prism (LaSFN9). Monochromatic light from a He-Ne laser (Uniphase, San Jose, CA; λ = 632.8 nm) was directed through the prism and collected by a custom-made photodiode detector. Recording the change of reflectivity at a fixed angle in the linear regime of the SPR curve (Fig. 2) allows us to follow the time course of the protein binding and reconstitution.
FIGURE 2.
SPR kinetic trace at a constant angle of incidence (55°). The binding of CcO is recorded after the addition of the detergent-solubilized protein at (a), and the in situ dialysis is started at (b) by adding detergent-solubilized lipid and biobeads. Angle scans of the different layers are shown in the inset.
Surface-enhanced resonance Raman spectroscopy
SERRS was performed in a custom-made spectroelectrochemical cell connected to an Autolab instrument using an upside-down rotating disk electrode, which is made of a roughened silver rod (diameter 10 mm) inserted into a Teflon mantle (17). An inner Teflon trough was fixed to the rotating disk electrode rotating in-line with the electrode. The cell was sealed by a lid provided with inlets for the counter and reference (Ag/AgCl,KClsat) electrodes, as well as for the microscope objective. Surface-enhanced resonance Raman (SERR) spectra were collected using a confocal Raman microscope (LabRam, HR800; HORIBA Jobin Yvon, Longjumeau, France) equipped with a liquid nitrogen cooled back-illuminated charge-coupled device camera. The laser beam from a Kr+ laser (excitation wavelength λ = 413 nm) was focused on the surface of the above mentioned Ag-disk electrode using a water immersion objective. To prevent photoreduction of the enzyme, the electrode was rotated at 15 Hz or 900 rpm and the laser intensity at the sample surface was kept smaller than 0.1 mW.
RESULTS AND DISCUSSION
Formation of the protein-tethered bilayer lipid membrane
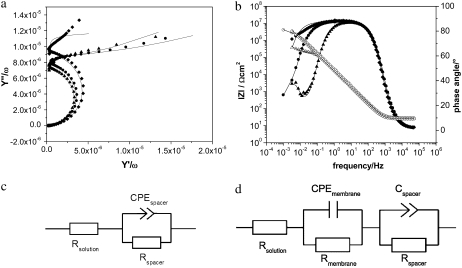
The formation of the ptBLM was performed in two steps, as described earlier (15). In the first step, the CcO from P. denitrificans with a his-tag on SU I was bound to the NTA/Ni-modified gold surface. In the second step, detergent-solubilized lipid molecules were added to the bulk solution, and in situ dialysis with biobeads was carried out to assemble the lipid membrane around the CcO molecules (Fig. 1). The two-step procedure was followed by a combination of SPR and electrochemical impedance spectroscopy. SPR allows us to determine the optical thickness as a function of time (Fig. 2). From this recording, the time course of CcO binding was shown to be complete after 40 min, whereas in situ dialysis taking more than 20 h was usually done overnight. Approximate layer thicknesses (Table 1) were obtained by fitting the parameters of the angle scans shown in the inset of Fig. 2. Protein binding results in an increase in layer thickness of 8.7 nm, which corresponds to the height of the protein (9 nm) obtained from x-ray crystallography data. This indicates a relatively high surface coverage with the CcO. Impedance spectra were evaluated by fitting the parameter values of equivalent circuits to the measured impedance data before and after CcO binding and formation of the ptBLM (Fig. 3, a and b, respectively).
TABLE 1.
Electrical parameter values obtained by fitting to the measured data of impedance spectra and thicknesses obtained by fitting to the SPR angle scan plots
| Rm/Ω cm2 | Cm/μF cm−2 | Layer thickness/nm (SPR) | |
|---|---|---|---|
| Ni-NTA layer | 2.4 | ||
| CcO layer before ptBLM formation | 500 ± 80 × 103 | 12.1 ± 2.8 | 11.1 |
| CcO layer after ptBLM formation | 13 ± 6 × 10⁶ | 7.1 ± 0.5 | 12.0 |
| ptBLM after cyt c addition | 550 ± 90 × 103 | 7.1 ± 0.5 | n.d. |
FIGURE 3.
Impedance spectra, frequency normalized admittance (a), and Bode plots (b) of the Ni-NTA modified surface before (♦) and after binding of CcO before (•) and after in situ dialysis to form the lipid bilayer around the protein (▴). Dotted lines represent experimental data. Solid lines show the fitted curves using the equivalent circuits (d) except for the Ni-NTA modified surface where circuit (c) was used.
The equivalent circuit of the Ni-NTA layer (Fig. 3 c) was a resistance capacitance (RC) circuit with the resistance Rsp and constant phase element CPEsp of the spacer region in series with the resistance of the bulk solution Rex. The equivalent circuit of the protein layer as well as the mixed protein-lipid membrane layer (Fig. 3 d) were assumed to consist of one RC element represented by Rm and Cm (where m stands for membrane) for the protein/detergent layer or the protein/lipid layer and a second RC element for the spacer layer (Rsp and CPEsp) in series with Rex. Constant phase elements instead of pure capacitors are used because of the heterogeneity of the spacer layer. The parameter values obtained from the fitting procedure are shown in Table 1. The capacitance of the membrane decreases from 12.1 ± 2.8 μF cm−2 for the CcO/detergent/water layer to 7.1 ± 0.5 μF cm−2 for the ptBLM (Fig. 3 b), whereas the resistance increases from 500 ± 80 kΩ cm2 to 13 ± 6 MΩ cm2 (Fig. 3 b). The high resistance is in agreement with the sealing resistance of a BLM, whereas the capacitance is an order of magnitude higher than that of a BLM. The capacitance of a dielectric layer is determined by the thickness and dielectric constant of the material.
The dielectric constant of the lipid is much smaller (ɛ = 2.2) than that of water (ɛ = 80) and protein molecules (typically ɛ = 30) (21). Therefore, a decrease of the capacitance is expected if the detergent and water molecules between the CcO molecules are replaced by lipid bilayer patches. The capacitance (C) of a pure protein monolayer is estimated to be ∼6 μFcm−2 using  with A as the area (1 cm2), d the thickness (5 nm), ɛ the dielectric constant of the dielectric layer, and ɛ0 the permittivity of free space. The higher value of 12.1 ± 2.8 μF cm−2 accounts for ∼20% of water (assuming a thickness of 5 nm for a diluted layer of molecules of 9 nm height and 2 nm for the CcO and water layer, respectively) being replaced by lipid molecules when the capacitance decreases to 7.1 ± 0.5 μF cm−2. The still high capacitance value can be explained considering the high surface coverage (more than 90%) found for CcO in the inverted orientation (17) with only a few lipid molecules inserted in between the proteins. This is also in agreement with the increase of the relative thickness obtained by SPR for the protein and lipid layer (Table 1). Impedance data of protein layers in both orientations are virtually the same, suggesting a similar high surface coverage of the CcO molecules (>90%).
Activation of the CcO with reduced cyt c monitored by impedance spectroscopy
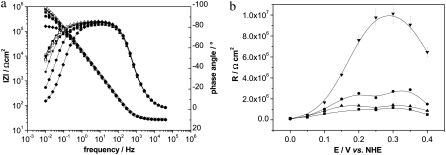
CcO with the his-tag attached to SU I has been reconstituted into a ptBLM before (15). In this configuration the cyt c binding site is oriented toward the outer side of the enzyme and can be activated by reduced cyt c. The membrane resistance Rm measured by impedance spectroscopy was shown to decrease if cyt c was added to the bulk solution (15). A proton current accounted for this decrease, which could be inhibited by cyanide. In this investigation impedance spectra of CcO in the tBLM were measured as a function of increasing concentration of reduced cyt c in an oxygen-saturated buffer solution at a bias potential of 0 mV versus Ag|AgCl, saturated KCl (Fig. 4 a). Parameter values of the equivalent circuit were fitted to the data (Fig. 3 d). The fitted Rm decreased exponentially as a function of the concentration of cyt c (Fig. 4 b).
FIGURE 4.
Impedance spectra of CcO embedded in a ptBLM recorded at a bias potential of +200 mV versus NHE, as a function of the concentration of reduced cyt c (a), black (0 M), red (2.3 × 10⁻⁴ M), green (5.6 × 10⁻⁴ M), blue (8.4 × 10⁻⁴ M), magenta (1.07 × 10⁻³ M), cyan (1.28 × 10⁻³ M), and orange (1.6 × 10⁻³ M). Spectra were fitted using the equivalent circuit shown in Fig. 3 d. Resistances thus obtained were plotted versus the concentration of cyt c (b). The decrease is considered in terms of proton transfer due to the activation with reduced cyt c.
Impedance spectra were recorded as a function of bias potential applied across the metal electrode ptBLM structure at different concentrations of cyt c. Results are shown in Fig. 5. Resistivities as a function of potential show a complex behavior with two maxima in the regions 160–200 mV and 300–350 mV and a minimum at ∼250 mV. As a control the resistivity of the CcO-ptBLM in the absence of cyt c was measured as a function of the potential (Fig. 5 b, down triangles).
FIGURE 5.
(a) A series of impedance spectra of CcO embedded in a ptBLM recorded at different bias potentials versus NHE at a fixed concentration of 1.8 × 10⁻⁴ M cyt c, black: +400 mV, red: +350 mV, green: +300 mV, yellow: +250 mV, pink: +200 mV, orange: +150 mV, cyan: +100 mV, magenta: +50 mV, violet: 0 mV. (b) Such spectra were recorded for various concentrations of cyt c. Resistivities for the different concentrations plotted versus potentials, (▾) 0 M, (•) 1.07 × 10⁻⁴ M, (▴) 1.82 × 10⁻⁴ M, (▪) 5.07 × 10⁻⁴ M.
These results can be understood in terms of proton translocation, the rate of which should increase with cyt c concentration. Proton translocation should lead to the formation of a potential difference across the lipid membrane, positive outside. For example, 50 mV were measured when CcO is reconstituted in liposomes and activated by cyt c (23). An additional potential difference applied to the membrane would affect the self-generated potential and, hence, proton transport. Positive potentials larger than 50 mV would inhibit proton translocation, in agreement with increased resistivities in the range 50–200 mV. The minimum at 250 mV, however, cannot be accounted for by proton translocation only. On the other hand, impedance spectra could also be affected by faradaic currents due to electron exchange of cyt c with the electrode. These currents could be taken into account by a charge-transfer resistance added to the equivalent circuit. Impedance spectroscopy, however, is not designed to separate faradaic from ion transfer processes. The method of choice to investigate faradaic processes, such as ET of cyt c is CV. This investigation is described in the next two sections.
Cyclic voltammetry in the presence of reduced cyt c
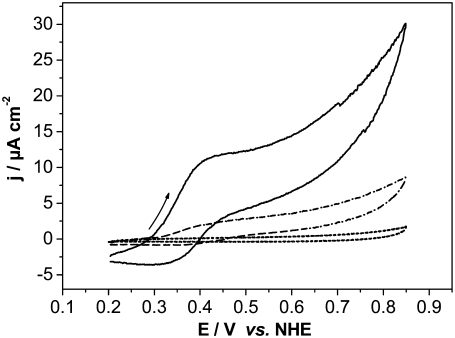
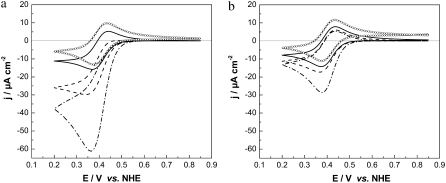
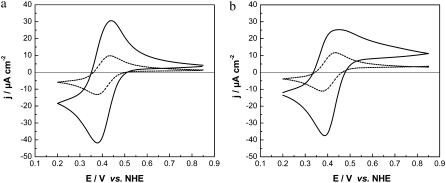
CVs were recorded with CcO reconstituted into a ptBLM and reduced cyt c added to the bulk solution in the absence and presence of oxygen (Fig. 6, solid and dash-dotted lines, respectively). Anodic (oxidation) waves were observed at potentials positive from 400 mV followed by smaller cathodic (reduction) waves at potentials negative from 400 mV. Peak potentials are bracketed around 400 mV versus NHE, similarly to voltammetric signals observed by Cullison et al. (9) and Burgess et al. (10). These authors measured the CVs of CcO reconstituted into a hybrid alkanethiol-phospholipid bilayer in the same orientation as in our case and also activated it by adding reduced cyt c.They discussed the anodic waves in terms of electrochemical oxidation of ferryl species of the enzyme at the level of heme a3/CuB. This conclusion was based on the redox potential of these species (∼350 mV), which is close to the value of 430 mV found for the anodic wave in their work (24). In our experiments, CVs of the reduced cyt c on a CcO-containing ptBLM under aerobic and anaerobic conditions show a clear increase of the current density of both cathodic and anodic currents (Fig. 6, solid and dash-dotted lines). Such amplification is characteristic of a catalytic current controlled by the turnover of the enzyme.
FIGURE 6.
Cyclic voltammogram of the CcO immobilized in a ptBLM alone (dotted line) with reduced cyt c added (1 mM in the bathing solution) under aerobic (solid line) and anaerobic conditions (dashed line), scan rate 50 mV/s.
To explain this amplification, we consider the electrochemical process of cyt c without oxygen
 |
(1) |
which gives rise to cathodic and anodic currents depending on the potential. In the presence of oxygen and with cyt cred present in the bulk phase, the enzymatic reaction will proceed concomitantly
 |
(2) |
The cyt cox that is formed in Eq. 2 has to be reduced repeatedly, resulting in an amplification of the cathodic current.
Moreover, following the idea of Hawkridge, the overall reaction Eq. 2 is expected to proceed via intermediate states of the CcO, such as the P/F states (P = peroxy, F = ferryl-oxo) (25). The P/F state, on the other hand, may be anodically oxidized according to
 |
(3) |
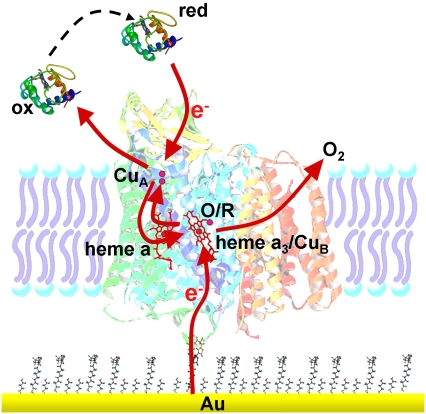
thus regenerating the oxidized state CcO (O) and O2. CcO (O), in turn, may be repeatedly reduced by the enzyme according to Eq. 2 to regenerate the P/F state, which may again be oxidized (Eq. 3), thus amplifying the anodic current (Eq. 6, Fig. 7).
FIGURE 7.
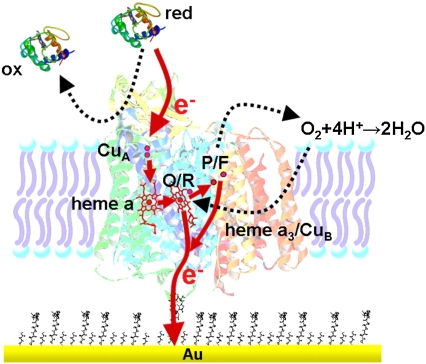
Schematic representation of the pathway of electrons (red arrows) through the enzyme in the case of an anodic current flowing through the electrode. Electrons are accepted by the heme a3/CuB catalytic center to form the R state which, after the uptake of oxygen, is transformed into the P and F states (25). Electrons can be taken up by the electrode either from the R state or from the P/F state. The P/F state is favored in the presence of an excess of cyt cred and oxygen.
In conclusion, in the presence of oxygen and cyt cred in the bulk solution, the substrates of both the cathodic and the anodic processes, cyt cox and CcO(P/F), respectively, are regenerated by the enzymatic reaction, giving rise to increased (catalytic) currents in both directions.
The consideration of intermediate states of the CcO for ET between cyt c and the electrode corresponds to the assumption of a hopping mechanism of electron exchange, following the terminology introduced by Armstrong (26). In this mechanism electrons proceed along the chain of redox sites inside the protein, with the final redox site exchanging electrons with the electrode. By contrast, in the nonhopping mode the substrate, e.g., cyt c, exchanges electrons directly with the electrode. The discrimination between the two processes is difficult, particularly considering that in the orientation used here the CcO alone without cyt c does not exchange electrons directly with the electrode. This is clearly shown in the reference measurement. No ET can be seen in the positive potential range (0.2–0.8 V versus NHE) (Fig. 6, dotted line), as well as in the negative one (−0.8–+0.2 V versus NHE), as shown in a previous publication (17). The absence of direct ET in the negative potential range was strongly supported by SERRS measurements (17). Unfortunately, SERRS measurements cannot be performed in the positive potential range. SERRS with an excitation at 415 nm has to be performed on an Ag electrode, which is not stable at positive potentials due to electrochemical (anodic) oxidation of the Ag metal.
An argument in favor of the hopping mechanism is the apparent redox potential of 400 mV obtained by CV (Fig. 6). This value is consistent with the standard potentials of heme a/a3 rather than that of cyt c, which is known to have a standard potential of 230 mV by CV. Another question, pertinent to this problem, is whether or not cyt c can penetrate the ptBLM architecture. This question cannot be addressed by electrochemistry. Cyt c will be reduced/oxidized at the electrode either way. However, IR spectroscopy of cyt c adsorbed to the CcO immobilized in the ptBLM via the his-tag on SU I rather than on SU II showed that it is highly unlikely that the ptBLM would be permeable to cyt c (27). This would make the hopping mechanism the preferred electron pathway, which seems to operate both ways in the reductive (cathodic) and oxidative (anodic) direction. However, a final decision about the type of mechanism cannot be made.
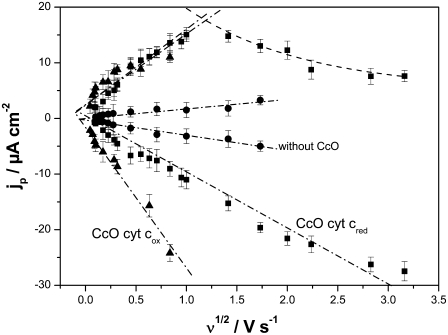
Catalytic currents with CcO immobilized on an electrode and cyt c in the reduced form were also measured by Dutton and co-workers (14). However, in their work CcO was present in the reverse orientation, electrostatically attached to cyt cred bound to a 3-mercapto-1-propanol modified gold film. In this case, cyt c is closest to the electrode, and CcO is bound to it with the cyt c binding site pointing toward the electrode. Cyt c can thus exchange electrons directly with the electrode in the nonhopping mode (26), in agreement with the standard potential of cyt c (+230 mV). Amplified anodic currents were found in the presence of oxygen, which is measurable, but only at low scan rates (2 mV s−1). By contrast, the catalytic effect of anodic and cathodic currents of the CcO in this investigation was measurable up to scan rates of 1 V s−1. This was shown by plotting the current densities recorded by CV, taken under aerobic conditions of cyt c in the reduced form in the absence (solid circles) and presence (solid squares) of CcO versus the scan rate (see Fig. 9). The currents are linearly dependent on the square root of the scan rate, consistent with a diffusion-controlled process (28). Another important phenomenon is that the anodic branch is linear only up to ∼1 V s−1 (see Fig. 9). After that, the current decreases in an exponential decay. This effect is considered in terms of the turnover of the enzyme (Eq. 2), which at some point is no longer able to follow the scan rate.
FIGURE 9.
Current densities of the peaks of cyt c reduction/oxidation as a function of the square root of the scan rate. Cyt c was applied in the reduced (▪) and oxidized (▴) states in the presence (▪, ▴) and absence (•) of CcO.
Cyclic voltammetry in the presence of oxidized cyt c
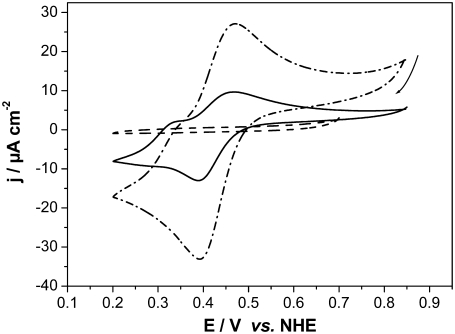
CVs were recorded using CcO with the his-tag attached to SU I and reconstituted into a ptBLM, and oxidized cyt c was added to the bulk solution in the absence and presence of oxygen (see Fig. 10, solid and dash-dotted lines, respectively). A reduction peak was obtained at 389 mV at a scan rate of 50 mV s−1 followed by a reoxidation peak at 468 mV. The apparent standard potential,  deduced from the potential difference between the reductive and oxidative peaks was +428 mV versus NHE. This corresponds to the peak potentials found with cyt cred in our experiments (Fig. 6) and also to the 430 mV reported in the work of Cullison et al. (9) and Burgess et al. (10).
FIGURE 10.
Cyclic voltammogram of CcO immobilized in a ptBLM alone (dashed line) with oxidized cyt c added (1 mM in the bulk solution) under aerobic (dash-dotted line) and anaerobic (solid line) conditions, scan rate 50 mV/s.
Peak heights are shown to increase in the presence of oxygen both in the cathodic (negative from 428 mV) and anodic direction (positive from 428 mV), indicating the catalytic activity of the enzyme. With an excess of cyt cox in the bulk solution, the cathodic current is considered the primary process to form cyt cred (Fig. 8) according to Eq. 1, whereas the potential changes in the negative direction. Without oxygen this process is simply proceeding in the reverse direction (according to Eq. 1) when the potential changes in the positive direction. In the presence of oxygen, however, cyt cred that is formed in the cathodic process is immediately consumed in the enzymatic reaction (Eq. 2), thereby regenerating cyt cox. Cyt cox, in turn, will be repeatedly reduced in the cathodic process, thereby giving rise to the amplified (catalytic) current. In addition, the reaction Eq. 3 may take place as in the case when cyt cred is present in the bulk solution.
FIGURE 8.
Schematic representation of the pathway of electrons (red arrows) through the enzyme in the case of a cathodic current flowing through the electrode. Cyt cox is reduced to form Cyt cred by the electrochemical reduction, as shown by the dotted black arrow (Eq. 2 in the text). Electrons travel in the direction opposite from Cyt cred to oxygen catalyzed by the enzyme, thereby regenerating cyt cox (Eq. 1).
Peak currents plotted versus the square root of the scan rate (Fig. 9, up triangles) of cyt cox in the presence (up triangles) and in the absence (Fig. 9, solid circles) of CcO show a linear dependency, indicating a diffusion-controlled process. Cathodic as well as anodic currents are clearly increased in the presence of CcO. This is explained in terms of the same reaction scheme as described in the previous paragraph. The amplification factor for the cathodic current is larger when cyt cox is present in the bulk solution than in the case of cyt cred described above.
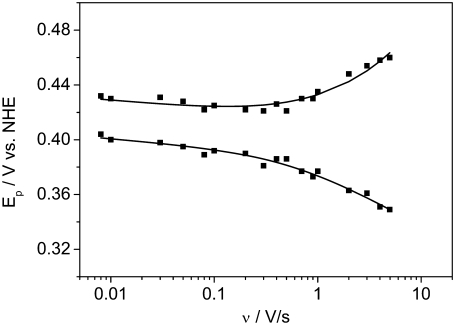
Another important finding of Fig. 10 is the prepeak at ∼320 mV that disappears at high scan rates (not shown). Such prepeaks are characteristic of redox species adsorbed to the electrode, in our case cyt cred immobilized on the surface (27). It can be concluded that cyt c is adsorbed to the CcO while it exchanges electrons with the electrode, although the amount adsorbed to the cyt c binding site is controlled by diffusion. This is in line with the relatively high ionic strength of the bulk solution. Assuming cyt c adsorbs to the CcO at least during reduction/oxidation, the kinetics of electron exchange can be evaluated using the so-called trumpet plot in which peak potentials are plotted versus the scan rate in a logarithmic scale (29). The trumpet plot (Fig. 11) was analyzed by means of the algorithm described by Jeuken et al. (30) assuming a one-electron process (26). The values for the heterogeneous rate constant  and the apparent standard potential
  were obtained.
FIGURE 11.
Peak potentials as a function of scan rate (trumpet plots) of cyt c (reduced) adsorbed to CcO with the his-tag attached to SU I under aerobic conditions. Concentration in the bathing solution 1 mM at a temperature of 20°C. The intrinsic rate constant and the standard potential were determined to be kS = 55.9 s−1 and E0 = 0.405 V.
A simple tunneling rate calculation indicates that such transfer rates can be obtained if cyt c is reduced via the heme a3/CuB binuclear center. The tunneling rate to the protein can be estimated as (31) (see also http://www.uphs.upenn.edu/biocbiop/local_pages/dutton_lab.html)
 |
(4) |
where R is the tunneling distance in Å, ΔG is the driving force, in this case equal to zero, and λ is the reorganization energy. A tunneling transfer rate of ∼250 s−1 is obtained with R = 20 Å and taking into account an extremely low reorganization energy of 0.25 eV, assuming that the electrons are transferred via the Ni as a transient electron acceptor. Then the electrons have to travel from there to the heme a3/CuB binuclear center, which is located ∼2 nm from the edge of the protein.
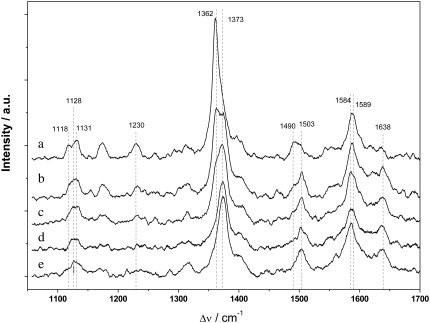
As a control experiment, a cyclic voltammogram of cyt cred on a DTP-modified surface gives the value of the standard potential (E0 = +230 mV, not shown), also obtained by potentiometry (24). This was corroborated by SERR spectra of cyt c on a roughened silver electrode modified with DTP taken at different potentials (Fig. 12). Cyt c is shown to be oxidized between +90 mV and +240 mV, in agreement with the standard potential of 230 mV. Unfortunately, SERRS measurements of cyt c reduction and oxidation adsorbed to CcO are not possible because of the thiolated layers that would be desorbed from the silver electrode at such positive potentials.
FIGURE 12.
SERR spectra of cyt cred adsorbed on a DTP-modified roughened Ag electrode immersed in buffer solution measured at different potentials. Spectra taken at (a) 40 mV, (b) 90 mV, (c) 140 mV, (d) 240 mV, and (e) 350 mV. More positive potentials cannot be applied because of irreversible damage to the Ag electrode.
Simulations of the CV data
To support the considerations given above with respect to the catalytic currents, simulations were performed using the commercial software DigiSim (version 3.03b) obtained from Bioanalytical Systems (Warwickshire, UK). This software can take into account only diffusion-controlled electrochemical processes coupled to no more than bimolecular chemical reactions. Due to these limitations, some simplifying assumptions had to be made.
Accordingly, Eq. 1 was simulated as a diffusion-controlled one-electron process with ks1 = 56 s−1 and  = 405 mV obtained from the evaluation of the trumpet plot. Concentrations of cyt c were varied from 1 mM to 0.18 mM, where the simulated data (see below, Fig. 13) correspond to the measured ones without oxygen (Figs. 6 and 10). The discrepancy between the actual concentration (1 mM) and the corresponding calculated peak heights can be because only a part of the cyt c in solution is adsorbed to the CcO so that the redox process ends up as an apparently diffusion-controlled process. The lower concentration (0.18 mM) was then considered for all further calculations.
FIGURE 13.
Simulation of the CVs of CcO immobilized in a ptBLM with cyt cox (a) and cyt cred (b) added to the bulk solution under anaerobic (open circles) and aerobic conditions, considering Eq. 1 coupled to Eq. 8. Parameters: E0 = 0.405 V, [cyt c] = 0.18 mM, [CcO] = 0.18 mM, [O2] = 0.256 mM, scan rate 50 mV/s, kS1 = 56 s−1, kf8 = 103 (solid line), 104 (dashed line), and 105 Mol l−1 s−1 (dash-dotted line).
Next the reaction of Eq. 1 was considered coupled to the full turnover of the enzyme (Eq. 2) reduced to a bimolecular reaction
 |
(5) |
Simulations were performed considering cyt cox (Fig. 13 a) and cyt cred (Fig. 13 b) present in the bulk solution in the presence of oxygen under saturating conditions. The rate constant of the enzymatic reaction (Eq. 5) was increased from k5 = 103 to 105 Mol l−1 s−1, representing different turnover rates. The heterogeneous rate constant was ks1 = 56 s−1 as before. Current densities increasing with the turnover rate were obtained in the presence of oxygen but only for the cathodic currents rather than the anodic ones. This is expected for a classical catalytic current of an oxidized species characterized by the electrochemical reduction of the reactant (cyt cox) followed by an enzymatic reaction of the product (cyt cred) (Eq. 5). The follow-up reaction restores the reactant in such a way that the product has to be reduced repeatedly, resulting in an amplified current. The effect is more pronounced if cyt cox is present in the bulk solution than in the case of cyt cred. This is in agreement with the experimental finding illustrated in Fig. 9, namely, that the amplification factor of the cathodic current is higher in the presence of cyt cox than in the presence of cyt cred. However, this calculation does not reflect the fact that in real processes not only cathodic but also anodic currents are amplified in the presence of oxygen (Fig. 10).
The increase of both the cathodic and anodic currents, regardless of the redox state of cyt c, can be accounted for by calculations based on the following (simplified) reaction scheme
 |
 |
(6) |
 |
(7) |
 |
(8) |
which includes the anodic oxidation of an intermediate redox state of the CcO (CcO (P)). Fig. 14 shows calculations starting with cyt c in the oxidized and reduced state using rate constants of the chemical reactions kf6 = kf7 = 103 Mol l−1 s−1 for both reactions in Eqs. 6 and 7. The other parameters are the same as before, and we assumed the heterogeneous rate constants to be identical kS1 = kS8 = 56 s−1. The simulated CV with cyt cox in the bulk solution corresponds to the measured data (Fig. 10) reasonably well except for the prepeak mentioned above. However, in the case of an excess of cyt cred, the CVs is shifted on the current axis in the cathodic direction with respect to the case of cyt cox in excess. Moreover, the asymmetry of the anodic and cathodic peaks of the measured data (Fig. 6) is not represented.
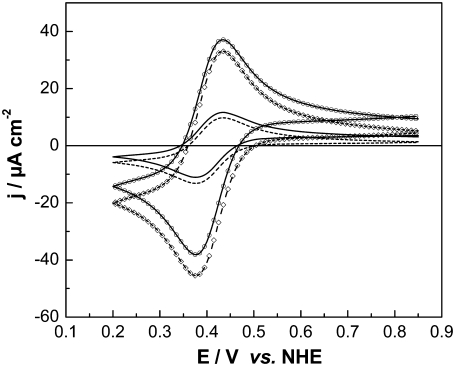
FIGURE 14.
Simulation of the CVs of CcO immobilized in a ptBLM with cyt cox (solid line and open circles) and cyt cred (dashed line and tilted squares) added to the bulk solution under anaerobic (solid and dashed lines) and aerobic (open circles and open tilted squares) conditions, considering Eq. 1 coupled to Eqs. 9–11. Parameters: E0 = 0.405 V, [cyt c] = 0.18 mM, [CcO] = 0.18 mM, [O2] = 0.256 mM, scan rate 50 mV/s, kS1 = 56 s−1, kf9 = kf10 = 103 Mol l−1 s−1.
To account for the asymmetry in the CV of reduced cyt c in the presence of oxygen (Fig. 6), the heterogeneous rate constant of the reoxidation of the peroxy state of the CcO (ks8 = 1 s−1) had to be decreased relative to kS1 = 56 s−1, whereas the rate constants of the chemical reactions were increased to kf6 = kf7 = 105 Mol l−1 s−1. In this case, the simulated curves are closer to the measured data (Figs. 6 and 10), as in the case of cyt cred (Fig. 15). The fitting of the experimental data, however, was not carried out further because of the shortcomings of the model.
FIGURE 15.
Simulation of the CVs of CcO immobilized in a ptBLM with cyt cox (a) and cyt cred (b) added to the bulk solution under anaerobic (dashed lines) and aerobic (solid lines) conditions, considering Eq. 1 coupled to Eqs. 9–11. Parameters: E0 = 0.405 V, [cyt c] = 0.18 mM, [CcO] = 0.18 mM, [O2] = 0.256 mM, scan rate 50 mV/s, kS1 = 56 s−1, kS11 = 1, kf9 = kf10 = 105 Mol l−1 s−1.
CONCLUSION
Electron exchange of cyt c with the electrode with CcO immobilized in a ptBLM was shown to be mediated by the enzyme if oxygen is present in the bulk solution. With the aid of simulations, we showed that the increasing current density in the anodic and cathodic direction in the presence of oxygen can be explained in terms of intermediate redox states of the CcO. This result is in favor of the hopping mechanism of ET through the enzyme between cyt c and the electrode, in agreement with the assumptions brought forward by Hawkridge. Direct ET to cyt c (Eq. 1) coupled to the full turnover (Eq. 2) would give rise only to an increase of the cathodic current. The discrimination between the hopping mechanism and the direct ET is difficult, particularly since the CcO alone in the orientation with the cyt c binding site pointing to the bulk solution does not exchange electrons directly with the electrode. Only when cyt c is added either in the reduced or oxidized form is electron exchange initiated in both the presence and absence of oxygen. However, direct ET between cyt c and the electrode is highly unlikely. The high surface coverage of the enzyme and the sealing properties of the bilayer lipid membrane prevent the cyt c from approaching the electrode surface and directly exchanging electrons with it.
Tunneling across the membrane is also unlikely considering the tunnel barrier of at least 10 nm, which is calculated from the height of the CcO (9 nm) (32) added to the thickness of the chelating layer. Direct ET between the enzyme and the electrode, on the other hand, without cyt c present, would be more likely to occur. The tunnel barrier between heme a3/CuB and the highly conductive electron wire, consisting of the Ni-chelating tether and the his-tag, is ∼2 nm. This direct ET, however, definitely does not take place, as conclusively demonstrated by reference experiments without cyt c (Figs. 6 and 10) and supported strongly by SERRS measurements (17). A possible explanation can be inferred from changes in the resonance Raman spectra of CcO after the binding of cyt c (33). These changes were considered to induce a conformational transition of CcO in the environment of both heme a and heme a3. Electrostatic interactions of cyt c with its binding site and a long-range communication with the catalytic site of the CcO are held to be responsible for this effect. It would account for the ligand gating to heme a3 due to the binding of cyt c to CcO.
In any case, proton transfer initiated by the CcO in the presence of cyt c is accompanied by ET at almost all potentials considered in this investigation. Impedance spectroscopy, however, is not designed to separate faradaic from ion transfer processes. A detailed analysis of the impedance spectra was, therefore, not considered.
In summary, this study shows that CcO immobilized on a metal film can be activated by cyt c oxidation/reduction. This opens new possibilities to investigate the enzyme by potential-triggered surface-enhanced vibrational spectroscopy methods, IR and Raman spectroscopy among them. It also demonstrates the possibilities of the ptBLM as a general platform for further investigations with other proteins or for protein-protein interaction studies.
Acknowledgments
B.L. acknowledges support by Deutsche Forschungsgemeinschaft (SFB 472) and Cluster of Excellence Frankfurt “Macromolecular Complexes”.
We thank Christian Gross for protein purification.
Marcel G. Friedrich's present address is Harvard University, Dept. of Chemistry and Chemical Biology, 12 Oxford Street, Cambridge, MA 02138.
Editor: José Onuchic.
References
- 1.Guidelli, R., G. Aloisi, L. Becucci, A. Dolfi, M. R. Moncelli, and F. T. Buoninsegni. 2001. New directions and challenges in electrochemistry: bioelectrochemistry at metal/water interfaces. J. Electroanal. Chem. 504:1–28. [Google Scholar]
- 2.Knoll, W., K. Morigaki, R. Naumann, B. Sacca, S. Schiller, and E. K. Sinner. 2004. Functional tethered bilayer lipid membranes. In Ultrathin Electrochemical Chemo- and Biosensors, Technology and Performance. V. M. Mirsky, editor. Springer Verlag, Berlin. 239–254.
- 3.Römer, W., and C. Steinem. 2004. Impedance analysis and single-channel recordings on nano-black lipid membranes based on porous alumina. Biophys. J. 86:955–965. [DOI] [PMC free article] [PubMed] [Google Scholar]
- 4.Cornell, B. A., V. L. B. Braach-Maksvytis, L. G. King, P. D. J. Osman, B. Raguse, L. Wieczorek, and R. J. Pace. 1997. A biosensor that uses ion-channel switches. Nature. 387:580–583. [DOI] [PubMed] [Google Scholar]
- 5.Schiller, S. M., R. Naumann, K. Lovejoy, H. Kunz, and W. Knoll. 2003. Archaea analogue thiolipids for tethered bilayer lipid membranes on ultrasmooth gold surfaces. Angew. Chem. Int. Ed. 42:208–211. [DOI] [PubMed] [Google Scholar]
- 6.Naumann, R., D. Walz, S. M. Schiller, and W. Knoll. 2003. Kinetics of valinomycin-mediated K+ ion transport through tethered bilayer lipid membranes. J. Electroanal. Chem. 550:241–252. [Google Scholar]
- 7.Becucci, L., R. Guidelli, C. Peggion, C. Toniolo, and M. R. Moncelli. 2005. Incorporation of channel-forming peptides in a Hg-supported lipid bilayer. J. Electroanal. Chem. 576:121–128. [Google Scholar]
- 8.He, L. H., J. W. F. Robertson, J. Li, I. Karcher, S. M. Schiller, W. Knoll, and R. Naumann. 2005. Tethered bilayer lipid membranes based on monolayers of thiolipids mixed with a complementary dilution molecule. 1. Incorporation of channel peptides. Langmuir. 21:11666–11672. [DOI] [PubMed] [Google Scholar]
- 9.Cullison, J. K., F. M. Hawkridge, N. Nakashima, and Sh. Yoshikawa. 1994. A study of cytochrome c oxidase in lipid bilayer membranes on electrode surfaces. Langmuir. 10:877–882. [Google Scholar]
- 10.Burgess, J. D., M. C. Rhoten, and F. H. Hawkridge. 1998. Cytochrome c oxidase immobilized in stable supported lipid bilayer membranes. Langmuir. 14:2467–2475. [Google Scholar]
- 11.Naumann, R., E. K. Schmidt, A. Jonczyk, K. Fendler, B. Kadenbach, T. Liebermann, A. Offenhäusser, and W. Knoll. 1999. The peptide-tethered lipid membrane as a biomimetic system to incorporate cytochrome c oxidase in a functionally active form. Biosens. Bioelectron. 14:651–662. [Google Scholar]
- 12.Jeuken, L. C., S. D. Connell, M. Nurnabi, J. O'Reilly, P. J. F. Henderson, St. D. Evans, and R. J. Bushby. 2005. Direct electrochemical interaction between a modified gold electrode and a bacterial membrane extract. Langmuir. 21:1481–1488. [DOI] [PMC free article] [PubMed] [Google Scholar]
- 13.Jeuken, L. J. C., S. D. Connell, P. J. F. Henderson, R. B. Gennis, St. D. Evans, and R. J. Bushby. 2006. Redox enzymes in tethered membranes. J. Am. Chem. Soc. 128:1711–1716. [DOI] [PMC free article] [PubMed] [Google Scholar]
- 14.Haas, A. S., D. L. Pilloud, K. S. Reddy, G. T. Babcock, C. C. Moser, J. K. Blasie, and P. L. Dutton. 2001. Cytochrome c and cytochrome c oxidase: monolayer assemblies and catalysis. J. Phys. Chem. B. 105:11351–11362. [Google Scholar]
- 15.Giess, F., M. G. Friedrich, J. Heberle, R. L. Naumann, and W. Knoll. 2004. The protein-tethered lipid bilayer: a novel mimic of the biological membrane. Biophys. J. 87:3213–3220. [DOI] [PMC free article] [PubMed] [Google Scholar]
- 16.Friedrich, M. G., F. Giess, R. Naumann, W. Knoll, K. Ataka, J. Heberle, J. Hrabakova, D. H. Murgida, and P. Hildebrandt. 2004. Active site structure and redox processes of cytochrome c oxidase immobilised in a novel biomimetic lipid membrane on an electrode. Chem. Comm. (Camb.). 21:2376–2377. [DOI] [PubMed] [Google Scholar]
- 17.Friedrich, M. G., J. W. R. Robertson, D. Walz, W. Knoll, and R. L. C. Naumann. 2008. Electronic wiring of cytochrome c oxidase in a biomimetic surface architecture. Biophys. J. 94:3698–3705. [DOI] [PMC free article] [PubMed] [Google Scholar]
- 18.Lucioli, S., K. Hoffmeier, R. Carrozozzo, A. Tessa, B. Ludwig, and F. M. Santorelli. 2006. Introducing a novel human mtDNA mutation into the Paracoccus denitrificans COX I gene explains functional deficits in a patient. Neurogenetics. 7:51–57. [DOI] [PubMed] [Google Scholar]
- 19.Naumann, R., S. M. Schiller, F. Giess, B. Grohe, K. B. Hartman, I. Kärcher, I. Köper, J. Lübben, K. Vasilev, and W. Knoll. 2003. Tethered lipid bilayers on ultra flat gold surfaces. Langmuir. 19:5435–5443. [Google Scholar]
- 20.Vanderkooi, J. M., G. Maniara, T. J. Green, and D. F. Wilson. 1987. An optical method for measurement of dioxygen concentration based upon quenching of phosphorescence. J. Biol. Chem. 262:5476–5482. [PubMed] [Google Scholar]
- 21.Smith, P. E., R. M. Brunne, A. E. Mark, and W. F. Van Gunsteren. 1993. Dielectric properties of trypsin inhibitor and lysozym calculated from molecular dynamics simulations. J. Phys. Chem. 97:2009–2014. [Google Scholar]
- 22.Reference deleted in proof.
- 23.Ivashchuk-Kienbaum, Yu. A. 1996. Monitoring of the membrane potential in proteoliposomes with incorporated cytochrome c oxidase using the fluorescent dye indocyanine. J. Membr. Biol. 151:247–259. [DOI] [PubMed] [Google Scholar]
- 24.Moody, A. J., U. Brandt, and P. R. Rich. 1991. Single electron reduction of ‘slow’ and ‘fast’ cytochrome-c oxidase. FEBS Lett. 293:101–105. [DOI] [PubMed] [Google Scholar]
- 25.Richter, O.-M. H., and B. Ludwig. 2003. Cytochrome c oxidase: structure, function and physiology of a redox-driven molecular machine. Rev. Physiol. Biochem. Pharmacol. 147:47–74. [DOI] [PubMed] [Google Scholar]
- 26.Jeuken, L. J. C., A. K. Jones, St. K. Chapman, G. Cecchini, and F. Armstrong. 2002. Electron-transfer mechanisms through biological redox chains in multicenter enzymes. J. Am. Chem. Soc. 124:5702–5713. [DOI] [PubMed] [Google Scholar]
- 27.Ataka, K., B. Richter, and J. Heberle. 2006. Orientational control of the physiological reaction of cytochrome c oxidase tethered to a gold electrode. J. Phys. Chem. B. 110:9339–9347. [DOI] [PubMed] [Google Scholar]
- 28.Bard, A. J., and L. R. Faulkner. 2001. Electrochemical Methods: Fundamentals and Applications, 2nd ed. John Wiley & Sons, New York.
- 29.Laviron, E. 1979. General expression of the linear potential sweep voltammogram in the case of diffusionless electrochemical systems. J. Electroanal. Chem. 101:19–28. [Google Scholar]
- 30.Jeuken, L. J. C., J. P. McEvoy, and F. A. Armstrong. 2002. Insights into gated electron-transfer kinetics at the electrode-protein interface: a square wave study of the blue copper protein azurin. J. Phys. Chem. B. 106:2304–2313. [Google Scholar]
- 31.Moser, C. C., J. M. Keske, K. Warncke, R. S. Farid, and P. L. Dutton. 1992. Nature of biological electron transfer. Nature. 355:796–802. [DOI] [PubMed] [Google Scholar]
- 32.Svensson-Ek, M., J. Abramson, G. Larsson, S. Tornroth, P. Brzezinski, and S. Iwata. 2002. The x-ray crystal structures of wild-type and EQ(I-286) mutant cytochrome c oxidases from Rhodobacter sphaeroides. J. Mol. Biol. 321:329–339. [DOI] [PubMed] [Google Scholar]
- 33.Hildebrandt, P., F. Vanhecke, G. Buse, T. Soulimane, and A. G. Mauk. 1993. Resonance Raman study of the interactions between cytochrome c variants and cytochrome c oxidase. Biochemistry. 32:10912–10922. [DOI] [PubMed] [Google Scholar]


